
Market Research Birdie Golfer
Part A
1) Identifying management decision problem statement and management research question:
Management decision problem statement:
In this research, the management has pointed out some management decision problem and in order to resolve the problem, the management first identifies the problem that occurs to develop Bridie Golfer. In this case, the company has to appoint a celebrity in order to endorse the golf club. In this regard, the management has not yet decided the name of a celebrity to endorse the golf club. In this regard, the quality of the celebrity is still not decided that match with the market where the management will operate. In this case, the gender of the celebrity, age of the celebrity is the matter to decide. In addition to that, it should be decided by the management whether the celebrity will have the knowledge of golf or not. The risk will also be discussed what kind of risk will be there is also the matter of decision that will be a problem to the management. In this regard, the management has decided three names of celebrity but how to proceed to communicate with the celebrity is the problem to the management.
Rationale:
In this case, the management has to work on the problems of the management otherwise it will be difficult for the management to develop the market of the golf club, in this case, a celebrity has to be appointed by the management in order to endorse the Birdie golfer. In effect of this, the management of the golf club will be able to develop the marketing communication plan by which the management can be able to attract more female golf player to the golf club. In addition to that, the management of the golf club can be able to compete with the other golf club in the market.
Management research question:
In order to conduct the research the management has to develop some question by solving the question the management can be able to identify the objective of the research. In this case, the research questions are:
- What will be a scheme of the membership who will come to the golf club to play?
- What will be the fees structure of the golf club?
- What will the market communication strategy?
- What will be the strategy in order to expand the golf club internationally?
Rationale:
In this case, the management will solve the research question in order to clarify the objective of the research. In this case, a clear objective is required in order to understand the business motive of the management. In addition to that, the management can be able to identify the aims of the business and the management will be able to achieve the objective of the business by solving the research question. Additionally, it will be easier for the management to expand their business by solving the research question and internationally they can be able to expand their business. In this case, the research objectives of the management are:
- In order to expand the business, the research is required.
- In order to adopt the proper business communication process, the research is required.

2) Research Methodology
In this case, the research designs are made on the golf club of Australia that is Birdie Golfer. While carrying out the research design, the primary research methods are carried out to get the real and relevant information. This golf club has increased the sporting culture in Australia. From the research, it has been estimated that more women golfers are prone in playing of golf as compared with the male golfers. In order to get more information, the researcher has conducted mixed research method (Taylor et al. 2015). In the mixed research method, the researcher can address properly both the qualitative and quantitative research method. In the qualitative method, the researcher can conduct an interview with female and male golfers of Birdie golfer in Australia. Moreover, Birdie Golfer has created an active sporting of golf and also covers suitable climate helps to increase the participants. In the quantitative research method, the researcher can get relevant information by conducting surveys in the community of Birdie Golfer. It has been also found by the researcher that main markets are based on the female golfers. From estimation, it has been found that the figures of the female golfers are increasing with the registered members of the golf club. In the qualitative analysis, a small group is made by the researcher and carried out the open-ended question while conducting of the interview. In the quantitative analysis is made by taking into proper groups and carried out a close-ended question while conducting a survey (Mackey and Gass, 2015). This survey data are transformed into the raw data to get the correct information. The real and realistic data can be only found by the researcher based on interview and survey. Moreover, the management can use celebrities to get the brand values in the products of golf. There rise many questions based on the promotion of golf club in the women of Australia.
Sampling Techniques:
There are basically two methods of sampling techniques used in the research study. These are probability and non-probability sampling techniques. The study can take the sample of 20 female and 10 male golf players to conduct the study. The correct approach helps in getting the better data for the study. The proper conducting of the sampling techniques helps to get the proper information on the number of people wanted to play the golf as an active sport. This sampling technique helps to know that the female golf players are more in number than the male golf players.
Data Analysis Techniques:
There are basically three processes while carrying out the data analysis techniques. These comprise mixed, qualitative and quantitative data analysis techniques. This study helps to conduct the mixed or triangulation methods for carrying out both the interview and survey (Silverman, 2016). Both the qualitative and quantitative research methods are carried out to get the real and realistic data. Moreover, the mixed research method helps to get the information for the female and male golf players.
Data Collection Methods:
Data are generally collected by two processes and these are primary and secondary data collection. Primary data are made by the collection of new or real formed data from surveyor interviews and secondary data are made from existing data that are obtained from the journal, books. In this study, the primary research methods are conducted to get the real data. The primary research methods are conducted to get the accurate information from interviews and survey (Glesne, 2015). The interview creates open-ended questions about the main causes of interest for playing golf for the female and male. The survey creates close-ended question from the golf players and also from the management of Birdie Golfer.
3) Focusing on the data-collection instrument on the questionnaire items:
In this study, the primary data collection is given more focus than secondary data collection. In the primary data collection, the research has conducted both the qualitative and quantitative research methods. In the qualitative research method, the interview is mainly focused and quantitative research method is conducted through a survey. The researcher has conducted both the process of interviews and survey (Cyr, 2016). The primary research methods are conducted in order to get real and relevant data. It also helps in the growth of the business while conducting the primary research methods. Moreover, the relevant information helps the researcher in getting exact data collection.
The instrument used in the data collection methods is a questionnaire. In both the research method, the interview and survey rise up a questionnaire from the management and golf players. The qualitative methods provide with the interview that forms an evidence or information (Schobel et al. 2014). In order to conduct the interview, there are certain types of properly conducting the interview. This interview belongs to semi-structured interview, unstructured and structured interview. Moreover, while conducting the interview, the main focus is made on the sampling techniques. While the interview is conducted with the small group then the proper sampling techniques help to complete the research work. The proper conducting of interview takes a lot of time to complete the research work.
The survey research work is conducted on the quantitative method. In order to conduct the survey, the researcher has to create groups or individuals. The survey research is an important process in which the researcher explains the programs in the group (Fusch and Ness, 2015). While conducting the survey research helps to get proper information or data from an exact place or locations. In this study, the location is Birdie Golfer in Australia that helps in conducting the survey research. The survey research work is suited more as compared to interview. Moreover, the survey research works take less time and the interviews take more time. The survey research works help to get the data at a particular location. The research work also helps in reducing the cost at the time of business expansion. The proper survey helps to know the cost-effectiveness required at the time of expansion of Birdie Golf club. The proper conducting of survey research helps to calculate the cost required in business expansion. In order to now the current trends in technology, the proper survey work helps in identify the technical aspects that are used in the business expansion. In the previous year, the company made scientific data to increase the market share at Australia. The proper research works also helps to know the rival company that also deals with the sport activity (Geijzendorffer et al.2015). The company has to know the rival company at the time of business expansion. The proper conducting of research helps the management to know about the structure and strategy of the business. The structure and strategy helps the business to expand in the local and also at international level. The marketing strategy helps in getting more golf players in the Birdie Golf club. The market strategy is obtained from the proper research work based on survey. Increasing number of players in golf club helps to gain more money.
Addressing the research objective:
The researcher has focused on the research objective in order to expand the business of Birdie Golfer.
1) The proper expansion of business work is highly required with research work. The research work helps to progress new opening of business in golf. While conducting the survey and interview helps in expanding the business in international level.
2) The management has to adopt new techniques in order to expand the business on a large scale in Australia. In this situation, the management of golf club has also introduced celebrity to make new competitive advantage by new planning. The management has introduced new marketing plan for the coming year and gets a major portion in the communication budget.
4) Limitations of the research design
The research has been based on the qualitative and quantitative data collected from different people. The data that has been collected here for the purpose is primary data. The collection process has been questioning people through open-ended and close-ended question. In this regard, it can be further stated that the quantitative analysis has been based on the answers derived from the close-ended question. In deriving concrete results and analyzing the data correctly statistical tools have been used. The limitation of this research design has been that the scope of correction of errors in the data if any is minimal. The accuracy of secondary is more than that of the primary data, this is because these data sets are generally processed several time and undergoes various filtration process (Atieno, 2009). This is problematic in case of primary data, as the filtration process is less stringent the probability of error contained in this data sets are more. This has the potential of portraying the facts in a faulty manner. In this regard the other limitation of the research that it has been evident here is that the research has been primarily city-based and have been clustered towards a certain section of the society, this has the potential of not revealing the true picture (Mackey. and Gass, 2015). The other limitation of this research design lie in the samples collected for the purpose and not being a complete enumeration, the possibility of choosing similar sample multiple times are common and this leads to a biased representation of data. In conducting the research it has been evident that communicating with people was a great problem. This has limited the research by a great deal. In this regard, the main barrier is the accent and the language. It can be further stated that the world is globalised it can be stated that people are multilingual and developing in any one particular language has posed difficulties for the interviewer and the interviewee. This has the potential to impact the research and in turn the company (Packard, 2008).
In this regard, the other limitation that has been evident has been the limitation of time and money. This has refrained research from taking place in a much structured and efficient way. Due to lack of time and money many sections of the country having potent golf players and a latent market for golf clubs could not be explored for this. In this regard, it can be further stated that have there been sufficient money all the cross sections could have been appropriately researched in finding the demand and the potent market. The other limitation of this research has been the lack of people and researchers having the knowledge of quantifying the data and the drawing the quantitative analysis. It has also been evident that in drawing the secondary data there have been difficulties in accessing them which have been a major drawback (Campbell and Stanley, 2015). In this regard, it can be stated that this has not allowed the data collected in this regard to be compared to that of other projects. This has been a major limitation for the research that has been conducted. The other limitation of this research has been that it has not been able to identify the appropriate target market for the product. This is due to the limitation of time and money which has barred it from investigating and discovering new and potential market. In this regard, it can be further stated that this has limited and concentrated the research to a certain area of the country.
Part B
Frequencies
|
Statistics | ||
|
Unit materials - learning | ||
|
N |
Valid |
196 |
|
Missing | 0 | |
|
Unit materials – learning | |||||
Frequency | Percent | Valid Percent | Cumulative Percent | ||
Valid | .00 | 5 | 2.6 | 2.6 | 2.6 |
Not important | 58 | 29.6 | 29.6 | 32.1 | |
3.00 | 1 | .5 | .5 | 32.7 | |
4.00 | 17 | 8.7 | 8.7 | 41.3 | |
5.00 | 26 | 13.3 | 13.3 | 54.6 | |
6.00 | 37 | 18.9 | 18.9 | 73.5 | |
Very important | 52 | 26.5 | 26.5 | 100.0 | |
Total | 196 | 100.0 | 100.0 | ||
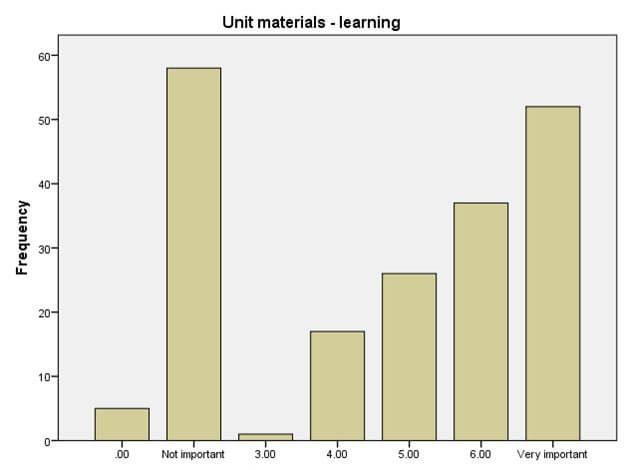
In this regard in analyzing this question, it has been evident that the sixth option has been the most favored option reflecting a percentage of 18.9 percent and reflecting a cumulative percentage of 73.5 %. In this regard, it can be stated that this has been the most obvious choice.
Descriptive
|
Descriptive Statistics | |||||
N | Minimum | Maximum | Mean | Std. Deviation | |
Unit materials – learning | 196 | .00 | 7.00 | 4.3112 | 2.50744 |
Valid N (listwise) | 196 | ||||
In this regard, it has been evident from here that the range has been in between 0 and 7. The observed mean has been 4.3122 and the deviation from the mean has been 2.5 in different instances. In this regard, it can be stated that there is considerable variation in the data.
{`T-TEST GROUPS=INTNL(1 2)
/MISSING=ANALYSIS
/VARIABLES=Q1 Q2 Q3 Q4 Q5 Q6 Q7 Q8 Q9 Q10 Q11 Q12 Q13 Q14 Q15 Q16 Q17 Q18 Q19 Q20
/CRITERIA=CI(.95).
`}
T-Test
Group Statistics
International Student | N | Mean | Std. Deviation | Std. Error Mean | |
Unit materials - learning | International Student | 152 | 4.0592 | 2.56888 | .20836 |
Domestic Student | 40 | 5.1250 | 2.17430 | .34379 | |
|
Unit materials - knowledge and skills | International Student | 152 | 4.0724 | 2.37007 | .19224 |
Domestic Student | 40 | 4.9250 | 2.04297 | .32302 | |
|
Teaching methods - help to learn | International Student | 152 | 4.3882 | 2.42517 | .19671 |
Domestic Student | 40 | 5.3000 | 2.16262 | .34194 | |
Topics and content | International Student | 152 | 4.8684 | 2.62359 | .21280 |
Domestic Student | 40 | 5.4500 | 2.40672 | .38054 | |
Assessment tasks | International Student | 152 | 4.8684 | 2.61601 | .21219 |
Domestic Student | 40 | 5.5250 | 2.44936 | .38728 | |
Guidelines and criteria | International Student | 152 | 6.1908 | 1.43159 | .11612 |
Domestic Student | 40 | 5.8500 | 2.00704 | .31734 | |
Requirement of overall assessment program | International Student | 151 | 5.7748 | 1.13239 | .09215 |
Domestic Student | 40 | 6.0000 | 1.13228 | .17903 | |
Resources - help to learn | International Student | 152 | 6.1316 | .88163 | .07151 |
Domestic Student | 40 | 5.8875 | .88786 | .14038 | |
Feedback from students used | International Student | 152 | 5.3421 | 1.80546 | .14644 |
Domestic Student | 40 | 5.9750 | .80024 | .12653 | |
Overall importance of unit | International Student | 152 | 5.4079 | 1.43446 | .11635 |
Domestic Student | 40 | 5.5750 | 1.00989 | .15968 | |
Teaching staff - understanding expectations | International Student | 152 | 5.7237 | 1.52332 | .12356 |
Domestic Student | 40 | 5.7500 | 1.42775 | .22575 | |
Teaching staff - class atmosphere |
International Student | 152 | 5.6447 | 1.64138 | .13313 |
Domestic Student | 40 | 6.1250 | 1.09046 | .17242 | |
|
Teaching staff - friendly, enthusiastic, helpful | International Student | 152 | 6.3224 | .78565 | .06372 |
Domestic Student | 40 | 6.3000 |
.72324 | .11435 | |
Teaching staff - genuine interest | International Student | 152 | 5.8355 | 1.10054 | .08927 |
Domestic Student | 40 | 6.0500 | .95943 | .15170 | |
Teaching staff - feedback | International Student | 152 | 6.2171 | .89825 | .07286 |
Domestic Student | 40 | 6.4750 | .78406 | .12397 | |
Teaching staff - developing knowledge, understanding and skills | International Student | 152 | 5.9737 | 1.09754 | .08902 |
Domestic Student | 40 | 6.4250 | .81296 | .12854 | |
Use of T&L resources and aids | International Student | 152 | 6.0724 | .98399 | .07981 |
Domestic Student | 40 | 6.0250 | 1.07387 | .16979 | |
Use of student feedback to improve teaching | International Student | 152 | 5.7566 | 1.07344 | .08707 |
|
Domestic Student | 40 | 6.0750 | .76418 | .12083 | |
Teaching, learning and assessment tasks used to help students learn | International Student | 152 | 5.7105 | .90350 | .07328 |
Domestic Student | 40 | 5.6250 | 1.16987 | .18497 | |
Overall importance of teaching | International Student | 152 | 6.0066 | .97991 | .07948 |
Domestic Student | 40 | 6.2500 | .86972 | .13751 |
It has been apparent from this section that the mean has been in between 4 and 7 and the standard deviation among all the data sets have been in-between 0 and 3.
|
Independent Samples Test | ||||||||||
|
Levene's Test for Equality of Variances | t-test for Equality of Means | |||||||||
F | Sig. | T | df | Sig. (2-tailed) | Mean Difference | Std. Error Difference | 95% Confidence Interval of the Difference | |||
Lower | Upper | |||||||||
Unit materials - learning | Equal variances assumed | 9.301 | .003 | -2.406 | 190 | .017 | -1.06579 | .44301 | -1.93965 | -.19193 |
Equal variances not assumed |
-2.651 | 70.459 | .010 | -1.06579 | .40200 | -1.86746 | -.26412 | |||
Unit materials - knowledge and skills | Equal variances assumed | 10.312 | .002 | -2.080 | 190 | .039 | -.85263 | .40991 | -1.66120 | -.04406 |
Equal variances not assumed | -2.268 | 69.273 | .026 | -.85263 | .37590 | -1.60247 | -.10279 | |||
Teaching methods - help to learn | Equal variances assumed | 5.664 | .018 | -2.162 | 190 | .032 | -.91184 | .42181 | -1.74387 | -.07981 |
Equal variances not assumed | -2.311 | 67.184 | .024 | -.91184 | .39448 | -1.69919 | -.12449 | |||
Topics and content | Equal variances assumed | 3.832 | .052 | -1.268 | 190 | .206 | -.58158 | .45858 | -1.48614 | .32298 |
Equal variances not assumed | -1.334 | 65.551 | .187 | -.58158 | .43600 | -1.45218 | .28903 | |||
Assessment tasks | Equal variances assumed | 1.627 | .204 | -1.431 | 190 | .154 | -.65658 | .45895 | -1.56188 | .24872 |
Equal variances not assumed | -1.487 | 64.429 | .142 | -.65658 | .44160 | -1.53866 | .22550 | |||
Guidelines and criteria | Equal variances assumed | 4.673 | .032 | 1.224 | 190 | .223 | .34079 | .27847 | -.20850 | .89008 |
Equal variances not assumed | 1.008 | 49.911 | .318 | .34079 | .33792 | -.33797 | 1.01955 | |||
Requirement of overall assessment program | Equal variances assumed | .006 | .937 | -1.118 | 189 | .265 | -.22517 | .20136 | -.62238 | .17205 |
Equal variances not assumed | -1.118 | 61.285 |
.268 |
-.22517 |
.20135 |
-.62776 |
.17743 | |||
|
Resources - help to learn |
Equal variances assumed |
2.200 |
.140 |
1.556 |
190 |
.121 |
.24408 |
.15690 |
-.06541 |
.55356 |
|
Equal variances not assumed | 1.549 | 60.808 | .127 | .24408 | .15755 | -.07098 | .55913 | |||
Feedback from students used | Equal variances assumed | 10.260 | .002 | -2.159 | 190 | .032 | -.63289 | .29319 | -1.21122 | -.05457 |
Equal variances not assumed | -3.270 | 145.863 | .001 | -.63289 | .19353 | -1.01538 | -.25040 | |||
Overall importance of unit |
Equal variances assumed | .693 | .406 | -.692 | 190 | .490 | -.16711 | .24136 | -.64319 | .30898 |
Equal variances not assumed | -.846 | 85.204 | .400 | -.16711 | .19757 | -.55992 | .22570 | |||
Teaching staff - understanding expectations | Equal variances assumed | .004 | .947 | -.098 | 190 | .922 | -.02632 | .26730 | -.55358 | .50095 |
Equal variances not assumed | -.102 | 64.374 | .919 | -.02632 | .25735 | -.54037 | .48774 | |||
Teaching staff - class atmosphere | Equal variances assumed | .939 | .334 | -1.750 | 190 | .082 | -.48026 | .27445 | -1.02162 | .06110 |
Equal variances not assumed | -2.205 | 91.014 | .030 | -.48026 | .21784 | -.91297 | -.04756 | |||
Teaching staff - friendly, enthusiastic, helpful | Equal variances assumed | .025 | .876 | .163 | 190 | .871 | .02237 | .13741 | -.24868 | .29341 |
Equal variances not assumed | .171 | 65.355 | .865 | .02237 | .13091 | -.23905 | .28379 | |||
Teaching staff - genuine interest | Equal variances assumed | .400 | .528 | -1.125 | 190 | .262 | -.21447 | .19069 | -.59062 | .16167 |
Equal variances not assumed | -1.218 | 68.561 | .227 | -.21447 | .17601 | -.56565 | .13671 | |||
Teaching staff - feedback | Equal variances assumed | .028 | .868 | -1.657 | 190 | .099 | -.25789 | .15567 | -.56497 | .04918 |
Equal variances not assumed | -1.793 | 68.484 | .077 | -.25789 | .14379 | -.54480 | .02901 | |||
Teaching staff - developing knowledge, understanding and skills | Equal variances assumed | .445 | .505 | -2.429 | 190 | .016 | -.45132 | .18578 | -.81778 | -.08485 |
Equal variances not assumed | -2.886 | 80.596 | .005 | -.45132 | .15636 | -.76244 | -.14019 | |||
Use of T&L resources and aids | Equal variances assumed | .245 | .621 | .266 | 190 | .791 | .04737 | .17826 | -.30424 | .39898 |
Equal variances not assumed | .252 | 57.414 | .802 | .04737 | .18762 | -.32827 | .42301 | |||
Use of student feedback to improve teaching | Equal variances assumed | 6.963 | .009 | -1.761 | 190 | .080 | -.31842 | .18084 | -.67514 | .03830 |
Equal variances not assumed | -2.138 | 84.157 | .035 | -.31842 | .14893 | -.61458 | -.02227 | |||
Teaching, learning and assessment tasks used to help students learn | Equal variances assumed | 3.546 | .061 | .499 | 190 | .618 | .08553 | .17134 | -.25245 | .42350 |
Equal variances not assumed | .430 | 51.874 | .669 | .08553 | .19896 | -.31374 | .48479 | |||
Overall importance of teaching | Equal variances assumed | .249 | .618 | -1.429 | 190 | .155 | -.24342 | .17030 | -.57934 | .09250 |
Equal variances not assumed | -1.533 | 67.465 | .130 | -.24342 | .15883 | -.56041 | .07357 | |||
It has been evident from the above part and in conducting the T-test that it is a multivariate case and there is a huge variation in the groups of data that has been collected. It has been evident that as the variation in the data groups is enormous it provides a highly robust T-test.
ANOVA
Sum of Squares | Df | Mean Square | F | Sig. | ||
Unit materials - learning | Between Groups | 729.444 | 3 | 243.148 | 94.014 | .000 |
Within Groups | 496.571 | 192 | 2.586 | |||
Total | 1226.015 | 195 | ||||
Unit materials - knowledge and skills | Between Groups | 666.277 | 3 | 222.092 | 109.181 | .000 |
Within Groups | 390.559 | 192 | 2.034 | |||
Total | 1056.837 | 195 | ||||
Teaching methods - help to learn | Between Groups | 786.604 | 3 | 262.201 | 161.914 | .000 |
Within Groups | 310.921 | 192 | 1.619 | |||
Total | 1097.526 | 195 | ||||
Topics and content | Between Groups | 1036.089 | 3 | 345.363 | 271.883 | .000 |
Within Groups | 243.890 | 192 | 1.270 | |||
Total | 1279.980 | 195 | ||||
Assessment tasks | Between Groups | 981.371 | 3 | 327.124 | 199.253 | .000 |
Within Groups | 315.216 | 192 | 1.642 | |||
Total | 1296.587 | 195 | ||||
Guidelines and criteria | Between Groups | 147.872 | 3 | 49.291 | 29.083 | .000 |
Within Groups | 325.408 | 192 | 1.695 | |||
Total | 473.281 | 195 | ||||
Requirement of overall assessment program | Between Groups | 3.201 | 3 | 1.067 | .846 | .470 |
Within Groups | 240.871 | 191 | 1.261 | |||
Total | 244.072 | 194 | ||||
Resources - help to learn | Between Groups | 2.361 | 3 | .787 | 1.001 | .394 |
Within Groups | 150.949 | 192 | .786 | |||
Total | 153.310 | 195 | ||||
Feedback from students used | Between Groups | 8.295 | 3 | 2.765 | 1.016 | .387 |
Within Groups | 522.455 | 192 | 2.721 | |||
Total | 530.750 | 195 | ||||
Overall importance of unit | Between Groups | 13.931 | 3 | 4.644 | 2.570 | .056 |
Within Groups | 346.942 | 192 | 1.807 | |||
Total | 360.872 | 195 | ||||
Teaching staff - understanding expectations | Between Groups | 34.988 | 3 | 11.663 | 5.581 | .001 |
Within Groups | 401.257 | 192 | 2.090 | |||
Total | 436.245 | 195 | ||||
Teaching staff - class atmosphere | Between Groups | 10.192 | 3 | 3.397 | 1.429 | .236 |
Within Groups | 456.477 | 192 | 2.377 | |||
Total | 466.668 | 195 | ||||
Teaching staff - friendly, enthusiastic, helpful | Between Groups | .136 | 3 | .045 | .075 | .973 |
Within Groups | 115.308 | 192 | .601 | |||
Total | 115.444 | 195 | ||||
Teaching staff - genuine interest | Between Groups | 1.469 | 3 | .490 | .420 | .739 |
Within Groups | 223.689 | 192 | 1.165 | |||
Total | 225.158 | 195 | ||||
Teaching staff - feedback | Between Groups | 3.220 | 3 | 1.073 | 1.404 | .243 |
Within Groups | 146.780 | 192 | .764 | |||
Total | 150.000 | 195 | ||||
Teaching staff - developing knowledge, understanding and skills | Between Groups | 3.532 | 3 | 1.177 | 1.056 | .369 |
Within Groups | 213.994 | 192 | 1.115 | |||
Total | 217.526 | 195 | ||||
Use of T&L resources and aids | Between Groups | 3.072 | 3 | 1.024 | 1.026 | .382 |
Within Groups | 191.622 | 192 | .998 | |||
Total | 194.694 | 195 | ||||
Use of student feedback to improve teaching | Between Groups | 3.430 | 3 | 1.143 | 1.116 | .344 |
Within Groups | 196.672 | 192 | 1.024 | |||
Total | 200.102 | 195 | ||||
Teaching, learning and assessment tasks used to help students learn | Between Groups | .524 | 3 | .175 | .183 | .908 |
Within Groups | 183.043 | 192 | .953 | |||
Total | 183.566 | 195 | ||||
The overall importance of teaching | Between Groups | 3.406 | 3 | 1.135 | 1.235 | .298 |
Within Groups | 176.446 | 192 | .919 | |||
Total | 179.852 | 195 | ||||
ANOVA is the statistical model used to analyze the difference between the group averages. In this regard, it can be stated that the different question s have been considered as samples. In this regard, it can be stated that there is a huge difference in the group. Here it has been evident that many of the samples have failed the five percent significance level test.
Correlations
|
Descriptive Statistics | |||
Mean | Std. Deviation | N | |
Unit materials - learning | 4.3112 | 2.50744 | 196 |
Unit materials - knowledge and skills | 4.2959 | 2.32802 | 196 |
Teaching methods - help to learn | 4.5867 | 2.37241 | 196 |
Topics and content | 5.0102 | 2.56203 | 196 |
Assessment tasks | 5.0459 | 2.57860 | 196 |
Guidelines and criteria | 6.1378 | 1.55791 | 196 |
The requirement of the overall assessment program | 5.8256 | 1.12165 | 195 |
Resources - help to learn | 6.0995 | .88668 | 196 |
Feedback from students used | 5.4643 | 1.64979 | 196 |
The overall importance of unit | 5.4745 | 1.36038 | 196 |
Teaching staff - understanding expectations | 5.7551 | 1.49571 | 196 |
Teaching staff - class atmosphere | 5.7704 | 1.54699 | 196 |
Teaching staff - friendly, enthusiastic, helpful | 6.3316 | .76943 | 196 |
Teaching staff - genuine interest | 5.9031 | 1.07455 | 196 |
Teaching staff - feedback | 6.2857 | .87706 | 196 |
Teaching staff - developing knowledge, understanding and skills | 6.0867 | 1.05618 | 196 |
Use of T&L resources and aids | 6.0816 | .99921 | 196 |
Use of student feedback to improve teaching | 5.8265 | 1.01300 | 196 |
Teaching, learning and assessment tasks used to help students learn | 5.7194 | .97024 | 196 |
The overall importance of teaching | 6.0765 | .96037 | 196 |
From here it can be concluded that there is a certain degree of positive correlation between the mean of all the samples. Otherwise, there has been great deviation among the variables. In this regard, it can be further stated that the different variable that we have worked with has different levels of dependencies and different levels of significance on one another.
References
Atieno, O.P., 2009. An analysis of the strengths and limitation of qualitative and quantitative research paradigms. Problems of Education in the 21st Century, 13(1), pp.13-38.
Campbell, D.T. and Stanley, J.C., 2015. Experimental and quasi-experimental designs for research. Ravenio Books.
Fusch, P.I. and Ness, L.R., 2015. Are we there yet? Data saturation in qualitative research. The Qualitative Report, 20(9), p.1408.
Geijzendorffer, I.R., Regan, E.C., Pereira, H.M., Brotons, L., Brummitt, N., Gavish, Y., Haase, P., Martin, C.S., Mihoub, J.B., Secades, C. and Schmeller, D.S., 2015. Bridging the gap between biodiversity data and policy reporting needs: An Essential Biodiversity Variables perspective. Journal of Applied Ecology.
Glesne, C. (2015). Becoming qualitative researchers: An introduction. Pearson.
Mackey, A. and Gass, S.M., 2015. Second language research: Methodology and design. Routledge.
Mackey, A., and Gass, S. M. (2015). Second language research: Methodology and design. Routledge.
Packard, J., 2008. I'm gonna show you what it's really like out here: The power and limitation of participatory visual methods. Visual studies, 23(1), pp.63-77.
Schobel, J., Schickler, M., Pryss, R., Maier, F. and Reichert, M., 2014. Towards process-driven mobile data collection applications: requirements, challenges, lessons learned.
Silverman, D. (Ed.). (2016). Qualitative research. Sage.
Taylor, S. J., Bogdan, R., and DeVault, M. (2015). Introduction to qualitative research methods: A guidebook and resource. John Wiley & Sons.
Sample Marketing Assignments
- Banking Industry
- British Airways
- Business Performance
- Business Plan
- Digital Marketing
- Global Market
- Heritage and cultural tourism management
- International Engineering
- Investment decision analysis
- Lean Manufacturing Process
- Woolworth company report
- Market Research Birdie Golfer
- VOLTAMP Company Oman
- Revenue Management
- Risk Management
- Scientific Management
- Stock Market Analysis of BSE
- Tourism Motivation
- Visual Merchandising
