Mathematical Graphing Calculator
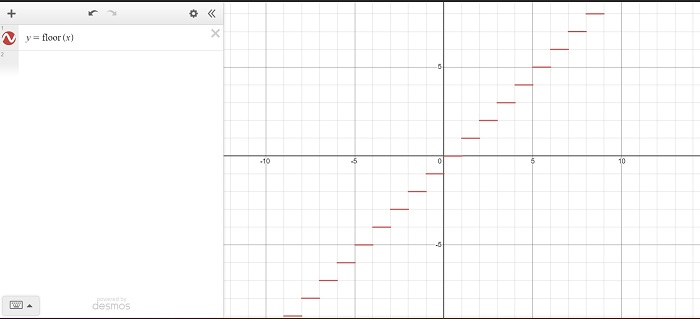
Graph of the Floor Function
(Greatest Integer Function)
X-Axis: Real numbers (x) Y-Axis: Greatest integer of x (⌊x⌋)
The graph of the floor function, also known as the greatest integer function, can be represented as a series of horizontal steps or "stairs."
- For any integer value of x, ⌊x⌋ equals x.
- As x moves from an integer to the next integer (e.g., from 2 to 3), ⌊x⌋ remains constant at the integer value (2).
- The graph "steps down" at each integer, creating a staircase-like pattern.
- The value of ⌊x⌋ is the largest integer less than or equal to x.
Here's a textual representation of the graph:

Source: Desmos Graph
In this graph, the steps represent the "floor" values of real numbers. For instance, ⌊2.8⌋ equals 2, and ⌊-1.5⌋ equals -2.
The greatest integer function can be defined mathematically as: ⌊x⌋ = the greatest integer less than or equal to x.
The floor function is commonly denoted as ⌊x⌋ or sometimes as "floor(x)." It's often used in various mathematical and computer science applications to round down real numbers to the nearest integer.
Let's take the number line and apply the floor function (greatest integer function) to some specific values:
Consider the floor function ⌊x⌋, which rounds down a given real number x to the nearest integer less than or equal to x.
Example: Let's calculate some values of ⌊x⌋ for different real numbers x:
- For x = 4.7 ⌊4.7⌋ = 4 Here, the largest integer less than or equal to 4.7 is 4.
- For x = -2.3 ⌊-2.3⌋ = -3 The largest integer less than or equal to -2.3 is -3.
- For x = 0.5 ⌊0.5⌋ = 0 The largest integer less than or equal to 0.5 is 0.
- For x = -1.8 ⌊-1.8⌋ = -2 The largest integer less than or equal to -1.8 is -2.
- For x = 3.0 ⌊3.0⌋ = 3 Since 3.0 is already an integer, ⌊3.0⌋ is 3.
In this illustration, the floor function rounds down each value of x to the nearest integer on the number line. The points where the vertical lines intersect the number line represent the values of ⌊x⌋ for the corresponding values of x. The function creates a "step" pattern as it moves from one integer to the next, forming a staircase-like shape.
Remember that the floor function always rounds down to the nearest integer or the same integer if x is already an integer.
In the graph of the floor function (greatest integer function), each line should start with a solid point and end with an open point, not the other way around. This is because the floor function rounds down to the nearest integer.
Let's clarify this with an example and an illustration:
Example: Let's consider the value of the floor function for x = 2.5. ⌊2.5⌋ = 2
In this graph, each line starts with a solid point and ends with an open point. The solid point represents the value of ⌊x⌋ where x is an integer. The open point signifies the value of ⌊x⌋ where x is just before the next integer.
The function value at x = 2.5 is 2, as shown by the solid point. The line then moves horizontally until it's just before x = 3, at which point it ends with an open point since ⌊2.5⌋ is 2.
The floor function, also known as the greatest integer function, is considered a "discontinuous step-like function" because its graph consists of distinct, separated steps. Each step corresponds to an interval of real numbers where the function remains constant. The term "discontinuous" refers to the fact that the graph has gaps or breaks between these steps.
This discontinuity arises because the floor function rounds down real numbers to the nearest integer. As you move from one integer to the next on the number line, the function abruptly "jumps" from one value to the next without passing through the values in between. This results in a series of horizontal lines, or "steps," in the graph.
For example, let's consider the interval between 2 and 3 on the number line:
- For all x such that 2 ≤ x < 3, the value of ⌊x⌋ is 2.
- However, as soon as x crosses the boundary and becomes 3, the value of ⌊x⌋ immediately changes to 3.
This instantaneous change from one constant value to another is what gives the graph its step-like appearance and makes it discontinuous. It's important to note that the floor function doesn't gradually transition through fractional values; instead, it maintains constant values over intervals defined by integers.
In mathematical terms, the discontinuity of the floor function can be formalized by saying that the function has "jump discontinuities" at every integer value.
The floor function is described as a "discontinuous step-like function" due to its graph's staircase pattern, where each step represents an interval of constant values separated by abrupt jumps at integer points.
Let's consider the graph of the floor function for both positive and negative numbers to illustrate its discontinuous step-like nature:
The function "jumps" from one integer to the next as you move across the number line. Each vertical line segment corresponds to a particular value of the floor function ⌊x⌋.
For example, let's consider the interval between -2 and -1:
- For all x such that -2 ≤ x < -1, the value of ⌊x⌋ is -2.
- As x crosses the boundary and becomes -1, the value of ⌊x⌋ immediately changes to -1.
This graph demonstrates that the floor function remains discontinuous for both positive and negative real numbers, with steps occurring at each integer point.

