
And the gfrp bars start carry the tensile load
JUSTINE JOHN
in fulfillment of the requirements of
This page intentionally left blank.
ii
Limitations of Use
The Council of the University of Southern Queensland, its Faculty of Health, Engineering and Science, and the staff of the University of Southern Queensland, do not accept any responsibility for the truth, accuracy or completeness of material contained within or associated with this dissertation.
I certify that the ideas, designs and experimental work, results, analyses and conclusions set out in this dissertation are entirely my own effort, except where otherwise indicated and acknowledged.
I further certify that the work is original and has not been previously submitted for assessment in any other course or institution, except where specifically stated.
v
ACKNOWLEDGEMENTS
Justine John
vi
3.3.3 Summary of theoretical analysis......................................................................... 74 3.4 Risk management plan .............................................................................................. 75 3.5 Materials .................................................................................................................... 76 3.5.1 GFRP Bars .......................................................................................................... 76 3.5.2 Concrete .............................................................................................................. 77 3.6 Specimen preparation ................................................................................................ 78 3.6.1 Reinforcement Mesh Fabrication ....................................................................... 79 3.6.2 Formwork preparation and installation of reinforcement mesh ......................... 80 3.6.3 Attachment of strain gauges ............................................................................... 82 3.6.4 Slab casting ......................................................................................................... 85 3.5 Transportation of the specimen ................................................................................. 87 3.6 Test set-up and instrumentation ................................................................................. 89 3.7 Summary .................................................................................................................... 90 CHAPTER 4: RESULTS AND OBSERVATIONS ........................................................... 91 4.1 Introduction ............................................................................................................... 91 4.2 Double Layer Slab with cutting (G250L2CB) .......................................................... 91 4.2.1. Crack pattern and Failure Mode ........................................................................ 91 4.2.2. Load v/s deflection behaviour ........................................................................... 96 4.2.3. Moment v/s deflection behaviour ...................................................................... 97 4.2.4. Strain behaviour ................................................................................................. 98 4.3 Single Layer Slab with cutting (G150L1cB) ........................................................... 103 ix
4.3.1. Crack pattern and Failure Mode ...................................................................... 103 4.3.2. Load v/s deflection behaviour ......................................................................... 107 4.3.3. Moment v/s deflection behaviour .................................................................... 108 4.3.4. Strain behaviour ............................................................................................... 109 4.4 Single Layer Slab without cutting (G150L1SB) ..................................................... 111 4.4.1. Crack pattern and Failure Mode ...................................................................... 111 4.4.2. Load v/s deflection behaviour ......................................................................... 115 4.4.3. Moment v/s deflection behaviour .................................................................... 116 4.4.4. Strain behaviour ............................................................................................... 117 4.5 double Layer Slab without cutting (G250L2sB) ..................................................... 120 4.5.1. Crack pattern and Failure Mode ...................................................................... 120 4.5.2. Load v/s deflection behaviour ......................................................................... 124 4.5.3. Moment v/s deflection behaviour .................................................................... 125 4.5.4. Strain behaviour ............................................................................................... 126 4.6 Summary .................................................................................................................. 130 4.6.1 Stiffness behaviour of slabs .............................................................................. 131 4.6.2 Failure behaviour of slabs................................................................................. 132 4.6.3 Stiffness behaviour of slabs. ............................................................................. 133 4.6.3 Surface concrete strain behaviour..................................................................... 135 4.6.3 Bottom GFRP strain behaviour. ....................................................................... 137 CHAPTER 5: DISCUSSION AND VALIDATION ......................................................... 139 x
Table 3. 1 Reinforcement details of G250L2CB ................................................................. 36 Table 3. 2 Reinforcement details of G150L1CB ................................................................. 37 Table 3. 3 Reinforcement details of G150L1SB ................................................................. 38 Table 3. 4 Reinforcement details of G250L2SB ................................................................. 39 Table 3. 5 Rupture capacity of slabs.................................................................................... 74 Table 3. 6 Flexural and shear capacities of slabs ................................................................ 75 Table 3. 7 Mechanical properties of GFRP bars (Al-Rubaye et al, 2018) .......................... 77
Table 4. 1 Stiffness behaviour of slabs .............................................................................. 131 Table 4. 2 Failure behaviour of slabs ................................................................................ 132
eddyhrbs,2014, Builders engineers) ............................................................................... 15
Figure 2. 9 Stress and strain variation of reinforced concrete before rupture (Darwin D, Dolan W.C & Nilson A.H, 2016, P.81) ............................................................................... 16 Figure 2. 10 (a) Failure governed by FRP rupture (Standard, 2011b)`............................ 18 Figure 2. 11 FRP Rupture failure (Chang and Seo, 2012) .................................................. 19 Figure 2. 12 Concrete crushing failure (Chang and Seo, 2012) .......................................... 20 Figure 2. 13 Shear compressive failure (Chang and Seo, 2012) ......................................... 20 Figure 2. 14 Shear compressive failure (O. Alajarmeh and A.C.Manalo, 2020) ................ 21 Figure 2. 15 Shear Tension failure (O. Alajarmeh and A.C.Manalo, 2020) ....................... 21 Figure 2. 16 Load -Deflection behaviour ( Chang and Seo, 2012) ..................................... 22 Figure 2. 17 Moment – Midspan deflection (O. Alajarmeh and A.C.Manalo, 2020) ......... 23 Figure 2. 18 Load -strain behaviour ( Chang and Seo, 2012) ............................................. 25 Figure 2. 19 Aggregate interlock mechanism (Ulaga. T and Vogel T, 2003) ..................... 27 Figure 2. 20 Dowel action of longitudinal reinforcements (Naaman A.E, 2003) ............... 27
xiv
Figure 4. 6 Load – Top GFRP strain ................................................................................. 100 Figure 4. 7 Moment – top GFRP strain ............................................................................. 101 Figure 4. 8 Load – strain behavior of bottom GFRP bar ................................................... 102 Figure 4. 9 Moment – strain behavior of bottom GFRP bar. ............................................ 102 Figure 4. 10 (a) Initial cracking ......................................................................................... 104 Figure 4. 11 Load – Deflection Behaviour (G150L1CB) .................................................. 107 Figure 4. 12 Moment-Deflection Behaviour (G150L1CB) ............................................... 108 Figure 4. 13 Load v/s concrete surface strain .................................................................... 110 Figure 4. 14 Moment v/s concrete surface strain .............................................................. 110 Figure 4. 15 (a) Initial cracking under loading point ......................................................... 112 Figure 4. 16 Load – Deflection Behaviour (G150L1SB) .................................................. 115 Figure 4. 17 Moment-Deflection Behaviour (G150L1SB) ............................................... 116 Figure 4. 18 Load – strain behavior for top concrete ........................................................ 118 Figure 4. 19 Moment – strain behavior for top concrete ................................................... 118 Figure 4. 20 Load – strain behavior of GFRP bar ............................................................. 119 Figure 4. 21 Moment – strain behavior of GFRP bar. ....................................................... 120 Figure 4. 22(a): Initial Cracking ........................................................................................ 121 Figure 4. 23 Load – Deflection Behaviour (G250L2SB) .................................................. 124 Figure 4. 24 Moment-Deflection Behaviour (G250L2SB) ............................................... 125 Figure 4. 25 Load – strain behavior for top concrete ........................................................ 127 Figure 4. 26 Load – strain behavior for top concrete ........................................................ 127 Figure 4. 27 Load – Top GFRP strain ............................................................................... 128 Figure 4. 28 Moment – top GFRP strain ........................................................................... 129 Figure 4. 29 Load – strain behavior of bottom GFRP bar ................................................. 130 Figure 4. 30 Moment – strain behavior of bottom GFRP bar. .......................................... 130 xv
fc: concrete compressive strength.
Ɛco: concrete strain which equals 0.003.
b = breadth of the slab
km = Factor to calculate shear strength
h = Total height of section
Kr = Factor to calculate shear strength
Ef = Modulus of elasticity of GFRP bars
ρf = Reinforcement ration
nf = Modular ratio
xviii
1.1 Background
Precast concrete slabs are widely used as an integral part of reinforced concrete marine infrastructures in the extreme marine environment. In conventional design, these slabs are reinforcing with steel reinforcement for their required serviceability and safety criteria. Corrosion of steel reinforcement of these structures located in the extreme marine environment is a significant issue that affects the durability of these reinforced concrete structures globally. Various methods like installing cathodic protection, increasing the cover, using high-performance concrete mixes, and corrosion-resistant materials such as galvanized, epoxy-coated, or stainless-steel reinforcement are using to overcome the problem of corrosion. However, these can only be temporary solution or expensive to implement and operate. (Manalo A.C et al. 2020). The design life of any marine structure is getting reduced to 20 to 30 years due to the corrosion of steel bars from the standard expectation of 50 years (Mehta et al.1997). As per the current Australian standards, the marine structures made of reinforced concrete must satisfy the durability criteria C (MRTS70). Apart from that, corrosion causes huge maintenance costs for all these structures. In Queensland itself, the corrosion imparts a substantial economic loss of around AUD 10 million annually related to repairing and rehabilitating corrosion-damaged structures. (Queensland, M.S, Waterways). The necessity of finding an alternative corrosion-resistant reinforcing material is gaining the attention of researchers all around the world.
Replacing steel reinforcements with GFRP bars can be benefitted from reducing the cover depth and increasing the section capacity. At the same time, the effect of cutting on crack propagation still needs to be investigated. This paper evaluates the flexural performance of pontoon slabs reinforced with GFRP bars under different reinforcement layout and the effect of cutting. Four concrete slabs (a single layer GFRP reinforcement slab with cutting, a single layer GFRP reinforcement slab without cutting, a double layer GFRP reinforcement slab with cutting, a double layer GFRP reinforcement slab without cutting) were cast and tested under four-point loads to evaluate the effect of cutting and reinforcement layout. The capacity of slabs was predicted by theoretical analysis and then compared to the experiment results. The possible outcomes from this study can enhance our understanding of the behaviour of GFRP reinforced pontoon slabs with the difference in GFRP reinforcement layout under the effect of cutting.
1.2 Research objectives
This research provides significant opportunity to develop an understanding of the performance of GFRP reinforced pontoon slabs. It aims to evaluate the performance of 3
GFRP reinforced pontoon slab by providing solutions for various issues faced by conventional steel reinforced pontoon slabs. The new findings in this research project are summarized as follows:
Chapter 1: First chapter is an introduction and states aim of the study.
Chapter 2: This chapter is a detailed review of reinforced Pontoon slab and associated problems in extreme marine condition such as corrosion and crack propagation at corners of the cuttings. It reviews other research done in the field of GFRP reinforced slabs and slabs with cutting. This provides sufficient background to understand the current project gap in this area.
Chapter 6: This chapter provides the conclusion from the critical evaluation of the experimental investigation.
1.5 Summary
This chapter is a detailed discussion on the current performance of Pontoon slabs and various problems such as corrosion of steel bars and excessive cracking associated with them. It introduces the usage of new reinforcing material such as glass fiber reinforced polymer bar to overcome these issues with the help of enough background.
2.2 PONTOON SLABS
Figure 2. 2 Plan and sectional view of Pontoon slab and Pile locations(source: Jetty specialist)
2.2.1 General Specification
2.2.2 Serious durability problems affecting pontoon slabs.
Since Pontoon slabs are an integral part of boating and marine infrastructure facilities located in the extreme marine environment, the steel reinforcements of these structures are vulnerable to corrosion. A study on the effect of corrosion of steel reinforcements is below.
8
The most common environmental factors that affect the durability of reinforced concrete is de-icing and seawater. The chances of steel corrosion increase when the concrete carbonated or alkalinity due to chloride happens (Domone and Illston, 2010). Corrosion can lead to the loss of the original shapes of steel reinforcement, and the rust can increase the volume of reinforcement in reinforced concrete (Du et al., 2005). It can lead to splitting stresses in the concrete across the reinforcement and lead to cracking. The rust formation which causes the reduction in the cross-section area can reduce the mechanical properties of the bars. Various properties such as ductility, stiffness, strength and anchorage capacity is affected by corrosion as shown in figure 2.5 (Cairns and Millard, 1999).
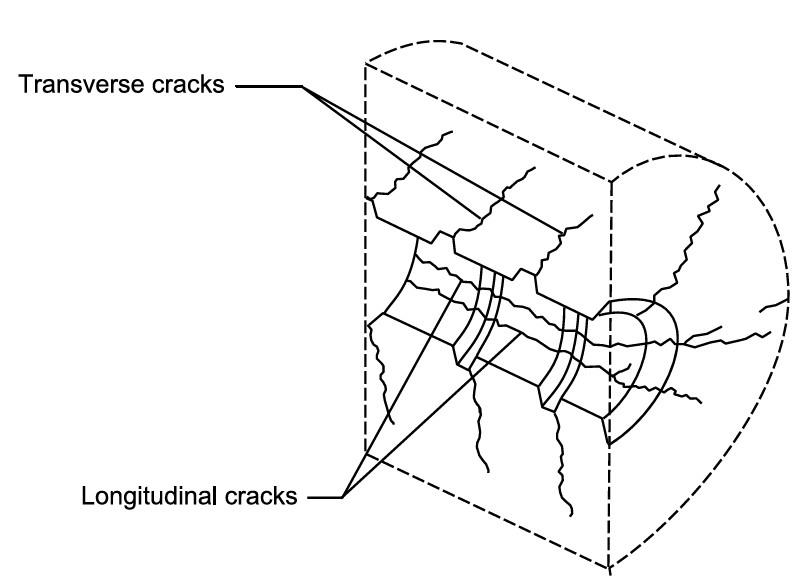
Figure 2. 6Longitudinal and transverse cracks due bond stress (Magnusson, 2000)
•All reinforcement to be hot-dipped galvanised.
•The deck shall ideally have 65 mm minimum cover to the exposed surface. •Minimum service life – 50 years.
11
superior properties such as lightweight, corrosion resistance, high tensile strength, non-conductivity etc., attracted researchers to demonstrate its use in the construction industry. Recent developments in the manufacturing qualities of GFRP in alkali resistance, improved the fibre/matrix interphase, which significantly enhanced the bar's resistance to a harsh environment. (Maranan, 2016, Manalo et al., 2014). The figure 2.7 shows the cross-sectional view of GFRP bars. The various mechanical properties of GFRP bars are shown in table 2.1.
|
|
Standard Deviation | |
|---|---|---|---|
|
|||
|
|
||
|
|
Table 2. 2 Advantages and Disadvantages of GFRP Bars (Goldston, 2016)
| Advantages | Disadvantages |
|---|---|
|
|
|
|
|
|
|
2.7 MEMBERS UNDER PURE BENDING.
Figure 2. 8 Internal Fleesses in Members under pure bending (Source: 2014, Builders engineers)
15
16
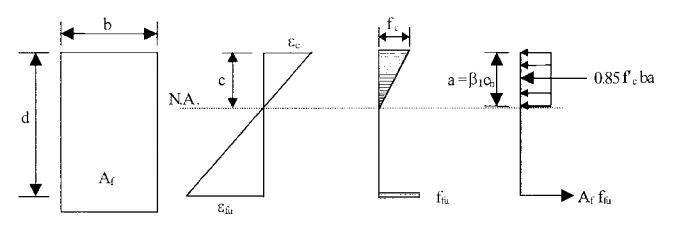
concrete. Therefore, reinforcements are provided in the concrete's tensile region to improve the tension capacity.
•The strain in the FRP reinforcement and concrete is linear with the distance from the neutral axis.
•The FRP reinforcement has a linear stress-strain behavior up to failure.
V.S et al., 2006,) The stress strain various of section under such failure is shown in Figure 2.10.(a)
`
18
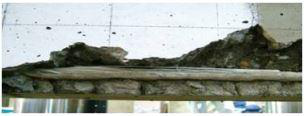
Figure 2. 11 FRP Rupture failure (Chang and Seo, 2012) 19
(Chang and Seo, 2012) investigated the performance of a one-way slab under four-point loading with an a/d ratio ranging from 5.8 to 8.0. This study clarifies that the failure mode of a GFRP over-reinforced slabs depends on the reinforcement ratio and a/d ratio. They achieved the difference in shear span to effective depth ratio (a/d) by increasing the overall depth of the section. They have found that slabs having a depth of 200mm lead to an a/d ratio of 5.8 failed in flexural shear because of concrete failure, as shown in figure 2.13. The final failure of the slab was due to the combination of crushing as well as diagonal shear.
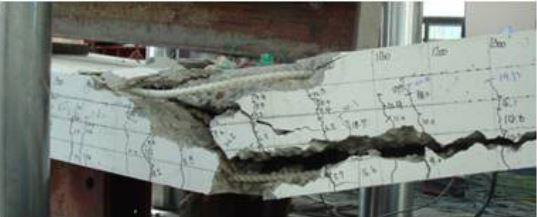
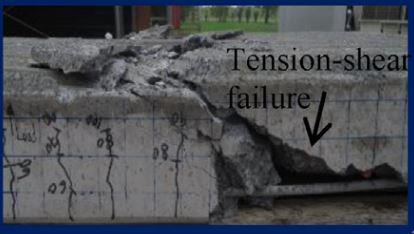
Figure 2. 15 Shear Tension failure (O. Alajarmeh and A.C.Manalo, 2020)
Figure 2.16 (a) Figure 2.16 (b)
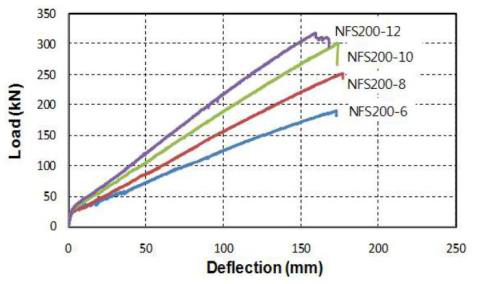
cracking stiffness of the slabs depends on the slabs' modulus of elasticity. Slabs reinforced with a high modulus of elasticity bars (NFS) exhibited higher stiffness in the post cracking phase than slabs reinforced with FS bars.
(O. Alajarmeh and A.C.Manalo, 2020) carried out the studies on the moment – deflection behavior of the GFRP reinforced section with single layer as well as with double layer. The figure 2.17 shows the moment – deflection behavior of the slabs.
2.8.2.4 Load-strain behaviour of GFRP reinforced slabs
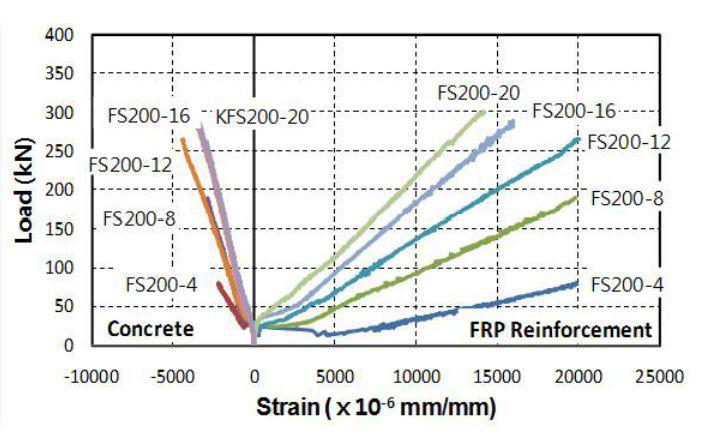
Figure 2.18 (c) NFS200 Concrete surface and FRP reinforcement strain
The primary failure modes in the GFRP section are Tension failure manifested by FRP rupture and Compression failure manifested by concrete crushing. Apart from that, GFRP reinforced members exhibit secondary failure mode such as shear failure, concrete cover failure, debonding, creep-rupture and fatigue of FRP bars (Gangarao V.S et al., 2006). This section was discussing various mechanism that affects the shear capacity of a cracked concrete section. According to ASCE-ACI committee 445, the five mechanisms that affect the shear capacity (El. Sayed A et al., 2005) of a cracked reinforced section are as follows:
•Shear stresses in uncracked concrete
•Aggregate interlock
•Dowel action of the longitudinal reinforcing bars.
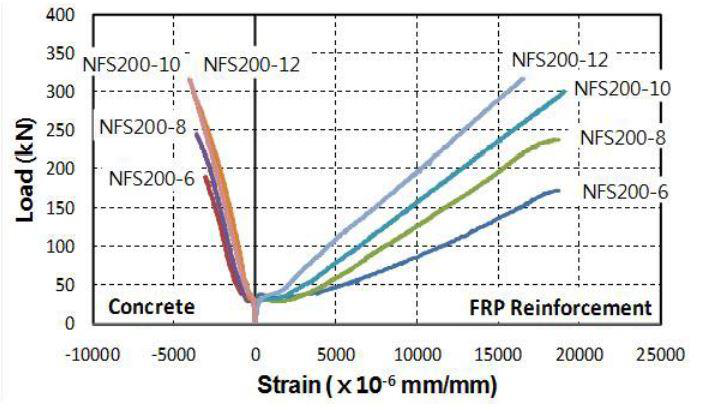
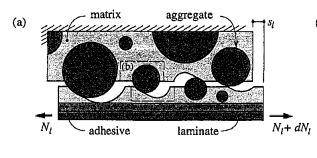
Figure 2. 19 Aggregate interlock mechanism (Ulaga. T and Vogel T, 2003)
27
that an increase in the section's concrete compressive strength and effective depth can result in an arch effect. (El-sayed et al., 2005).
Slabs are flexural members designed to develop a couple in its cross-section against the applied moment. For developing a couple, members designed for bending are designed by equating the tensile and compressive force above and below the neutral axis. (Compression = Tension). If tensile reinforcement is not sufficient to balance this condition or when there is a large difference between the capacity of the section to generate these forces, the section behaves under a uni-axial stress condition and elongate in plain. This is not recommended in slabs that are designed as flexural members. Such failure can occur in slabs when flexural reinforcement is too low than required or when the concrete compressive strength becomes higher than predicted.
28
Table 2. 3 Slab details (Sarma K P and Prakash S, 2015)
| HCS-150-7.50-FO | 7.50 |
|---|
Figure 2. 22 Layout of the tested slab (Sarma K P and Prakash S, 2015)
The experimental investigation involved a four-point bending and the following results were observed.
2.9.1.2Effect of cutting on the Failure mode.
In slab having an (a/d) ratio of 3.5 the presence of opening changed the failure mode from shear failure to flexural failure. Apart from that the presence of opening initiated the cracking at the corners of these openings. Slabs having an (a/d) ratio of 7.5 failed in flexural failure. Figure 2.23 shows the failure and crack propagation.
2.10 SUMMARY
From the above extensive literature review, it is clear that GFRP bars are highly recommended in structures exposed to extreme corrosive environmental conditions. Due to the low modulus of elasticity of GFRP bars, members reinforced with GFRP bars can form wider cracks. Previous studies have proved that aligning the reinforcement layout into multiple layers instead of a single layer can change the shear span to an effective depth ratio (a/d), which can change the performance of these slabs. Apart from that, the (a/d) ratio can change the failure modes of the sections.
32
circumstances I remain faithful and thankful to my university by keeping the ethics. Various steps taken to achieve the objective are mentioned in the coming chapter.
•Preparation of Slab details
•Theoretical analysis
•Risk management plan.•Specimen preparation
•Test Set Up and Instrumentation
•Summary
Table 3. 1 Reinforcement details of G250L2CB
|
|||||||||
v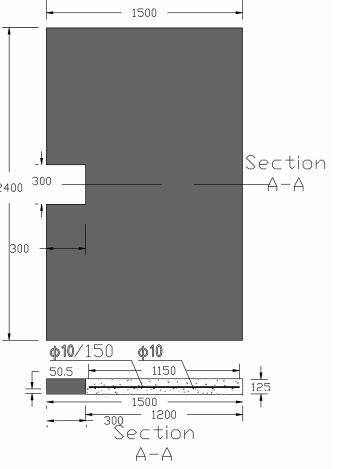 |
|||||||||
| Area (mm2) |
Qty (No) |
|
(ρf/ ρbf) | ||||||
|
|
1.33 | |||||||
|
|
||||||||
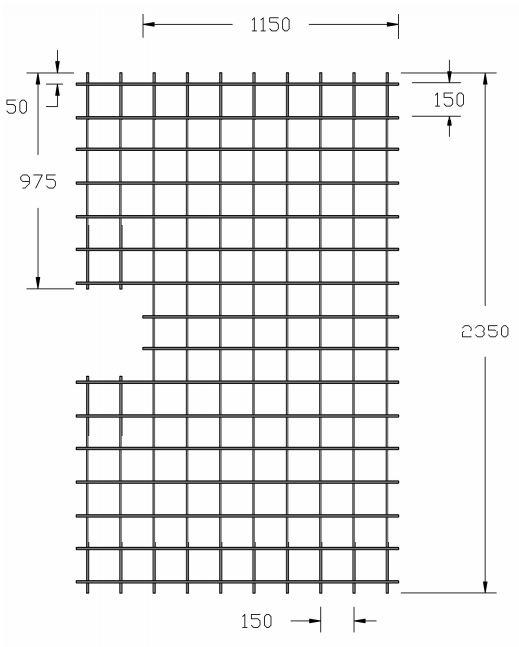
Table 3. 3 Reinforcement details of G150L1SB
|
|
||||||||
v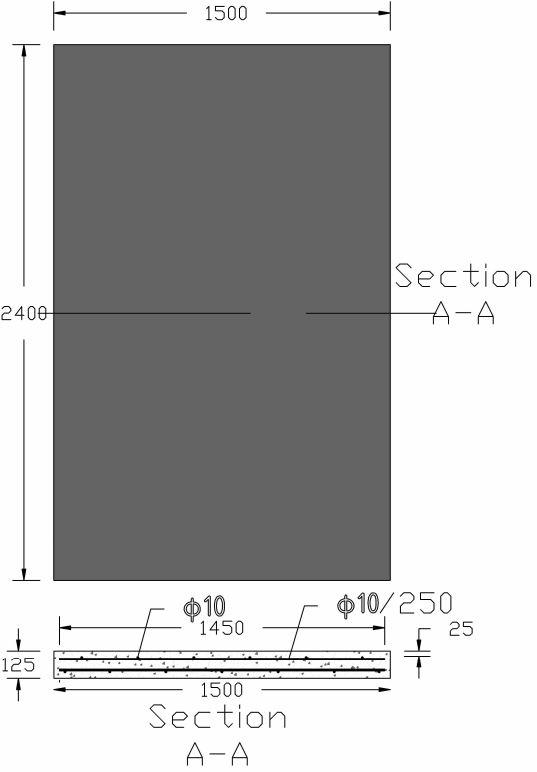 |
|||||||||
| Area (mm2) |
Qty (No) |
|
|
(ρf/ ρbf) | |||||
|
|
0.933 |
|
||||||
|
|||||||||
39
3.3 THEORETICAL ANALYSIS
40
Reinforcement ratio
•Number of longitudinal reinforcements = 5
•Breadth of the cross section (b) = 1200mm
42
= 0.295%
Balanced Reinforcement ration
| 𝑓𝑐′ | 𝐸𝑓(0.0035) | |
|---|---|---|
| bf𝛼1β1 | 𝑓𝑓𝑢 | 𝐸𝑓(0.0035)+𝑓𝑓𝑢 |
| •𝛼1 = 0.85 − 0.0015𝑓𝑐′ ≥ 0.67 |
= 0.97 − (0.0025 ∗ 50)
= 0.845
| =𝛼1 | 𝑓𝑐′ |
|
||
|---|---|---|---|---|
| 𝛼11 | 𝑓𝑓𝑢 |
|
62.5∗103∗(0.0035) | |
| = 0.775 ∗ 0.845 ∗ | 50 | |||
| 1315.3∗ | 62.5∗103∗(0.0035)+1315.3 | |||
Cracking Moment Mcr (G250L2CB)
•Breadth of the section (b) =1200 mm
•Height of the section (h) =125 mm
•Moment of Inertia for the gross area (Ig) =bh3/12
= 0.6 * √50
= 4.2426
•Modulus of rupture (fr2) = 0.4 * √𝑓𝑐′
= 0.4 * √50
FLEXURAL STRENGTH OF SLAB G250L2CB (ACI 440 METHOD)
•Effective depth (d) = 100mm
= 0.85 – 0.05
6.9
•Ultimate concrete compression strain(εcu)= 0.003 • Area of GFRP = 354mm2
•Breadth of slab (b)= 1200mm
•Reinforcement ratio (ρf)= = 0.00295•Stress at GFRP bars (ff)
| = 0.00295 ∗ 1272.4 ∗ [1 − 0.59 ∗ |
|
•Material reduction factor α1 = 0.85
•width of section b = 1200 mm
| −1 ± √12− 4( | 𝛼1𝑓𝑐β1𝑏 | )(−𝑑) | |||||
|---|---|---|---|---|---|---|---|
| 0.003 Ast 𝐸𝑓 | |||||||
| 2( | 𝛼1𝑓𝑐β1𝑏 | ) | |||||
| 0.003 Ast 𝐸𝑓 | |||||||
| −1 ± √12− 4(0.85 ∗ 50 ∗ 0.68768 ∗ 1200 | )(−100) | ||||||
|
|
||||||
= 1272.388N/mm2
47
= 43.053 kNm
= 0.042
•Cracked transformed section neutral axis depth (C) = kd
| 𝑉𝑢𝑐 = 2 |
|
|---|---|
| = |
|
= 14.255 kN
= 6.691
•Фc = 0.7
•Breadth of the slab (b) = 1200mm
49
Reinforcement ratio
•Number of longitudinal reinforcements = 8
•Diameter of reinforcement = 10mm
•Nominal diameter = 9.5mm
• Nominal cross-sectional area of one bar = 70.8mm2 •Area of GFRP bars( 𝐴𝐺𝐹𝑅𝑃) = 70.8 * 8 = 566.4mm2•Breadth of the cross section (b) = 1200mm
•Depth of the cross section (h) = 125mm
•Effective depth of cross section (d) = 74.5mm
Balanced Reinforcement ratio
= 0.845
•Ultimate tensile strength of FRP reinforcement (𝑓𝑓𝑢) = 1315.3N/mm2•Characteristic compressive strength of concrete (𝑓𝑐′) = 50 𝑀𝑃𝑎
= 3.549*10^-3
= 0.354%
51•(ρf/ ρbf) = 0.00633/0.00354
= 1.788• Cracking moment Mcr1= (fr * Ig)/ yt
= (4.2426 * 195.312*106)/62.5
= 13.25 kNm
• Cracking moment Mcr2= (fr2 * Ig)/ yt
= (2.8284*195.312*106)/62.5
6.9 (50−27.6) |
|---|
53
∗ 0.003)
= 33.24kNm
0.00633∗841.3
] ∗ 1200 ∗ 74.52
(50−27.6)
= 0.85 – 0.05
6.9
| •width of section b = 1200 mm |
|---|
•Depth of compression concrete layer
•Stress at GFRP bars
𝑓𝐺𝐹𝑅𝑃 = 𝛼1𝑓𝑐β1dn𝑏 Ast
55
|
|---|
•𝑘 = √2𝜌𝑓𝑛𝑓 − (𝜌𝑓𝑛𝑓)2− 𝜌𝑓𝑛𝑓
= √2 ∗ 0.00633 ∗ 0.3125 − (0.00633 ∗ 0.3125)2− 0.00633 ∗ 0.3125
56
•Ultimate shear capacity of concrete (Vuc)
|
|---|
•Factor to calculate shear strength (km) = 1
•λ= 1
•Total height of section (h) = 125mm
•Modulus of elasticity of GFRP bars (Ef) = 62.5 GPa
•Reinforcement ration (ρf)= = 0.00633
•Factor to calculate shear strength 𝑘𝑟 = 1 + (𝐸𝑓𝜌𝑓)1/3
•Factor to calculate shear strength 𝑘𝑟 = 1 + (62.5 ∗ 1000 ∗ 0.00633)1/3
𝑉𝑢𝑐 = 0.05 ∗ 1 ∗ 1 ∗ 8.3411 ∗ 0.7 ∗ 50
1
3 ∗ 1200 ∗ 90 = 116.155kN
| 𝑓𝑐′ | 𝐸𝑓(0.0035) | |
|---|---|---|
| bf𝛼1β1 | 𝑓𝑓𝑢 | 𝐸𝑓(0.0035)+𝑓𝑓𝑢 |
| •𝛼1 = 0.85 − 0.0015𝑓𝑐′ ≥ 0.67 |
= 0.85 − (0.0015 ∗ 50)
= 0.775
•Characteristic compressive strength of concrete (𝑓𝑐′) = 50 𝑀𝑃𝑎
•Modulus of elasticity of GFRP bars (𝐸𝑓) = 62.5 𝐺𝑃𝑎
| • | |||||
|---|---|---|---|---|---|
| = 𝛼1β1 | 𝑓𝑐′ | ||||
| 𝑓𝑓𝑢 | 62.5∗103∗(0.0035) | ||||
| = 0.775 ∗ 0.845 ∗ | 50 | ||||
| 1315.3∗ | 62.5∗103∗(0.0035)+1315.3 | ||||
= 0.354%
59
= 0.6 * √50
= 4.2426• Cracking moment Mcr1= (fr * Ig)/ yt
= 2.8284
• Cracking moment Mcr2= (fr2 * Ig)/ yt
•Stress at GFRP bars (ff)
61
|
|
|||
= 0.00633 ∗ 841.3 ∗ [1 − 0.59 ∗
= 41.55kNm
•Reduction factor for the compression stress block β1 = 0.85 – 0.05 (𝑓𝑐′−27.6) 6.9
(50−27.6)
= 0.85 – 0.05
6.9
𝑓𝐺𝐹𝑅𝑃 = 0.85 ∗ 50 ∗ 0.68768 ∗ 13.5818 ∗ 1500 708
= 840.9896N/mm2
|
|---|
= 41.578 kNm
= √2 ∗ 0.00633 ∗ 0.3125 − (0.00633 ∗ 0.3125)2− 0.00633 ∗ 0.3125
= 0.0608
64
| = |
|
|---|
•Factor to calculate shear strength (km) = 1
•λ= 1
•Total height of section (h) = 125mm
•Modulus of elasticity of GFRP bars (Ef) = 62.5 GPa
•Reinforcement ration (ρf)= = 0.00633
•Factor to calculate shear strength 𝑘𝑟 = 1 + (𝐸𝑓𝜌𝑓)1/3
•Factor to calculate shear strength 𝑘𝑟 = 1 + (62.5 ∗ 1000 ∗ 0.00633)1/3
= 8.3411
•Ultimate shear capacity of concrete (𝑉𝑢𝑐) = 0.05𝜆𝑘𝑚Ф𝑐𝑘𝑟(𝑓𝑐′)1/3𝑏𝑑𝑣
𝑉𝑢𝑐 = 0.05 ∗ 1 ∗ 1 ∗ 8.3411 ∗ 0.7 ∗ 50
|
|
|---|
•𝛼1 = 0.85 − 0.0015𝑓𝑐′ ≥ 0.67
66
•Ultimate tensile strength of FRP reinforcement (𝑓𝑓𝑢) = 1315.3N/mm2
•Characteristic compressive strength of concrete (𝑓𝑐′) = 50 𝑀𝑃𝑎
| • | |||||
|---|---|---|---|---|---|
| =𝛼1β1 | 𝑓𝑐′ | ||||
| 𝑓𝑓𝑢 | 𝐸𝑓(0.0035)+𝑓𝑓𝑢 | 62.5∗103∗(0.0035) | |||
| = 0.775 ∗ 0.845 ∗ | 50 | ||||
| 1315.3∗ | 62.5∗103∗(0.0035)+1315.3 | ||||
= 0.354%
•(ρf/ ρbf) % = 0.0033/0.00354
= (1500 * 1253)/12
=244.14*106 mm4
• Cracking moment Mcr1= (fr * Ig)/ yt
= (4.2426 * 244.14*106)/62.5
• Cracking moment Mcr2= (fr2 * Ig)/ yt
68
|
|
|||
|---|---|---|---|---|
∗ 0.003)
69= 1.1982 GPa
0.0033∗1198.2
] ∗ 1500 ∗ 100250
= 0.68768
•Material reduction factor α1 = 0.85
•width of section b = 1500 mm
•Modulus of elasticity of GFRP bars Ef = 62.5 GPa
| −1 ± √12− 4( 0.85 ∗ 50 ∗ 0.68768 ∗ 1500 | )(−100) | ||
|---|---|---|---|
|
|
||
𝑓𝐺𝐹𝑅𝑃 = 0.85 ∗ 50 ∗ 0.68768 ∗ 13.537 ∗ 1500 495.6
= 1197.45N/mm2
= 56.583 kNm
71
•Concrete compressive strength (fc’) = 50Mpa
•Breadth of the section (b) = 1500mm
•Effective depth of the section (d) = 100mm
•Modular ratio nf = Ef/200000 = 62500/200000 = 0.3125
= 0.04437 * 100
= 4.437
| 𝑉𝑢𝑐 = 2 |
|
|---|---|
| = | |
SHEAR CAPACITY OF SLAB G250L2SB (CSA-S806-12 METHOD)
•Diameter of bar = 10mm
•Number of bars = 7
•Effective depth d = 100mm
where 0.9 d = 0.9 * 100 = 90
0.72h = 0.72* 125 = 90
3.3.3.1 Rupture Capacity of slabs
Table 3. 5 Rupture capacity of slabs
|
|
ρ𝑓/ ρbf |
|
|||||
|---|---|---|---|---|---|---|---|---|
|
0.295 |
|
|
|||||
|
0.633 |
|
||||||
|
|
0.633 | 16.572 | |||||
|
|
|
16.572 |
|
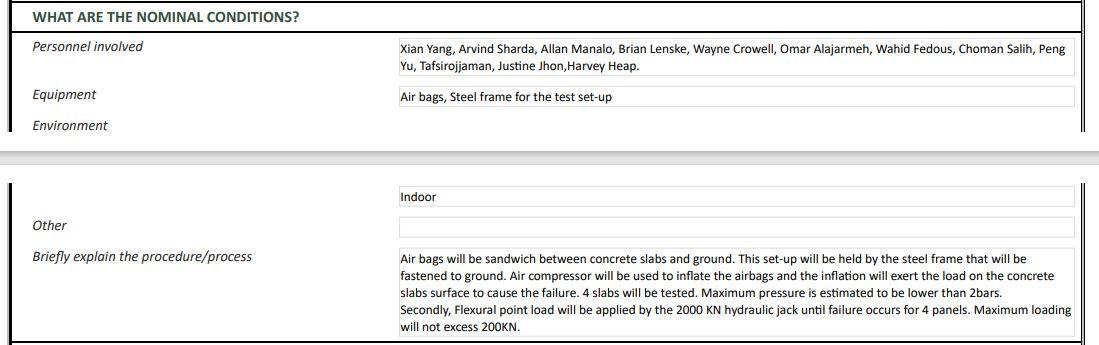
3.4 RISK MANAGEMENT PLAN
The properties of various materials used in manufacturing the slabs and the instrumentations used are as follows.
3.5.1 GFRP Bars
Table 3. 7 Mechanical properties of GFRP bars (Al-Rubaye et al, 2018)
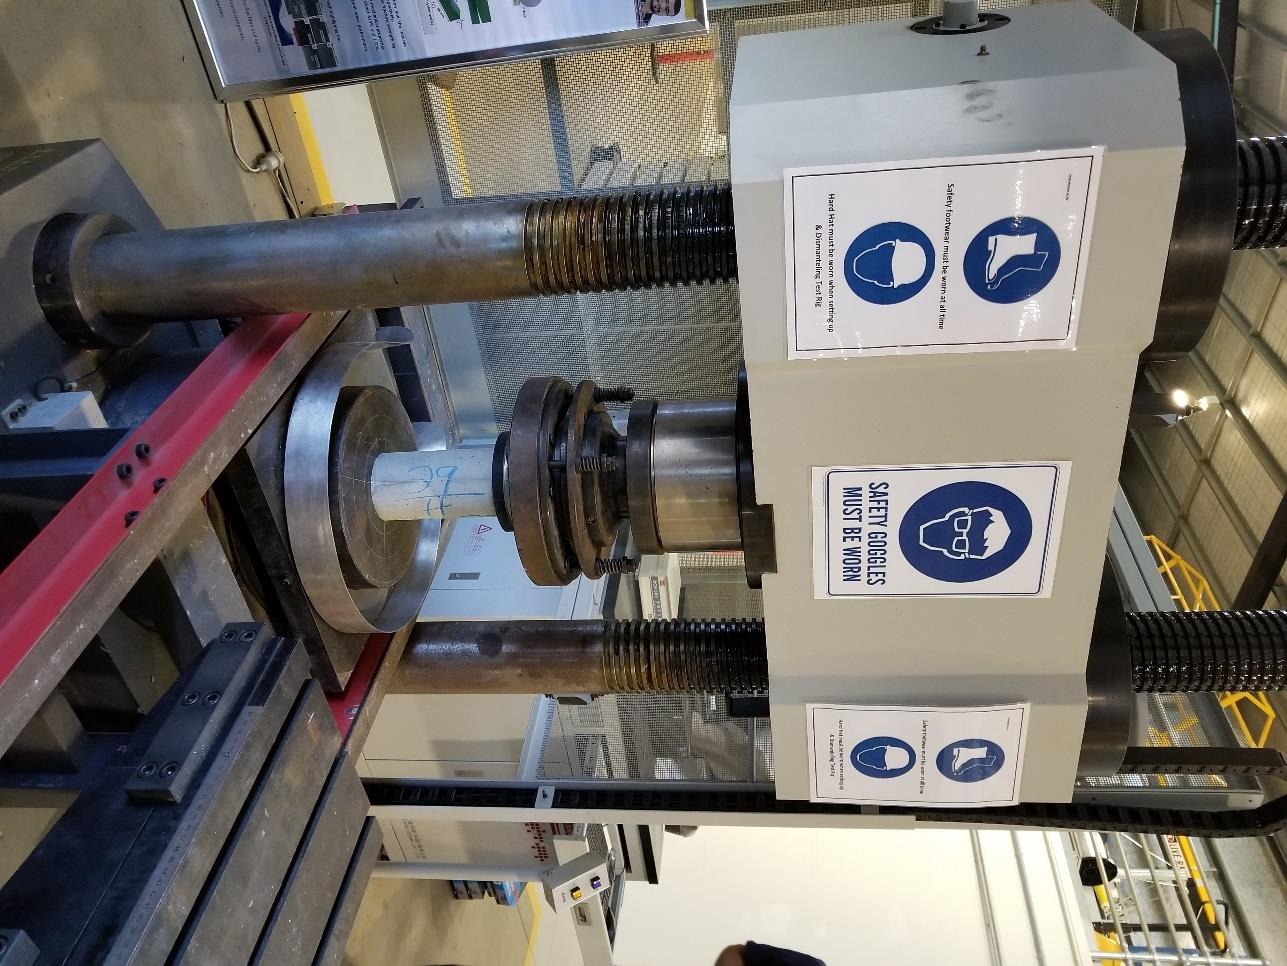
Figure 3. 2 Concrete compression test.
3.6.1 Reinforcement Mesh Fabrication
All the GFRP reinforcement bars were 10mm in diameter. The reinforcement layout in the Single-layer reinforced slab without cutting (GL1SB) consist of ten numbers of longitudinal reinforcement having a length of 2350mm while the 16 numbers of transverse reinforcement having a length of 1450mm. In a single-layer reinforced slab with a cutting (GL1CB), the number of longitudinal reinforcements having a length of 2350mm is eight, and transverse reinforcement 1450mm in length is 14. Additional GFRP bars with different dimensions reinforce the slab at cutting longitudinally with four 975mm long bars and transversely with two 1150mm long bars. In the case of double-layer, GFRP reinforced slab without cutting (GL2SB), thirteen numbers of longitudinal reinforcement having 2350mm long, and ten numbers of transverse reinforcement having a length of 1450mm used. For a double layer slab with a cutting (GL2CB), eight and two numbers of 1450mm and 1150mm in length transverse reinforcement used, while six and ten numbers of 975mm and 2350mm in length longitudinal reinforcement used. The bars were appropriately cut with the help of a cutting machine and procured for the cage formation. All the bars were tied with the help of zip plastic wire as shown in Figure 3.3 for cage fabrication according to the reinforcing layout required.
Formwork made of black plywood of 20 mm thick screwed together in the dimensions of the slab. Additional blocks installed at the location of cutting in the required measurements cast the slabs with cutting, as shown in figure 3.4. The reinforcement cage, which was fabricated, moved to the formwork manually with the help of two people. As shown in figure 3.5, concrete spacers of required sizes ensured used at the sides and end to ensure enough cover and spacing between the GFRP layers. Additional bolts provided to lift the slabs properly at suitable locations.
80
3.6.3 Attachment of strain gauges
During plank manufacturing, uniaxial electronic resistance strain gauges were attached at the critical locations on the internal reinforcement to measure the elongation of reinforcement and identification of the failure of slabs. Strain gauges at the edges of the GFRP bars are provided to identify failure such as debonding, in-plain expansion of the slabs. The location of edge strain gauges E1, E2 and E3 in a single layer GFRP reinforced slab is shown in figure 3.6. The strain gauges used to measure the GFRP strains are provided in figure 3.7. In a double layered section, C1 and C2 strain gauges are using to measure the top GFRP strain values while C3 and C4 strain gauges measure the bottom GFRP strain. Similarly, E1 and E2 use to measure edge top GFRP strain while E3 and E4 use to measure strain in bottom layer GFRP bars. The GFRP bars' surface was ground smooth to ensure proper contact with the strain gauge and the surface of the bar. The strain gauge wires properly glued together with the reinforcement to avoid possible damage during the pouring of concrete as shown in figure 3.8, and the leads were taken out properly before casting. During testing, the concrete surface strain values were identified with the help of strain gauges attached to the surface of the concrete, as shown in Figure 3.9. All the slabs were then ready for casting as shown in figure 3.10
Figure 3. 7 Location of strain gauges in double-layered slab 83
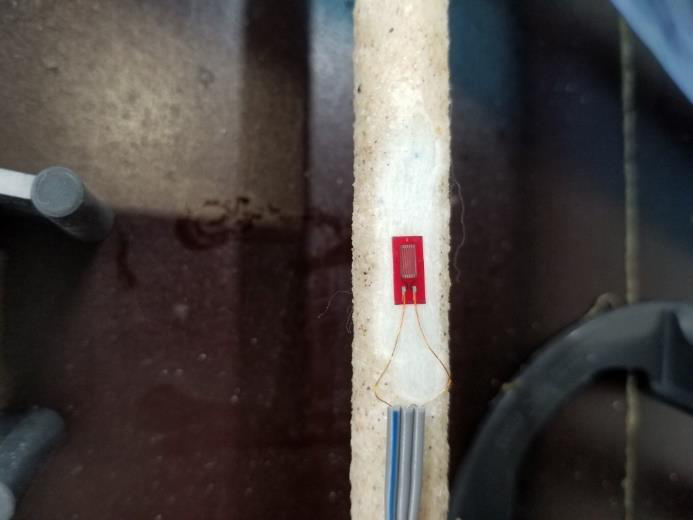
Figure 3. 10 Slabs ready for casting.
3.6.4 Slab casting
Figure 3.11( a )Pouring of Concrete Figure 3.11 ( b ) Damping of the Concrete
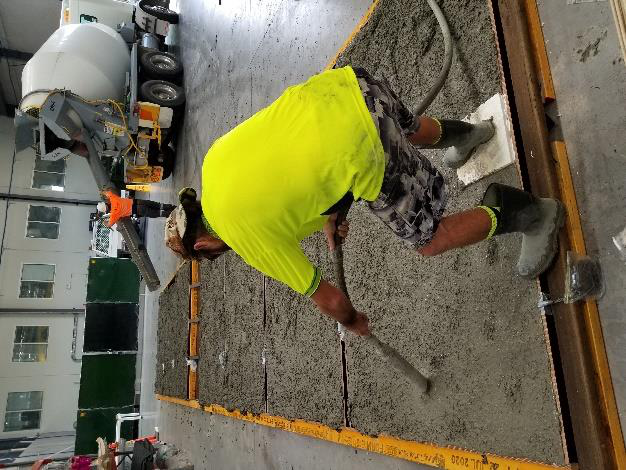
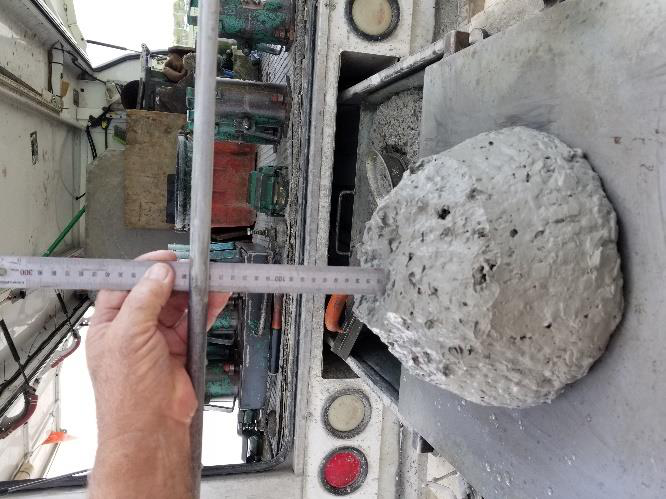
Figure 3.11( e ) Slump Test
Figure 3. 12 (a) Slabs transported to the P11 testing facility.
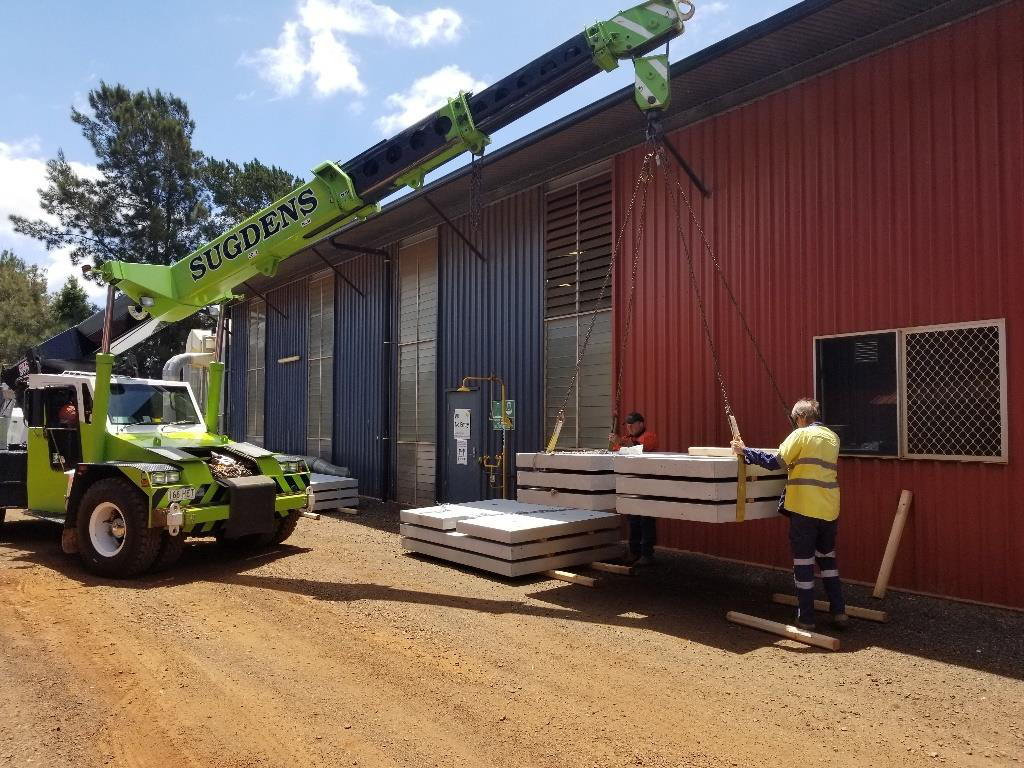
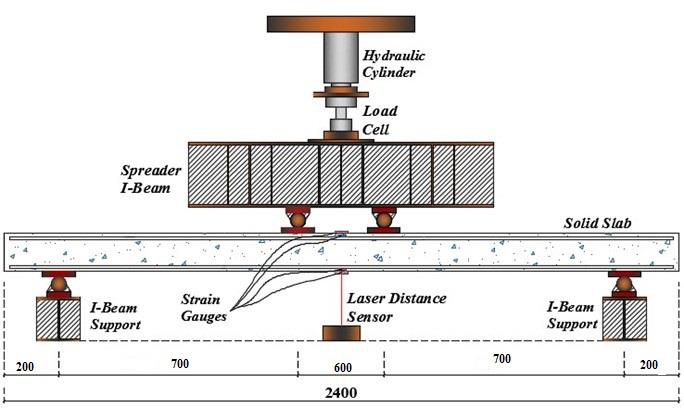
Figure 3. 13 (a) Schematic Diagram
An experimental program was carefully designed to investigate the flexural behavior of reinforced concrete slab. The details provided in this chapter include the material properties, slab details, materials required, specimen preparation, concrete casting, test set up and instrumentation. Four slabs (a single layer GFRP reinforcement slab with cutting, a single layer GFRP reinforcement slab without cutting, a double layer GFRP reinforcement slab without cutting, a double layer GFRP reinforcement slab without cutting) were prepared for testing under four-point static bending to evaluate their performance. The results and observations from this testing will be presented in the next chapter.
90
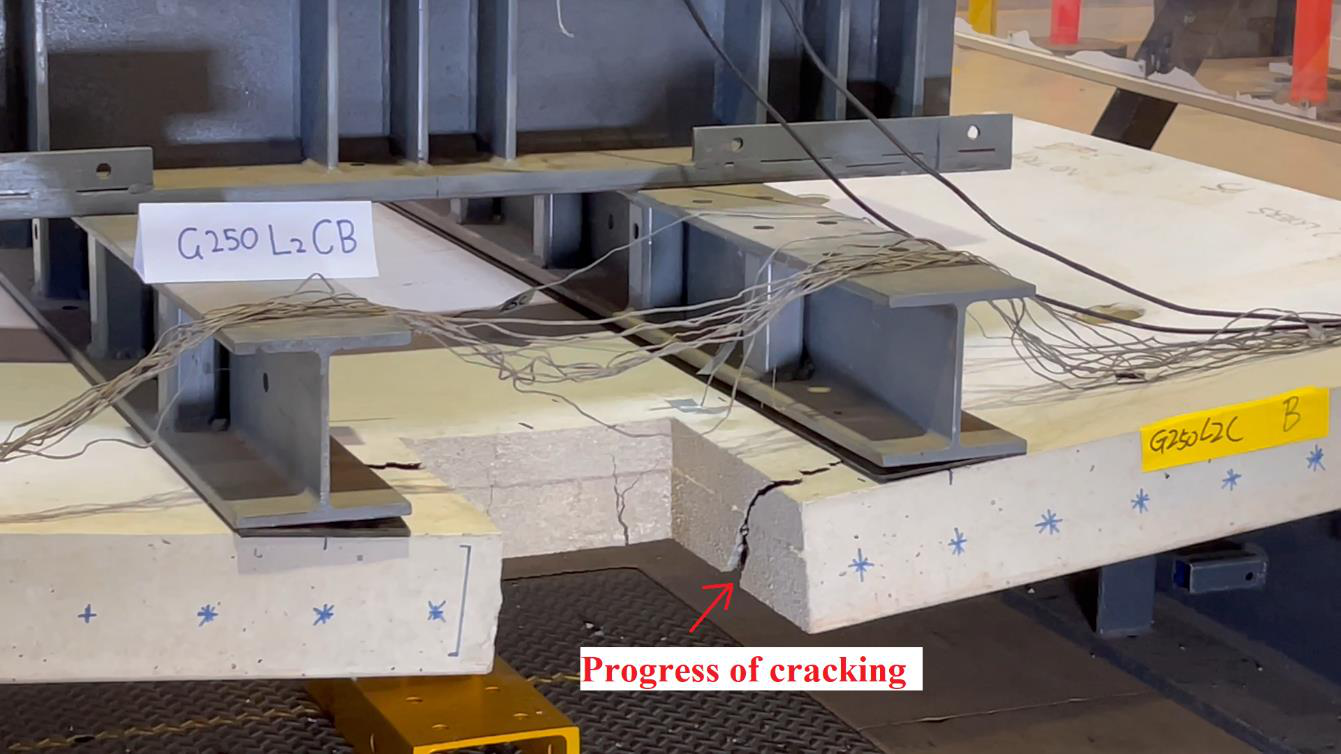
4.2.1. Crack pattern and Failure Mode
G250L2CB is the first slab tested on four-point bending. During the flexural loading test, slab G250L2CB exhibited higher stiffness with minor deformation before the initial cracking. The load transfer across the supports takes place through the non-cutting region of the slab, which leads to the stress accumulation at the mid-span inside the cutting lead to thin hairline flexural crack generated at the midspan inside the cutting, as shown in figure 4. 1(a) at a load and moment of 33.3268 kN and 11. 6644kN.m, respectively.
Further loading caused an inclined crack on the transverse section of the concrete at cutting as shown in figure 4.1 (c). Due to the inclined stress flow between the supports resulted in inclined cracks at corners as shown in figure 4.1 (d).
92
93
95
4.2.2. Load v/s deflection behaviour
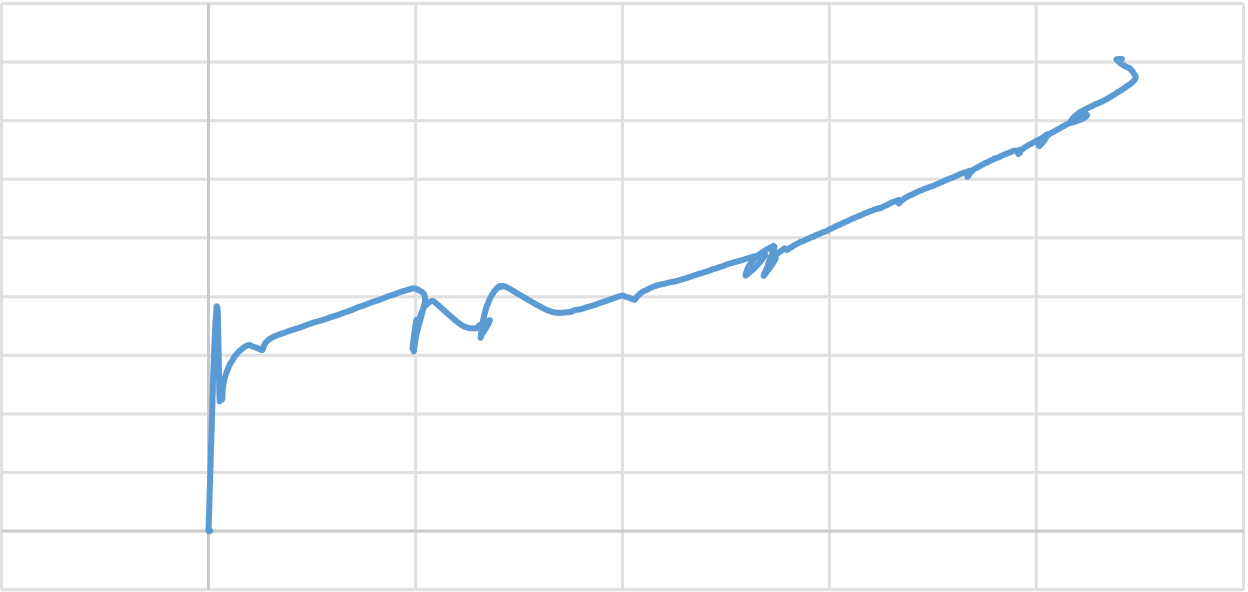
Figure 4. 2 Load – Deflection Behaviour (G250L2CB)
Figure 4.2 shows the load-midspan deflection of slab G250L2CB. The curve has three segments. The first segment of the curve relates to the uncracked stiffer section of the slab with a stiffness of 9.88kN/mm until the first crack appeared at a load of 33.3268 kN with a mid-span deflection of 3.16 mm. When the tensile stress in the extreme fiber increased beyond its tensile capacity, the vertical crack starts to propagate within the loading point and reduce the stiffness of the slab, which leads to the second segment of the curve. This short region represents the transfer of the load from cracked concrete towards the flexural GFRP bars. After the complete transfer of the load from concrete in the tension zone to GFRP bars, further formation of flexural cracks is eliminated, and the GFRP bars start to carry the tensile load. The third region in the curve has a lower stiffness value of 1.118 kN/mm, where the load varies linearly with mid-span deflection. The linear behavior of GFRP bars causes 96
4.2.4.1 Concrete surface strains
The curve has mainly four segments. In the first segment, the variation in the strain value of top surface concrete exhibited the pre-cracking phase. The maximum concrete compressive strain value of 70 microstrains was recorded at the rupture capacity of 33.3268kN and 11.664kNm, respectively, as shown in figure 4.4 and 4.5. The maximum compressive microstrain value recorded on the top concrete surface layer was 894 microstrain at a load and moment of 75.304kN and 26.3566kNm, respectively. On further loading, the strain gauge measurements on the top concrete surface layer linearly decrease due to the reduction in the depth of the neutral axis experienced due to premature GFRP rupture. On further loading, the strain on the top surface concrete became zero at a maximum load and moment of 115.956 kN and 40.584kNm, respectively. At this instance, the entire slab experience tensile force.
|
|---|
4.2.4.2 Top GFRP strain
Figures 4.6 and 4.7 portray the load and moment v/s strain behaviour of top GFRP bars for slab G250L2CB. As can be seen in the figure, the curve has two different regions. On its initial phase of the curve, the top GFRP bars recorded compressive strain linearly up to the initial cracking. It can be due to the alignment of the neutral axis at the geometric centre of the section on its pre cracking stage. After initial cracking at a load and moment of 33.3268 kN and 11.664 kN.m, respectively, the strain on the top GFRP bars shifted from the compressive region to the tensile region. It also well agrees with the theoretical estimation of the depth of the neutral axis of the cracked section. In this post cracking stage, the tensile strain on the top GFRP bar increases linearly with the applied load and moment. When the loading reached at a loading and moment of 115.956 kN and 40.584 kN.m. respectively, the recorded tensile strain value on the top GFRP bar was 3711 microstrain.
|
|---|
Figure 4. 6 Load – Top GFRP strain
|
|---|
101
Micro strain |
|---|
Figure 4. 8 Load – strain behavior of bottom GFRP bar
|
|---|
Figure 4. 9 Moment – strain behavior of bottom GFRP bar.
103
4.10(e), and the slab starts to show a horizontal shear crack with tension shear failure as shown in Figure 4.10(g). This mode of failure can be due to high deflection of slab lead to the formation of horizontal shear crack and the shallow compression zone in concrete because of the low modulus of elasticity of the GFRP bars. ( Manalo .A.C and O. Aljarmeh, 2020)
4.10 (c) Progress of cracking from bottom corners to top layer
106
DEFLECTION(mm) |
|---|
Figure 4. 11 Load – Deflection Behaviour (G150L1CB) 107
4.3.4. Strain behaviour
4.3.4.1 Concrete surface strains
100
0 |
|---|
110
4.3.4.2 GFRP strain
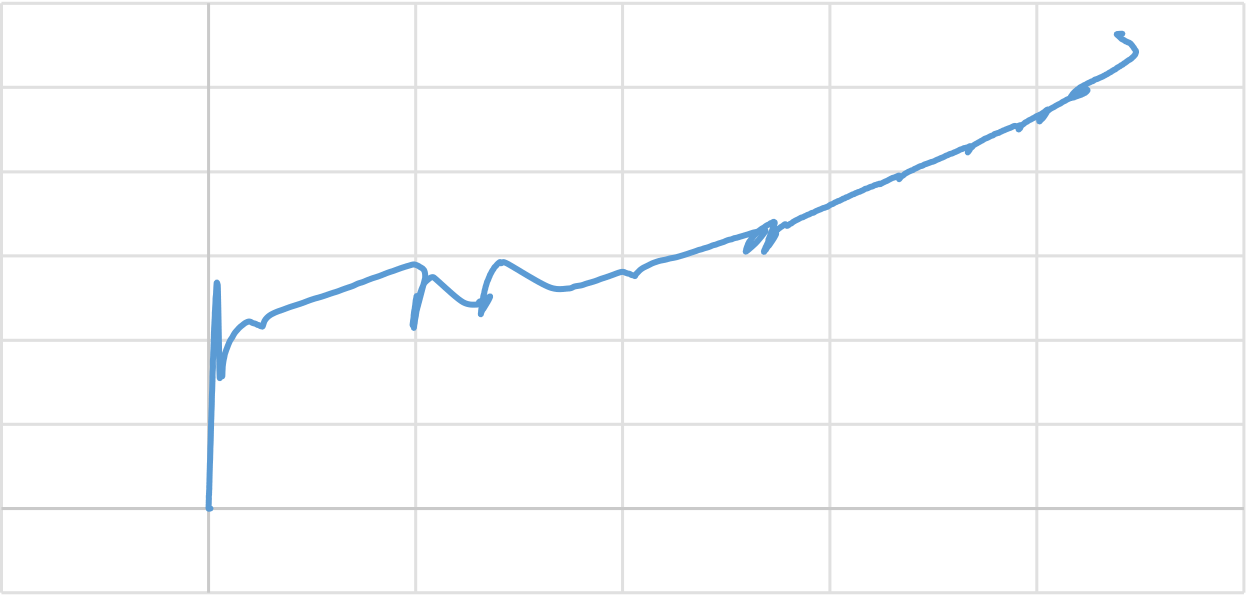
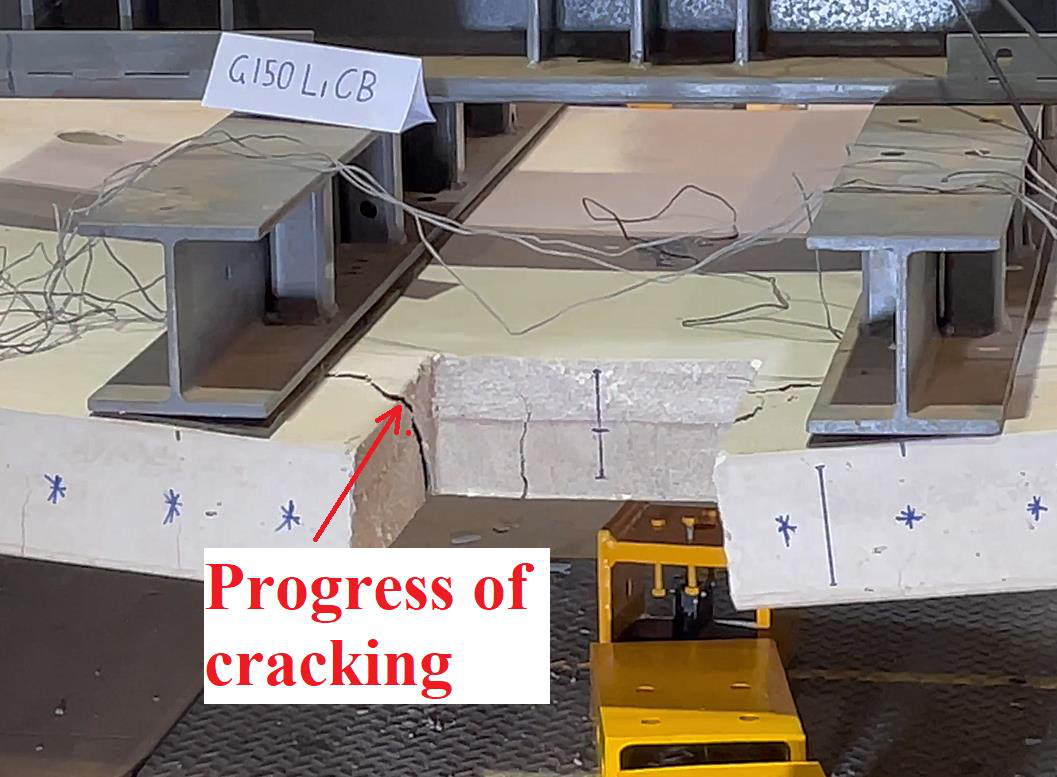
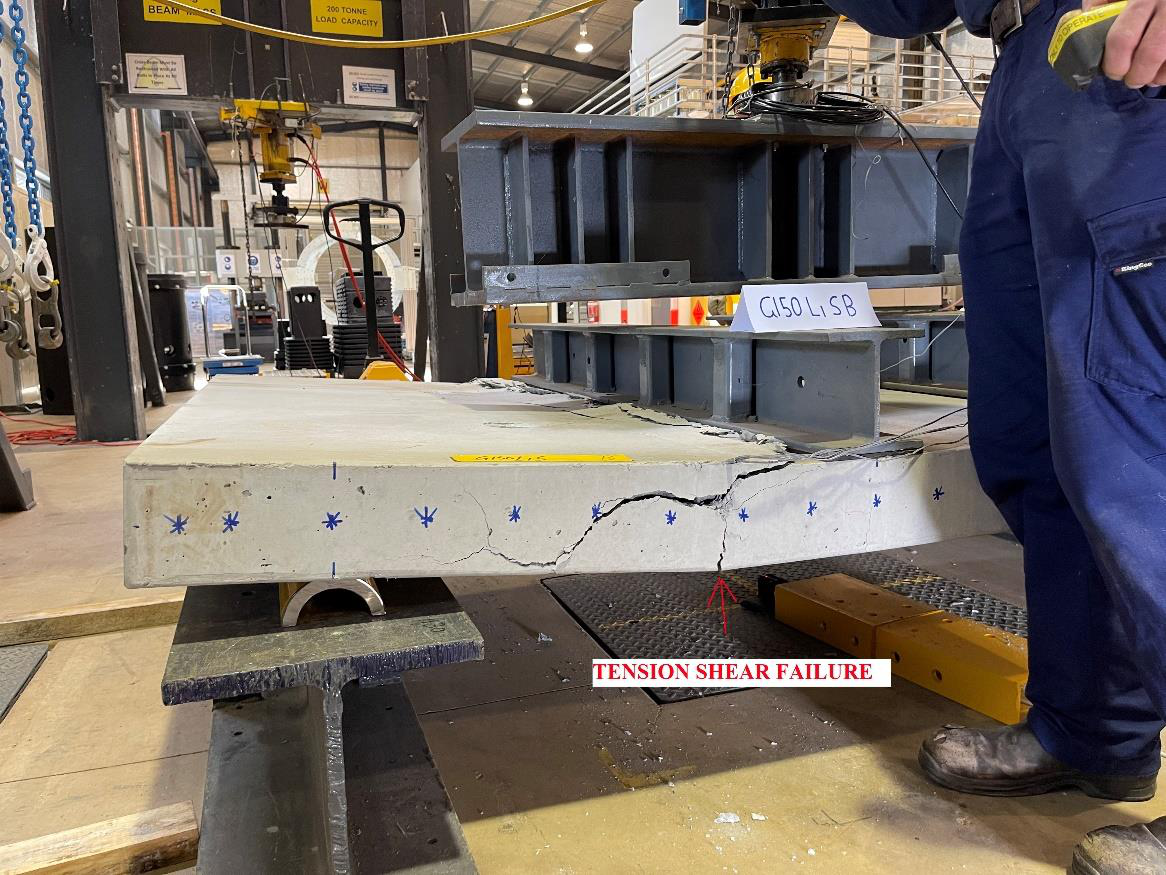
At advanced loading, high deflection leads to horizontal shear crack at the level of longitudinal reinforcements. As the load increased, these cracks became wider and progressed towards the top compression layer. The final failure of the slab was due to tension shear failure as the flexural crack from the bottom of the slab reached the horizontal crack, irrespective of the reinforcement ratio as shown in Figure 4.15 (c). The reinforcement ratio provided in this slab was 1.33ρbf which is recommended by Ganagarao v,s , 2003 for a compression shear failure. It can be due to the shallow compression zone in the concrete because of the low modulus of elasticity of the GFRP bars. These findings were like the findings reported by (O. Alajarmeh &Manalo A.C,2020). Failure of the slab recognized with the help of initial cracks, increased deflection, horizontal crack formation in the shear zone, 111
and the strain gauge value attached with the internal reinforcements at the supports. The failure load and moment were 113.959kN and 39. 8856kN.m respectively which was evident from the readings from the strain gauges attached on the edge of GFRP bars as shown in figure 4.15(d) and 4.15(e).
Figure 4.15 (b) Crack Propagation
|
|---|
Micro strain |
|---|
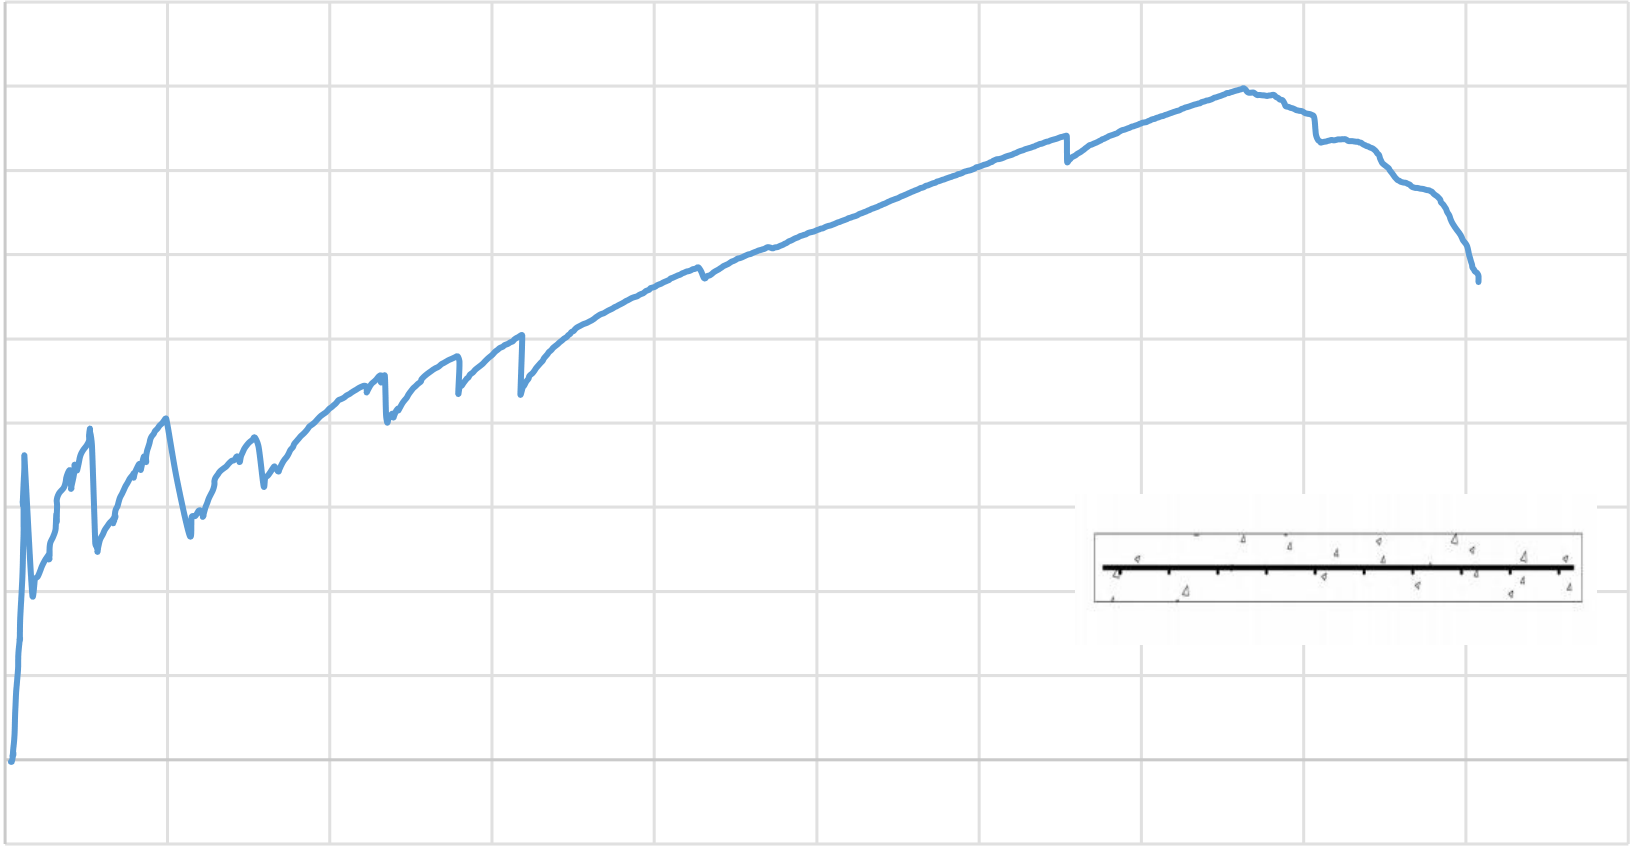
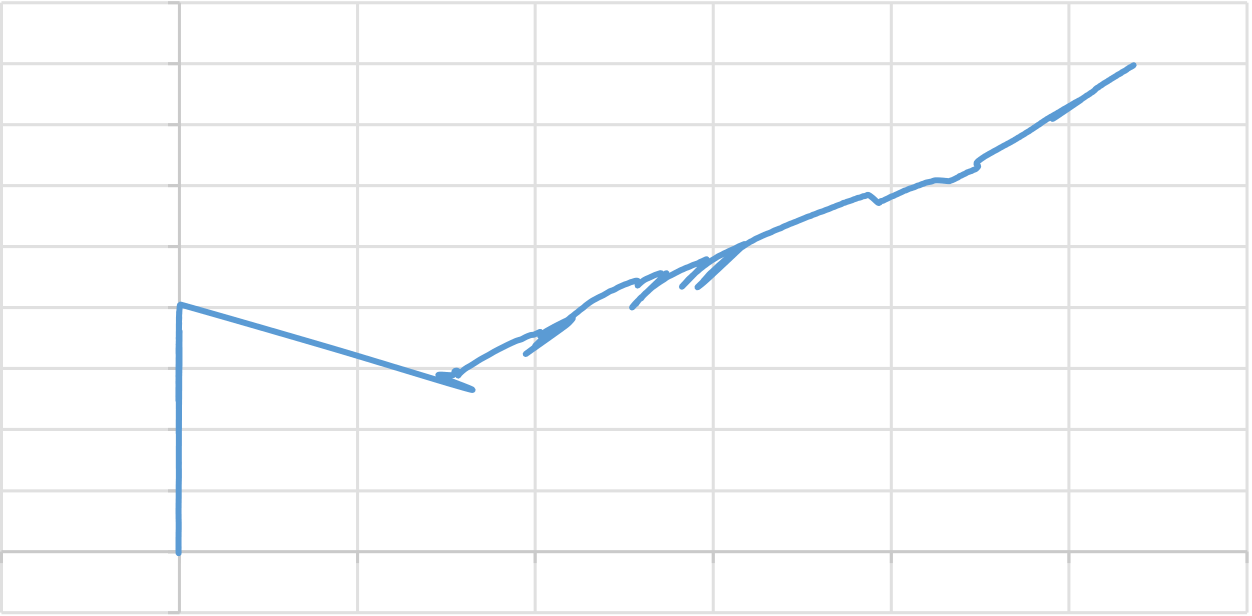
of 0.83 kN/mm which reaches up to a maximum load of 113.959 kN with a midspan deflection of 75.901mm. This is mainly due to the linear behavior of GFRP bars up to failure. The fourth segment of the curve represents a non-linear behavior not because of the GFRP bars but due to the development of the horizontal shear crack followed by a tension failure of the concrete. This shear crack reduces the effective cross-section area of concrete in compression and thereby the aggregate interlock. This further reduces the load to 81.049 kN and shows a larger deflection of 90.259mm at the end of this fourth segment.
Mid-span displacement(mm) |
|---|
Figure 4. 17 Moment-Deflection Behaviour (G150L1SB)
4.4.4.1 Concrete surface strains
Figure 4.18 and 4.19 shows the relationship between the load and moment v/s strain behaviour at the top of the slab G150L1SB. The curve has mainly three segments. The first segment shows the variation in the strain before the post cracking stage at a maximum load of 51.6801kN or maximum moment of 18.088kNm and a recorded strain value of 143 micro strain. After the first cracking, there is a short second stage that shows load transfer between concrete and GFRP bars in the tension zone. The third zone in the curve exhibits a linear ascending behaviour of the strain on the concrete surface where the strain on the surface of 117
Figure 4. 18 Load – strain behavior for top concrete
Moment v/s Concrete surface strain |
|---|
Figure 4. 19 Moment – strain behavior for top concrete
118
|
|---|
|
|---|
Figure 4. 21 Moment – strain behavior of GFRP bar.
4.5 DOUBLE LAYER SLAB WITHOUT CUTTING (G250L2SB)
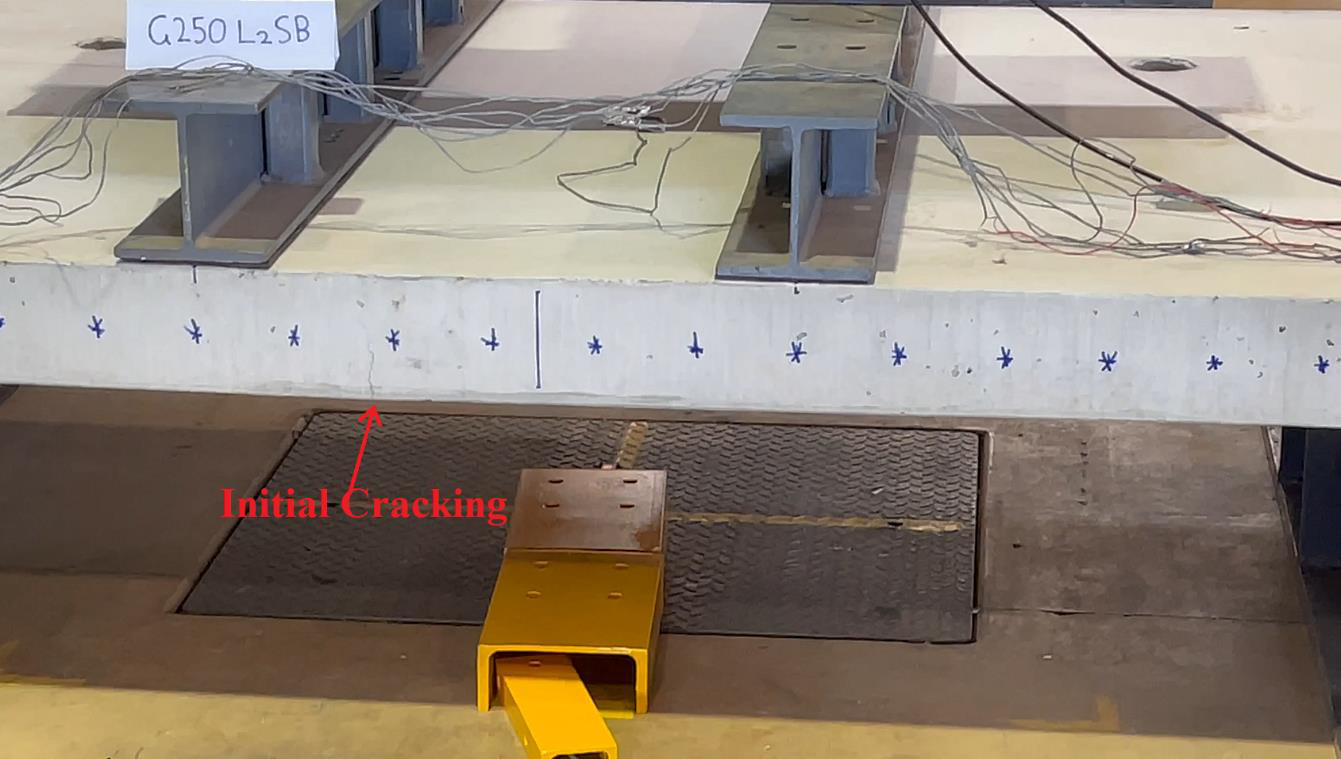
Figure 4. 22(a): Initial Cracking
Figure 4.22(c): Final failure
122
Figure 4.22(d): Final failure
|
|---|
Figure 4.22(e): Final failure
123
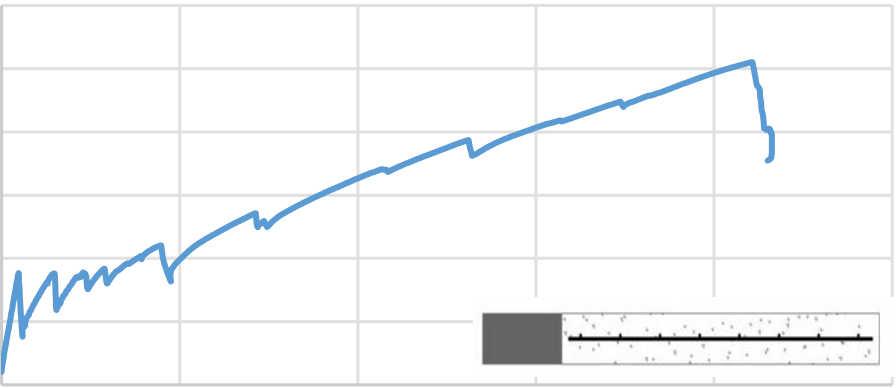
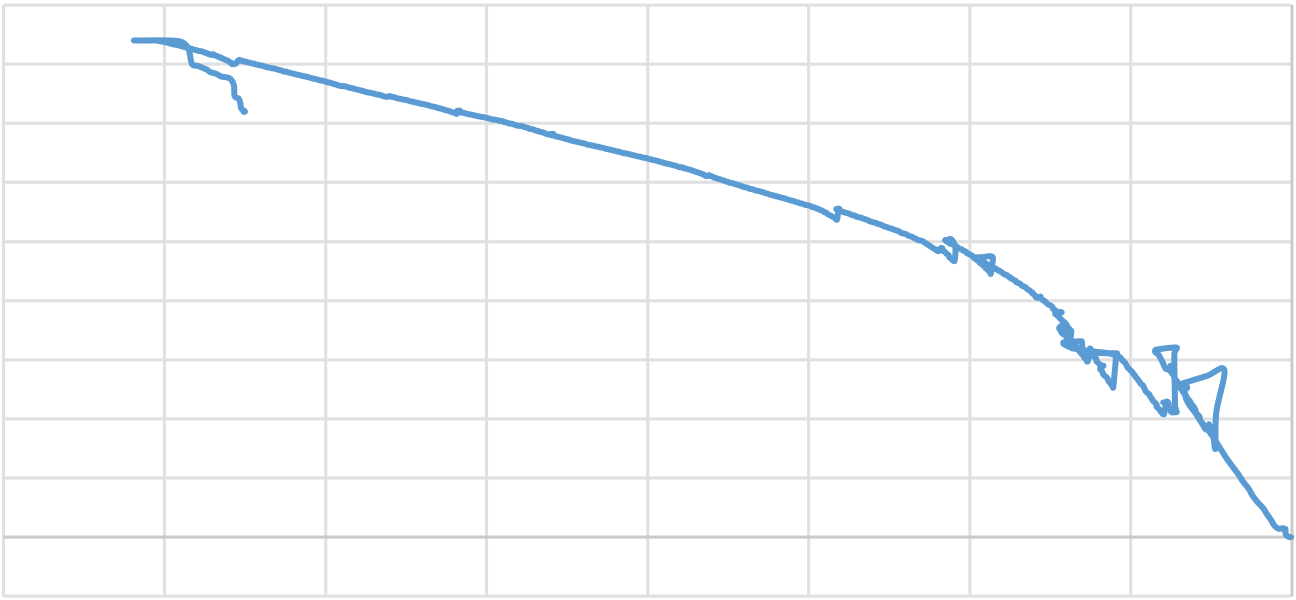
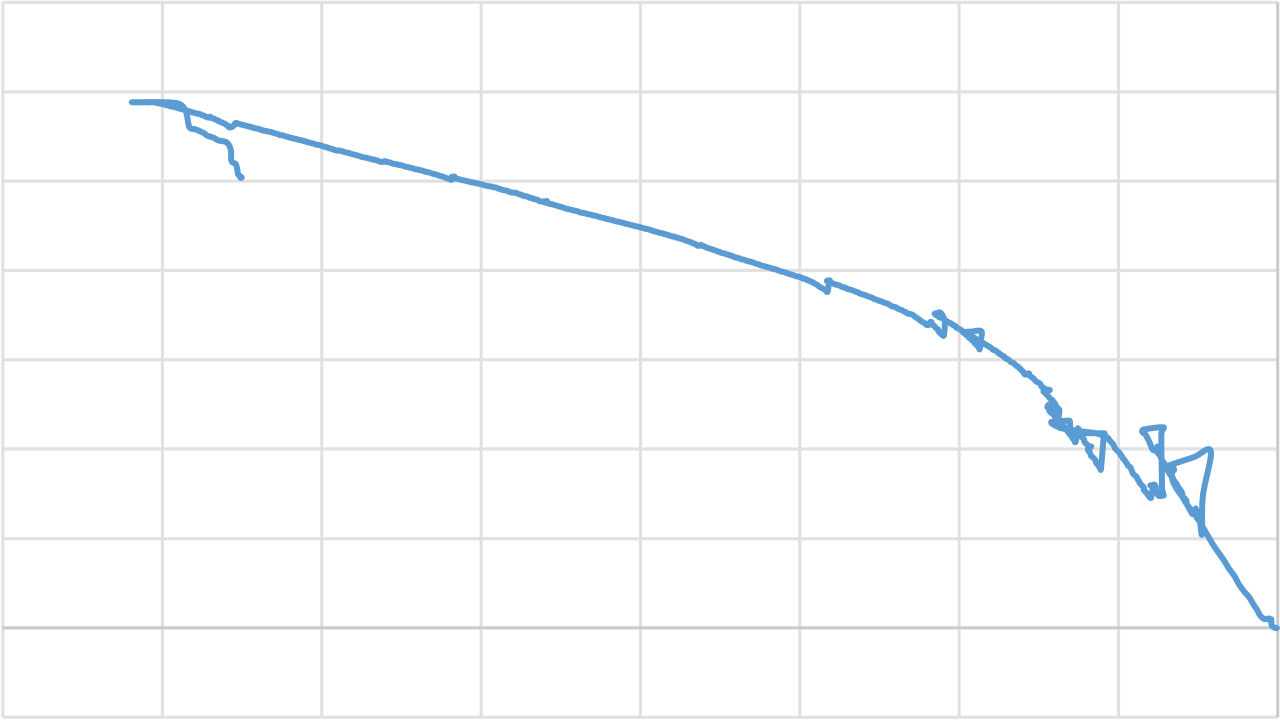
the load vary linearly with mid-span deflection and reaches up to a failure load of 111.108 kN with a midspan deflection of 49.909mm. The linear behaviour of GFRP bars causes the third linear region in the curve. The failure of the slab is recognized when the tension crack reached the horizontal shear crack. The final cracking was due to the tension shear failure. This shear crack reduces the effective cross-section area of concrete in compression and thereby the aggregate interlock. The slab did not reach its ultimate load due to safety considerations.
4.5.3. Moment v/s deflection behaviour
Figure 4. 24 Moment-Deflection Behaviour (G250L2SB)
Figure 4.24 shows the load-midspan deflection of slab G250L2SB. The curve has three segments. The first segment of the curve relates to the uncracked stiffer section of the slab 125
surface of the concrete reaches linearly up to a value of 565 micro strain in compression at a failure load of 111.108 kN and a moment of 38.8878 kN.m.
Figure 4. 25 Load – strain behavior for top concrete
4.5.4.2 Top GFRP strain
Figures 4.27 and 4.28 portray the load and moment v/s strain behaviour of top GFRP bars for slab G250L2SB. As can be seen in the figure, the curve has two different regions. On its initial phase of the curve, the top GFRP bars recorded compressive strain linearly up to the initial cracking. It can be due to the alignment of the neutral axis at the geometric centre of the section on its pre cracking stage. After initial cracking at a load and moment of 56.4727 kN and 19.765 kN.m, respectively, the strain on the top GFRP bars shifted from the compressive region to the tensile region. It also well agree with the theoretical estimation of the depth of the neutral axis of the cracked section. In this post cracking stage, the tensile strain on the top GFRP bar increases linearly with the applied load and moment. When the loading reached its failure loading and moment of 111.108 kN and 38.8878 kN.m. respectively, the recorded tensile strain value on the top GFRP bar was 1230 tensile microstrain.
129
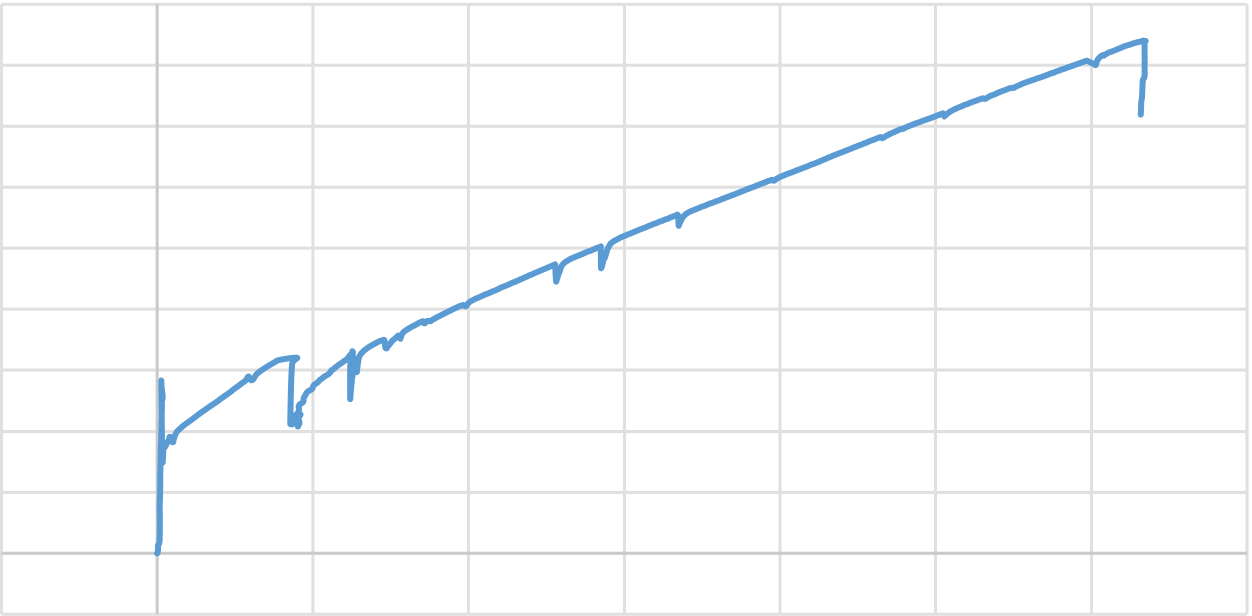
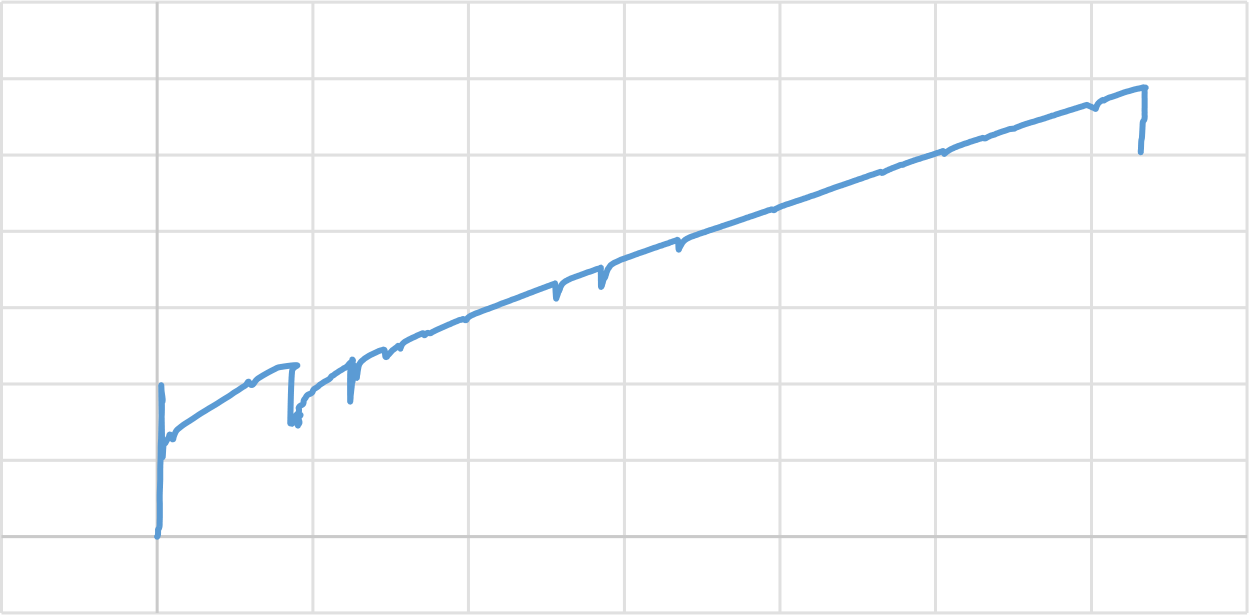
Figure 4. 30 Moment – strain behavior of bottom GFRP bar.
| 130 |
|---|
4.6.2 Failure behaviour of slabs
Table 4.2 summarises the failure behaviour and associated data obtained from the experiment.
| ρf (%) |
ρf/ ρbf | Failure Behaviour | |||||||
|---|---|---|---|---|---|---|---|---|---|
| Load (kN) |
|
|
|||||||
|
|
33.3268 |
|
Section Failure | |||||
|
102.063 |
|
|
||||||
4.6.3 Stiffness behaviour of slabs.
133
Figure 4. 32 Load – Deflection behavior of GFRP slabs.
Figure 4.31 and 4.32 shows the load and moment deflection behaviour of all four slabs. All slabs exhibited a trilinear ascending behaviour until failure as agreeing with CSA-12. The initial higher stiffer section of all these graphs represents the uncracked behaviour of the slabs. In this phase, slab G250L2CB exhibited stiffness of 9.88kN/mm until the cracking of slab at a moment of 11.664kNm and moment of 33.3268kN. Slab G150L1CB exhibited stiffness of 15.613 kN/mm till it reaches the cracking load of 35.336 kN and moment of 12.3678kNm. Slab G150L1SB has a stiffness of 63.086 kN/mm before cracking until the cracking load of 51.68 kN and moment of 18.088 kNm. Slab G250L2SB exhibited stiffness of 73.152 kN/mm before cracking until it reaches a cracking load of 56.4727 kN and a moment of 19.765kNm.
4.6.3 Surface concrete strain behaviour.
Moment v/s concrete surface strain |
|---|
Figure 4. 33 Moment – Concrete surface strain behavior.
135
4.6.3 Bottom GFRP strain behaviour.
Moment v/s GFRP Strain |
|---|
5.1 INTRODUCTION
In this chapter we are discussing the validation of experimental results with theoretical estimation on the capacities and doing a comparative analysis of the performance of the slabs.
|
|
|||
|---|---|---|---|---|
| 50 | 50 | 50 | 50 | |
| 33.3268 | 35.336 | 51.68 | 56.4727 | |
|
11.664 | 12.3678 | 18.088 | 19.765 |
| 15.3495 | 16.0533 | 21.868 | 23.545 | |
| 13.25 | 13.25 | 16.572 | 16.572 |
139
modulus of rupture has been calculated using the characteristic compressive strength (fc’ = 50MPa) and the section geometry. The results show that the theoretical Mcr1 underestimated the experimental rupture capacity (Mcr1 including and excluding the self-weight) for slabs without cutting. On the other hand, it was overestimated for slabs with cutting. In all cases, using fr as reported by CSA-14 underestimated the experimental rupture capacity (Mcr1). At the same time, the rupture capacity of slabs without cutting was highly underestimated by theoretical Mcr1 with a 24.45% increase for G150L1SB and 29.61% increase for G250L2SB. In slabs with cutting, single-layered slab exhibited higher rupture capacity than theoretically predicted value compared with the double-layered slab. At the same time, among slabs without cutting, double-layered slab exhibited higher rupture capacity than theoretical Mcr1 compared with single-layered slabs.
140
|
CSA-S806-12 | |||||
|---|---|---|---|---|---|---|
|
11.664 | 15.349 | 33.326 | 43.856 | 43.053 | 93.176 |
|
35.722 | 39.407 | 102.063 | 112.593 | 33.262 | 116.155 |
| 39.88 | 43.66 | 113.959 | 124.759 | 41.578 | 145.193 | |
| 38.88 | 42.66 | 111.108 | 121.908 | 56.583 | 120.247 | |
| 38.88 | 42.66 | 111.108 | 121.908 | 56.54 | 18.824 |
|---|
Table 5.2 and 5.3 provide the validation of the theoretical analysis done through CSA-S806-12 and ACI-440.IR-15. The ultimate moment capacity obtained through both methods were the same. G250L2CB exhibited a section failure among all slabs. The shear capacity calculation from the equations provided by CSA-S806-12 provides a good prediction over the shear capacity of the slabs. However, as it overestimates the shear capacity of the single-layered slab, it slightly underestimates the shear capacity of the double-layer slab, which is finding are similar to (O. Aljarmeh and Manalo A.C, 2020). The massive difference in predicting the shear capacity among the ACI and CSA method can be due to excluding dowel force and aggregate interlock in the ACI method. (O. Aljarmeh and Manalo A.C, 2020).
5.3 DISCUSSION ON THE EFFECT OF CUTTING AND DOUBLE LAYER IN SLABS.
During testing, slab G150L1CB exhibited initial cracking at the midspan inside the cutting due to a reduction in the cross-sectional area. At the same time, the initial cracking for slab G150L1SB occurred under the loading point due to stress concentration. The slab G150L1CB has a rupture capacity of 35.3362kN or 12.36768kNm, which is around 31.625% less than the rupture capacity of slab G150L1SB at a load and moment of 51.68kN and 18.088kNm. For slab G150L1CB, the crack propagation after initial cracking exhibited by cracking at corners. This crack progressed to the upside through the transverse section of cutting, while in the case of G150L1SB fine flexural cracks developed well across the span and propagated upward on the load increment. In the case of G150L1CB, the cracking at the corners of cutting may be due to inclined stress transfer apart from the direction of longitudinal reinforcements. It may be due to disturbance in the symmetry of prismatic member due to cutting. The number of cracks in G150L1CB was fever than G150L1SB, which can be due to more energy dissipation and widening of inclined cracks at the corners.
Both slabs failed in tension shear failure. While the slab G150L1CB failed at a load and moment of 75.446kN and 26.406kNm, respectively, the failure load of G150L1SB was 113.959kN and 39.8856kNm. The percentage of reduction in the failure load was around 33.7% for G150L1CB than G150L1SB, which is non-linear to the reduction in the cross-sectional area. This difference may be due to inclined stress flow and various shear failure mechanism involved.
144
5.3.3 Effect of double layer in slabs without cutting. (G150L1SB V/S G250L2SB)
The double-layer effect in slab with cutting can be observed through the performance of slab G150L1CB and G250L2CB. In this case, slab G250L2CB has a reinforcement ratio of
0.295% and a 0.83ρbf. Slab G150L1CB has a reinforcement ratio of 0.633% with 1.33ρbf. Arranging reinforcements into a double layer reduced the shear span to effective depth ratio (a/d) from 9.39 to 7. The initial cracking in G250L2CB occurred at midspan inside cracking at a load and moment of 33.3268kN and 11.6644kNm, respectively. Slab G150L1CB exhibited a rupture capacity of 35.3362kN and 12.3678kNm. A slight increase in the rupture capacity of the single-layer slab may be due to better continuity of concrete matrix in the single-layer slabs. Since slab G250L2CB failed immediately after cracking, there is no valid comparison for post cracking phase.
•In the case of the double-layer slab, the reduction in the rupture capacity of concrete due to a 20% reduction in the cross-sectional area is 40.98% which is a non-linear relation due to inclined stress flow and reduced reinforcement ratio of bars.
•The presence of cutting in slabs changed the crack propagation. While slabs without cutting experienced a well-distributed crack propagation across the length of the plank, slabs with cutting exhibited more deep and wide cracks at the corners of the cutting. This can be due to the stress concentration at the edges of these cracks. •In the case of the single-layer slab, the cutting leads to a 33.7% difference in the failure load of the section. This can be due to the effect of cutting on various mechanisms in the shear capacity of the section.
148
REFERENCES
ARAVINTHAN, T. & MANALO, A. Field applications and case studies of FRP in civil infrastructure: the Australian experience. Proceedings of the 6th International Conference on FRP Composites in Civil Engineering (CICE 2012), 2012.
International Institute for FRP in Construction (IIFC).
Canadian Standards Association, CAN/CSA-S806-12 2012 Rexdale ON, Canada. Darwin D, Dolan W.C & Nilson A.H, 2016, Design of concrete structures, Fifteenth edition, 2 Penn Plaza, New York. P.81.
DAVALOS, J. F., KODKANI, S. S., RAY, I. & LIN, C. 2008. Fracture evaluation of GFRP—concrete interfaces for freeze—thaw and wet-dry cycling. Journal of composite materials, 42, 1439-1466.
El-Sayed A, El-Salakawy. E, & Benmokrane. B, 2005, Shear strength of one-way concrete slabs reinforced with fibre-reinforced polymer composite bars, Journal of
composites for construction, ASCE.
149
under static & impact loading.
MAGNUSSON, J. 2000. Bond and anchorage of ribbed bars in high-strength concrete, Chalmers University of Technology.
Southern Queensland.
MARANAN, G., MANALO, A., BENMOKRANE, B., KARUNASENA, W. & MENDIS, P. 2015. Evaluation of the flexural strength and serviceability of geopolymer concrete beams reinforced with glass-fibre-reinforced polymer (GFRP) bars. Engineering Structures.
and prospects, World scientific publishing company.
Nasser. M, 1993, Compressive membrane effects on the behaviour of one-way structural
restrained slab strips, ICE Publishing.
ROBERT, M., COUSIN, P. & BENMOKRANE, B. 2009. Durability of GFRP reinforcing bars embedded in moist concrete. Journal of Composites for Construction.
background and significance, World scientific publishing company.
150
151

153
155
P11 LAB INDUCTION CHECK LIST
158