
And univariate and bivariate analyses
• CB (Customer analysis) – theory relevant to how consumers make decisions (psychology, sociology, etc.)
• Market research – the common approach to unearth how consumer decisions are actually made
• The analyses you are accountable for knowing we discussed in class and are covered in the three Camtasia videos (and are discussed in ch. 12-14).
The final exam is Thursday, 19 August starting at 9 am!!!!! This time was allocated to us…
(This material is in chapter 5, which was covered in the midterm, but please review it again.)
DOES THIS HELP?! (NOT IN TEXT)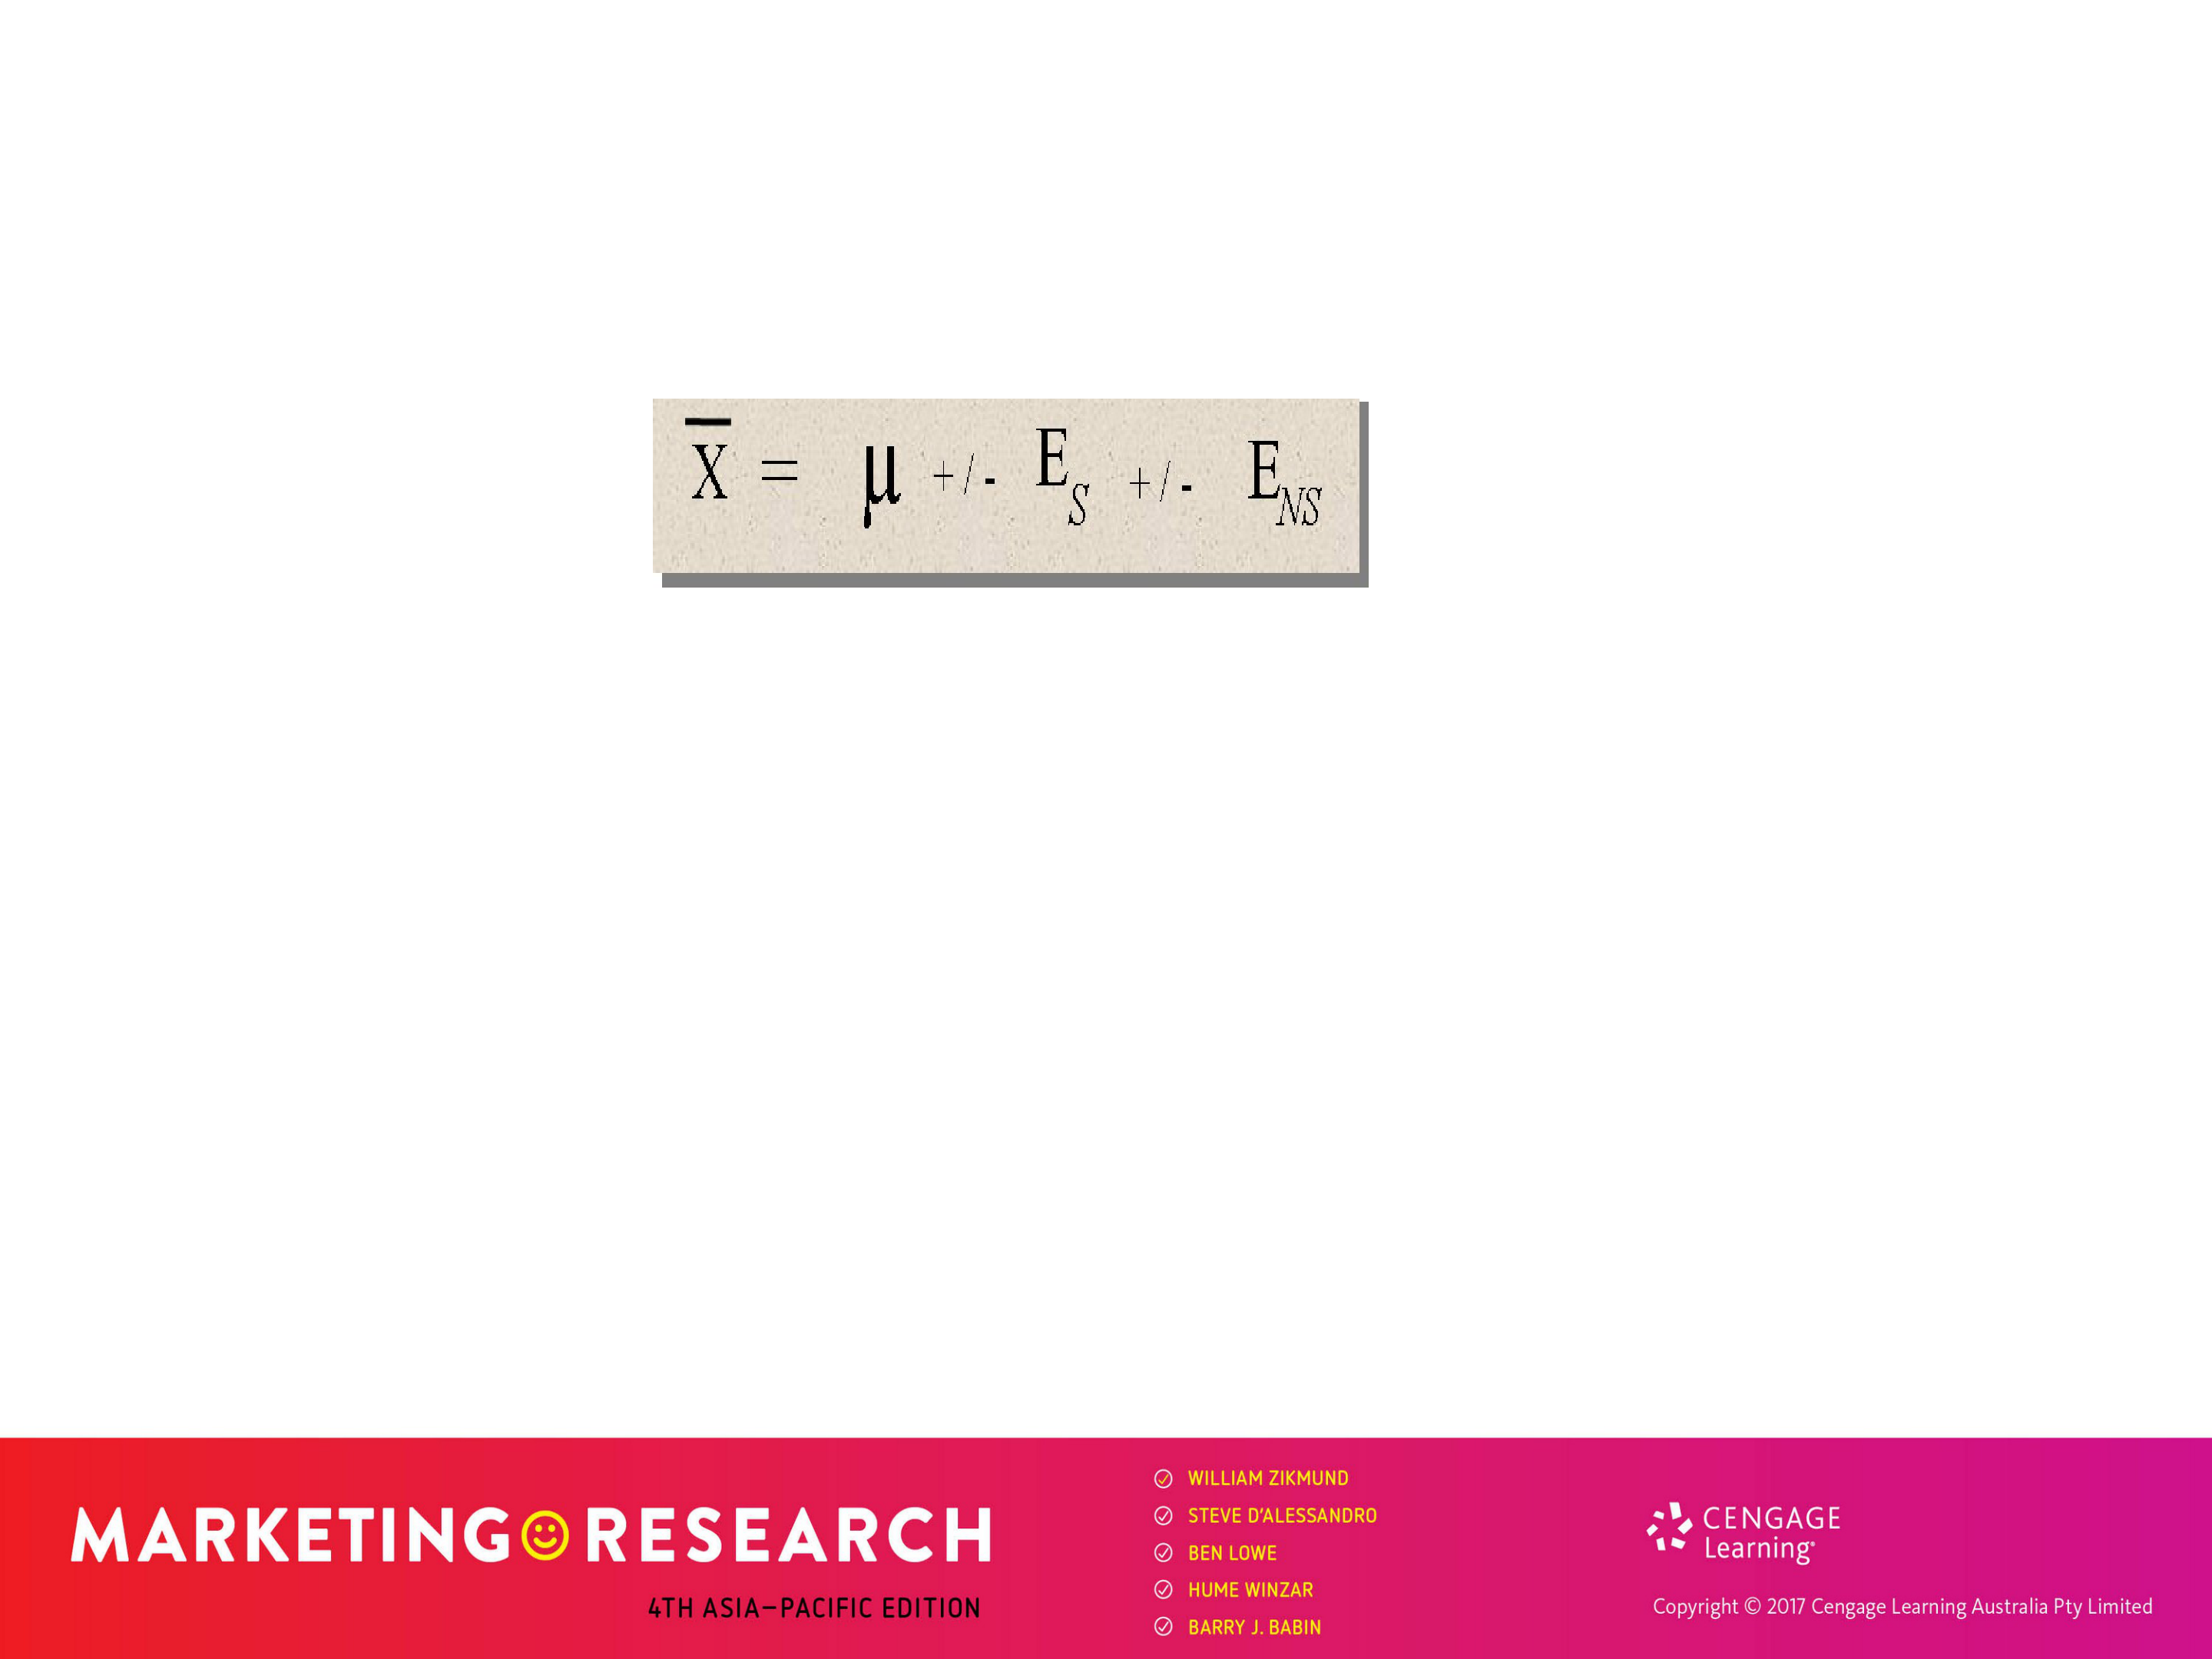
Internet surveys may have a response rate of 1-
2%; in person you may get 25-50% -- a big
– Researchers need to record responses honestly.
For our purposes, do not record their name! Read verbatim or let them read a short introduction to the study (Explanatory Statement). Collect in a public space with people 18+.
Who enjoys the occasional glass of wine? Perhaps a Pinot

How you can ask questions
Change a Likert scale to a semantic differential scale.

| Nominal | |||
|---|---|---|---|
| Nominal |
|
t-test, one-way ANOVA, LOGIT | |
| Interval/ratio | ANOVA | correlations, regression | |

WITH RESPECT TO MEASUREMENT SCALES,
RELIABILITY VS. VALIDITY
The ability to measure what was intended to be measured
– For example, a hard-working student who understands market research does poorly on a test that measures concepts we never discussed in class – the test would not be valid!
If researching McDonald’s, we can probably all agree there needs to be some questions about the food, not just the buildings and signage.
SENSITIVITY
4. Determine the form of response to each question. 5. Determine the wording of each question.
6. Determine questions’ sequence.
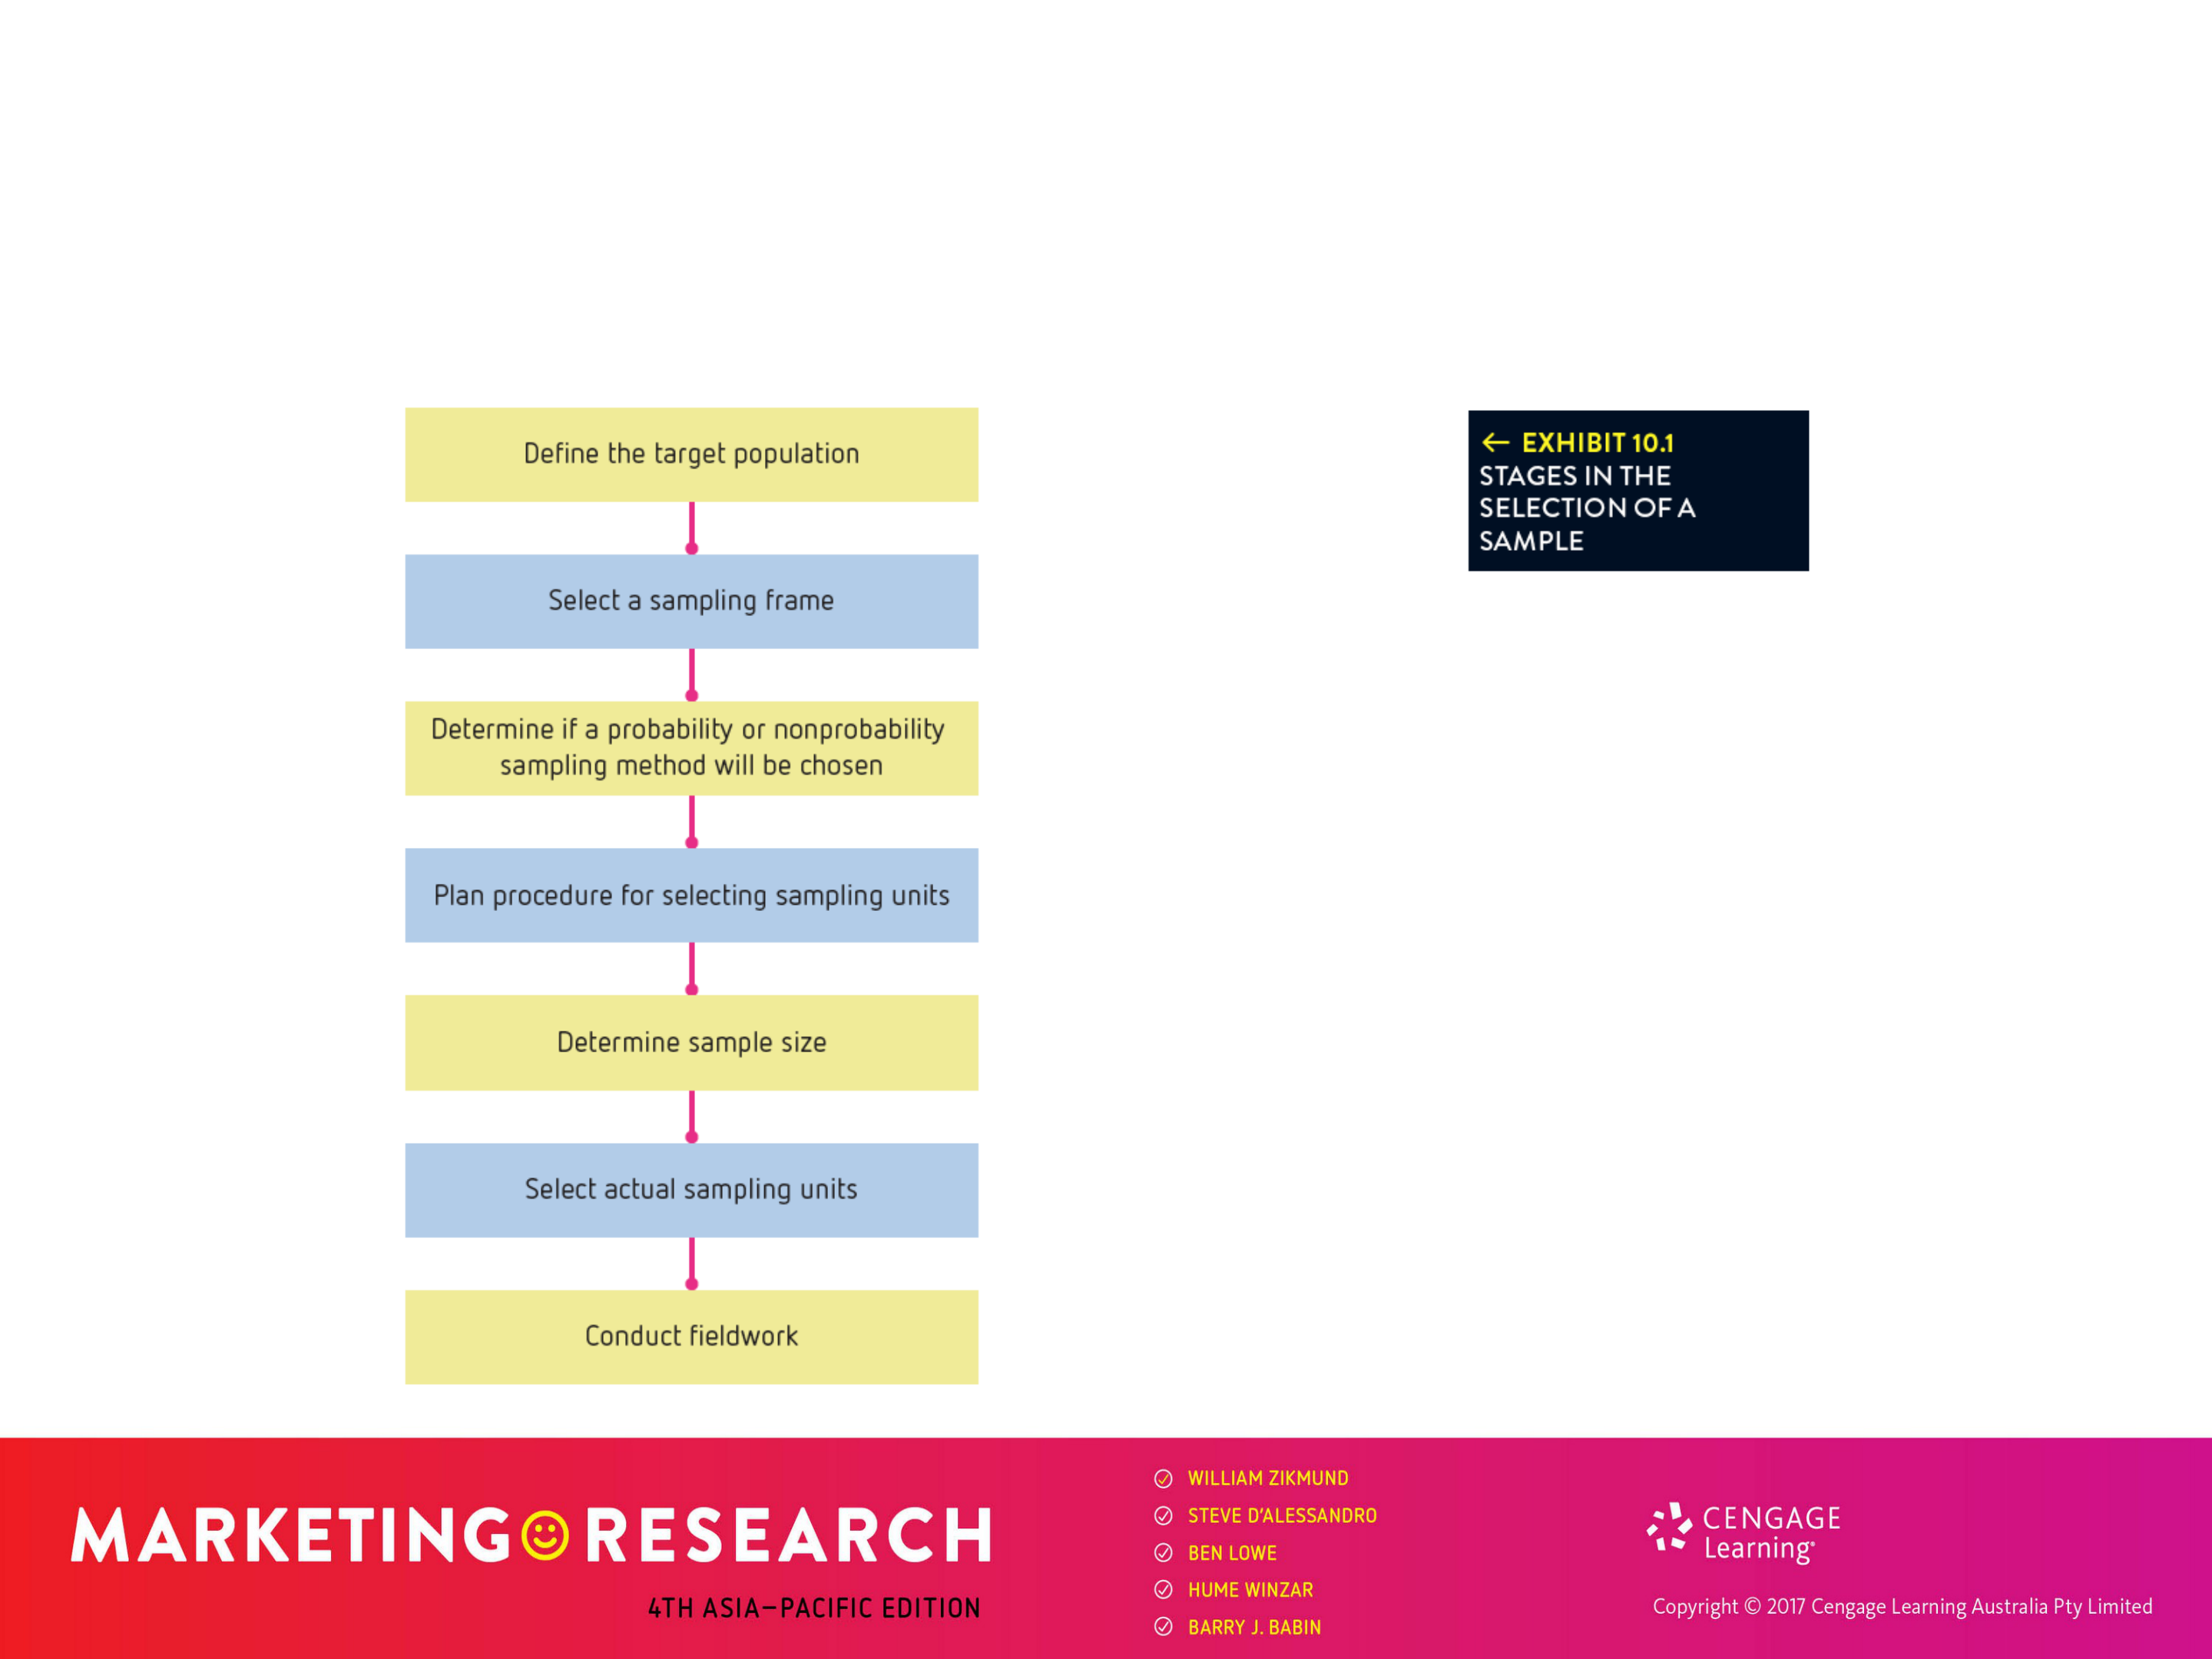
STAGES IN THE SELECTION OF A SAMPLE
PROBABILITY VS NONPROBABILITY SAMPLING

| Sampling Methods |
|---|
DESCRIPTIVE VERSUS
INFERENTIAL STATISTICS (IN GENERAL TERMS)
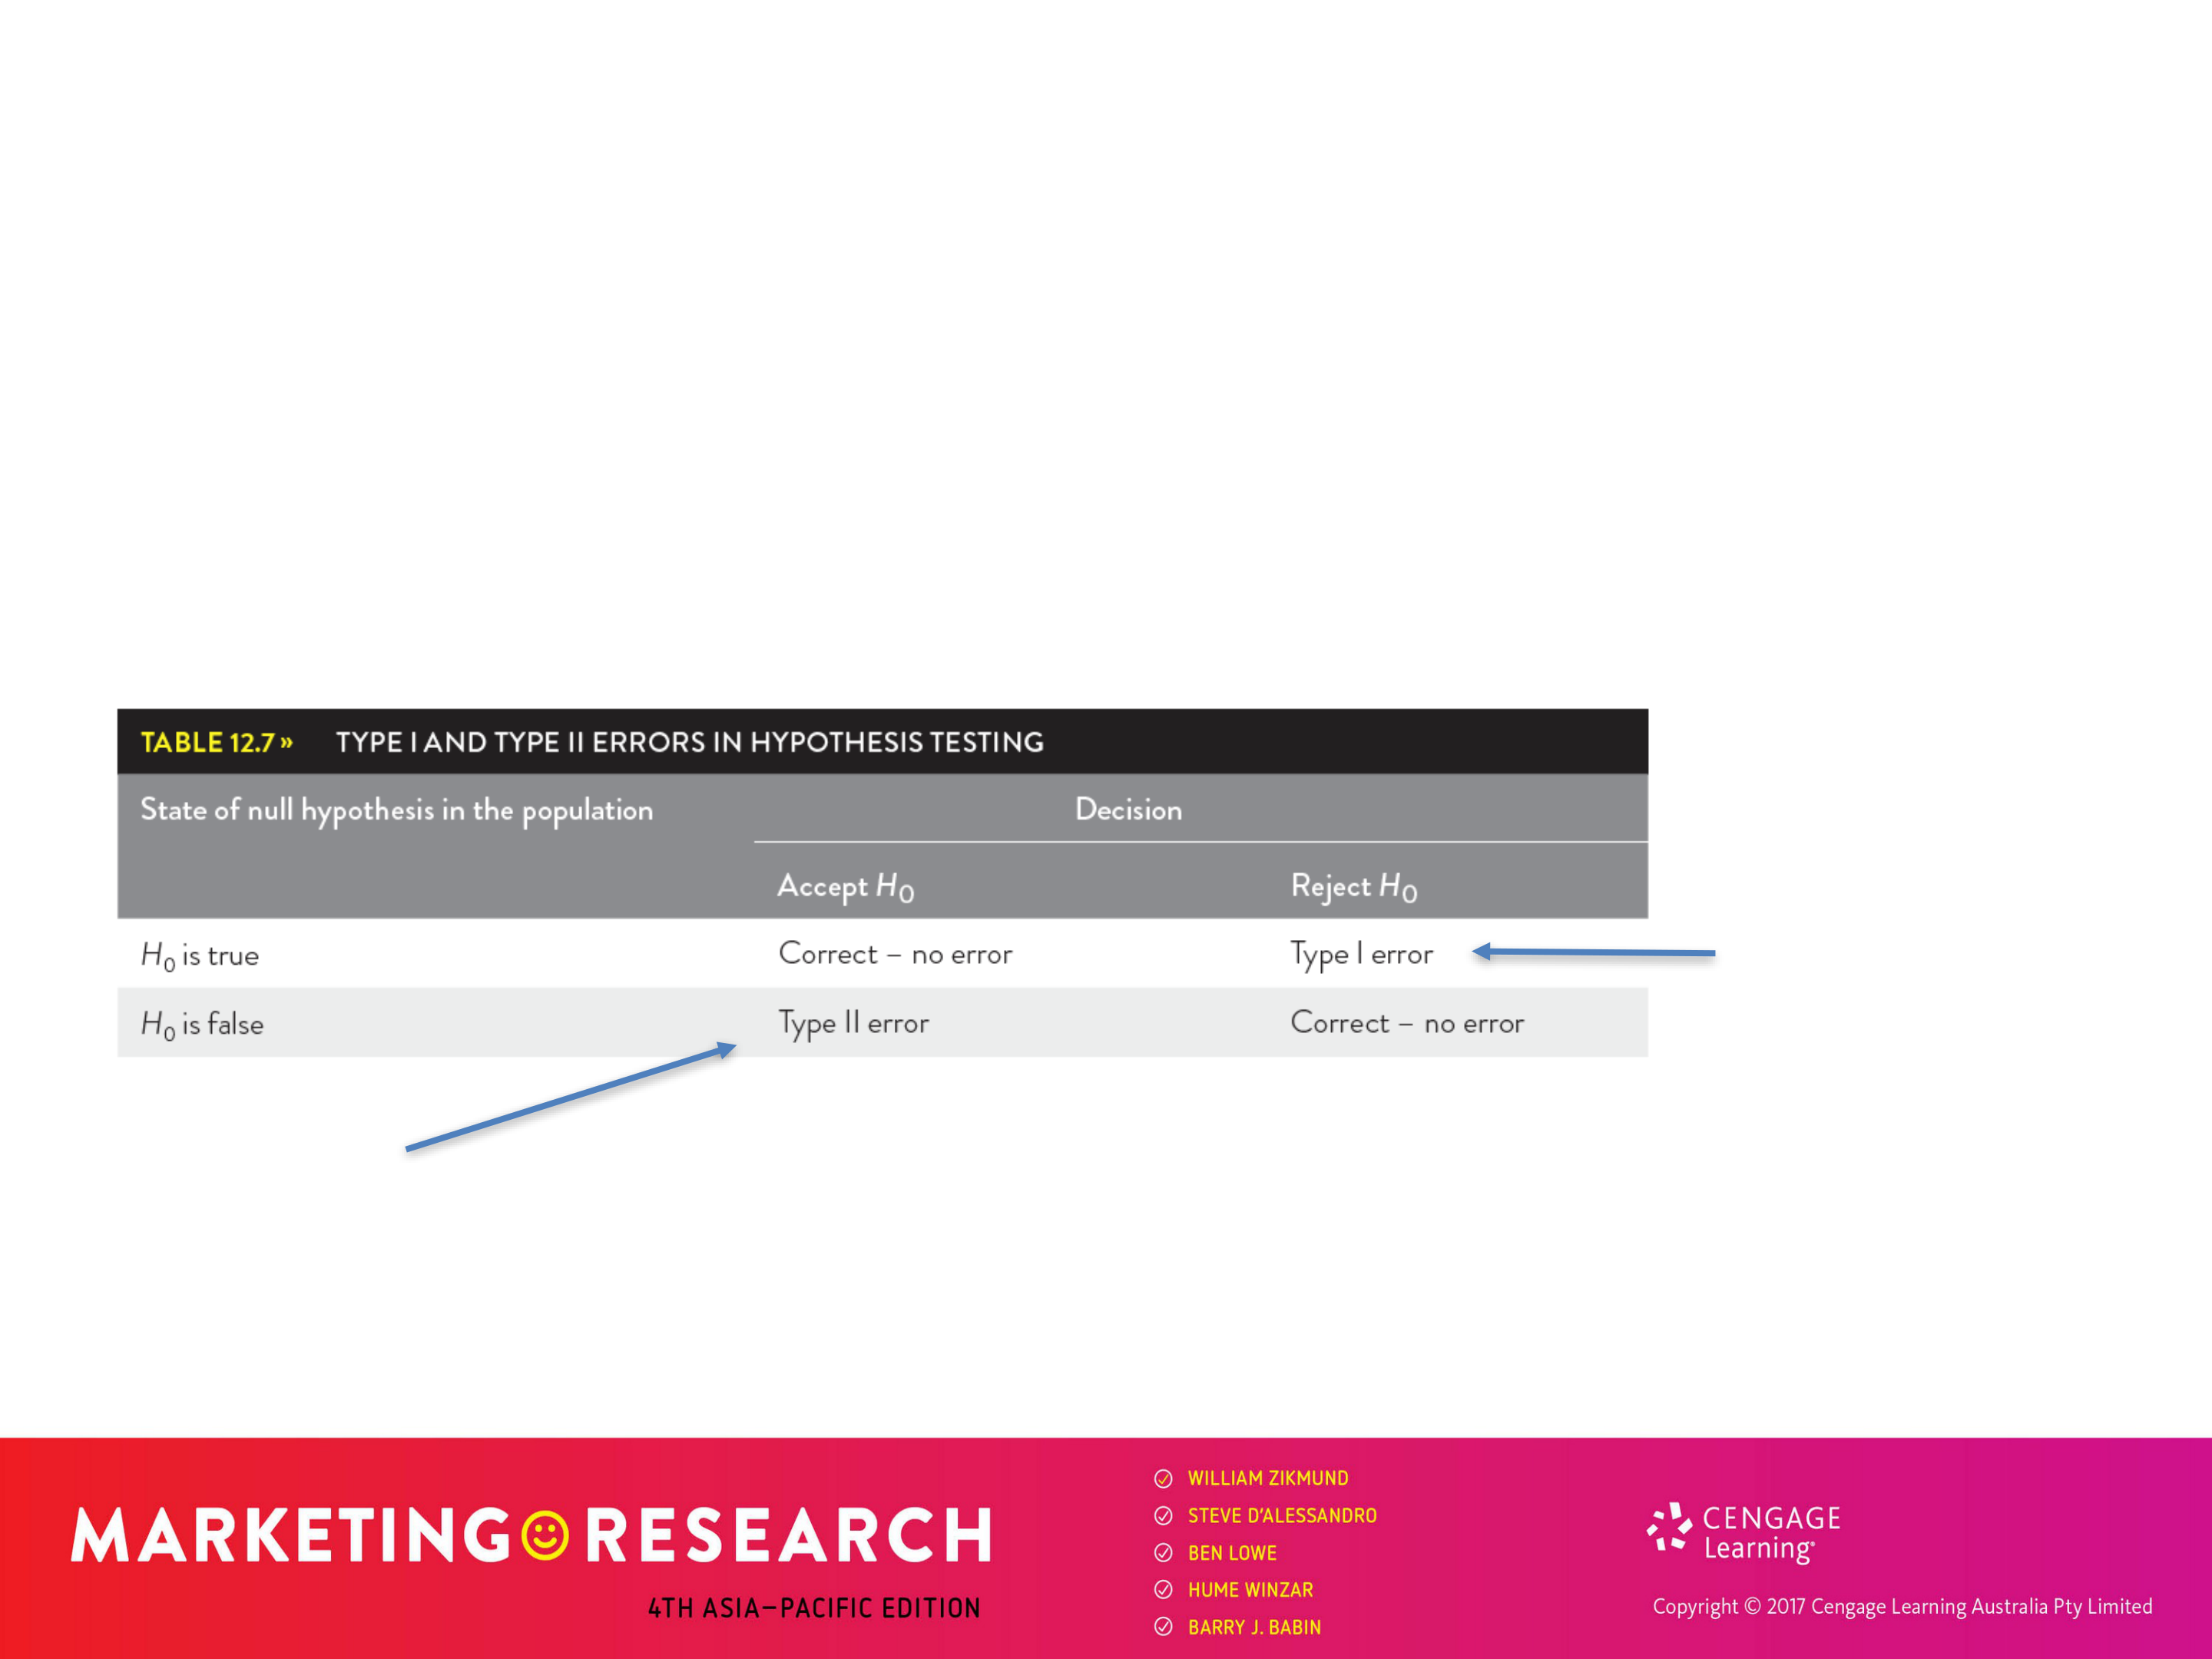

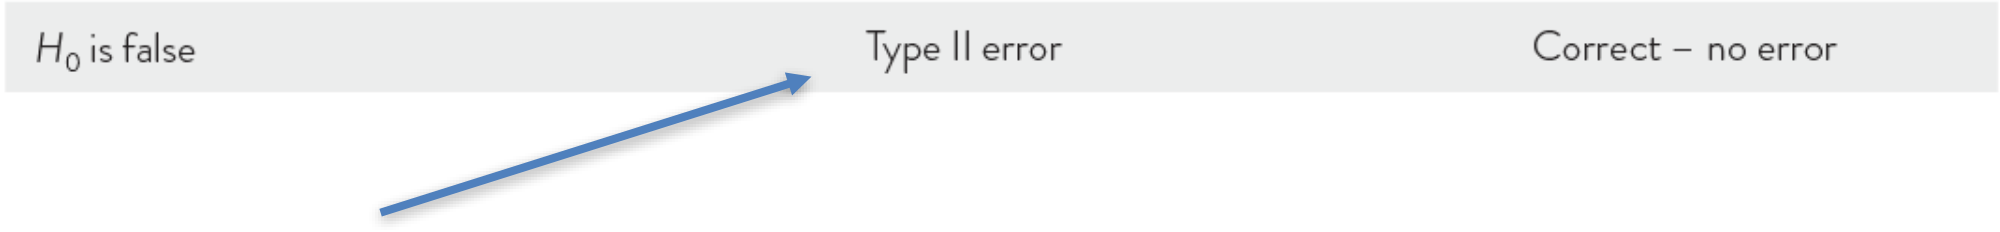
TYPE I VERSUS TYPE II ERROR
hypothesis?
BE COMFORTABLE WITH THE ANALYSES IN THE THREE
CAMTASIA VIDEOS
CAN YOU IDENTIFY IF A RELATIONSHIP IS STATISTICALLY SIGNIFICANT? WHAT IS THIS “ .05” FIGURE ALL ABOUT?Don’t immediately assume “research facts” are
correct. For example, do not quantify results from small samples… And many studies are done poorly…And be careful with what is called “fake news”, or what some unscrupulous politicians consider “real news”...
What are some of the arguments for and against having a neutral point on a scale, as one would have in a 5-point Likert scale?
Develop a Likert scale to assess students’ perception of this course. Now rewrite the question so that it is a semantic differential scale.
Market Research and Analysis
In class group exercise (ch 10 & 12)Suppose you gave a survey to six people and they were asked to respond to a 7-point Likert scale. The values for the six respondents were: 2, 6, 5, 5, 4, 5. What is the mean? What is the mode?
Why wouldn’t the mean from this sample be equal to the true population mean (the average spend on Christmas presents for the entire population)?
How could I describe an interval estimate that I am 95% confident includes the true population mean? Suppose my sample mean is $196 with a standard deviation of $20.

