
And use utc the timezone from the kafka producers task
You need to simulate the streaming data production using Kafka, then show some basic
●Create an Task1_flight_producer.ipynb file for data production
●Create an Task2_flight_consumer.ipynb file for consuming process data
using Kafka
●Create an streaming_application.ipynb file for consuming and processing data using Spark Structured Streaming
1. Producing the streaming data
In this section, you will need to implement an Apache Kafka producer to
simulate the real-time streaming of the data.
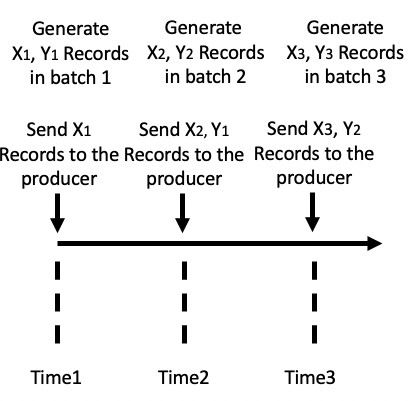
Fig.1. Sequence of data generation in flight-data into stream
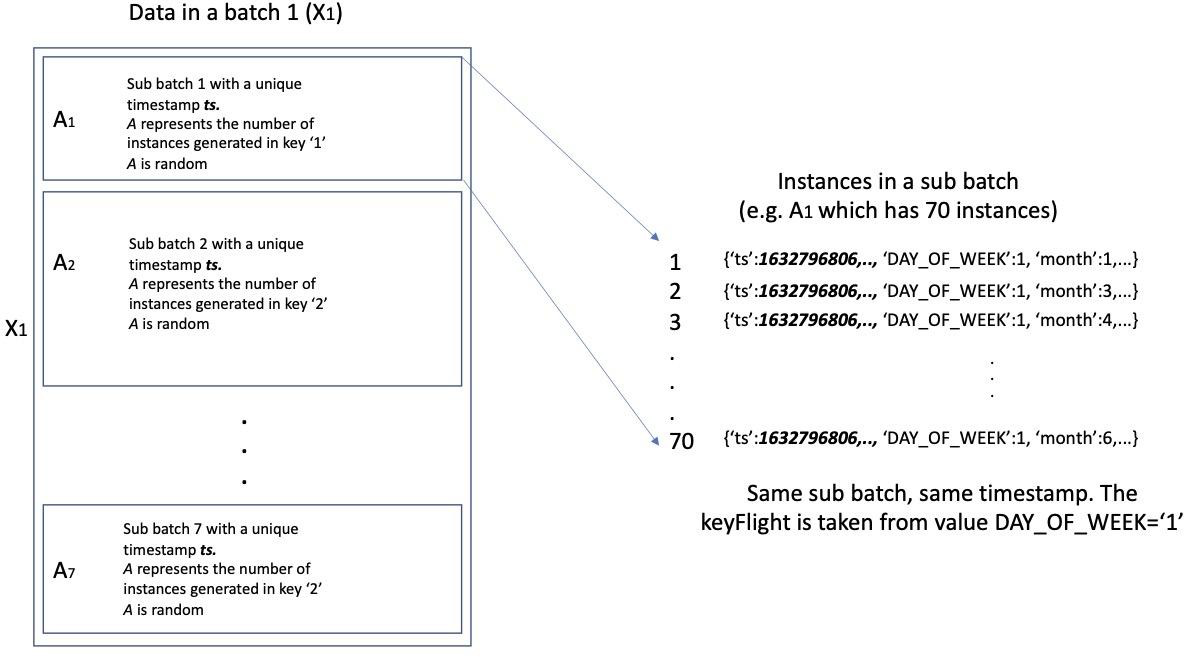
iii. Given random numbers A and B, the number of instances in A1, A2 and B1, B2 and so on vary.
b.Explanation of a dictionary.
| i. | Example of a dictionary with key = ‘1’ |
|---|
‘DAY_OF_WEEK’:7, ‘month’:3,...}
iii. Dictionary is a part of a sub batch data. A sub batch data is a part of a batch data X. This also applies for pending data B.
b.Create a function getFlightRecords, which returns a variable named flightRecords, which is a dictionary that contains all flight data with their associated keys (step 3).
c.Create a topic called ‘flightTopic’
d.Create an instance variable called ‘flightProducer’
e.for each keyFlight in KeyFlights
i. Generate A[‘keyFlight’] and B[‘keyFlight’] and give both the timestamp as formatted in 3.b or Fig.2.
Important:
- In this task, use Kafka consumer to consume the data from task 1.- Do not use Spark in this task
Important:
● You may use Spark Structured Streaming together with Spark SQL
and ML.
● You are also provided with a set of pre-trained pipeline models to classify the binary classification flight-delays (to be provided soon).
4.Persist the transformed streaming data in parquet format for flight data. Flight data should be stored in “flight.parquet” in the same folder of your notebook.
5.Load the machine learning models given, and use the models to classify whether each flight records are delayed. This is based on the assumption that the data has been labelled.
x-axis can be used to represent the timestamp, whereas y-axis can be used to plot the accumMeanAccuracy. For each subplot, the results from all keyFlights (key = ‘1’, key = ‘2’, and key = ‘3’) should be represented in different color legends.