
Czech re-public maths delivers bahlo and terry speed
Maths delivers!
Gene mappingDr Michael Evans AMSI
http://creativecommons.org/licenses/by-nc-nd/3.0/

maths delivers!
Cells, genes and chromosomes
The cell is the basic structural, functional and biological unit of all living things. All or-ganisms are composed of one or more cells and all cells come from preexisting cells. Humans contain trillions of cells. Most plant and animal cells are between 1 and 100 mi-crometres and therefore are visible only under the microscope. The cell was discovered by Robert Hooke in 1665.
Gene mapping ■ 5
mosomes.
Gregor Mendel
An Augustinian friar, Gregor Johann Mendel lived and worked from 1843 in Brno, in the Augustinian Abbey, of which he became the abbot in 1867. At this time Brno was in the Austrian-Hungarian empire. Mendel was known for his activity as a teacher, for his interest in meteorology and in the breeding of bees.
Mendel’s theory shows the power of simple probability models. He collected data for 10
years. His sample sizes were large; he tabulated results from 28,000 pea plants.
of offspring can be obtained in a short amount of time.
• They have some distinct characteristics that are easy to recognize.
• Pea seeds can be either yellow or green and a plant can bear seeds of both colours. (
Mendel introduced the idea of heredity units, which he called factors.The two colours
• He then artificially (that is, by hand) crossed plants of the pure breeding yellow strain with plants of the pure breeding green strain.
- The first generation of these plants, first-generation (F1) hybrids, were all yellow- These first-generation hybrids were then permitted to self cross. Some of the sec- ond generation (F2) were green and some yellow. In fact he found 75 % were yellow and 25 % green.
We discuss the alleles for pea colour in the following subsection of these notes.
A genotype of an individual is the two alleles inherited for a particular gene. The term is also often used to describe an individual’s collection of genes.
There are two different alleles of the seed colour gene that we are concerned with. They will be denoted by y(yellow) and g(green).
So there are four different genotypes:
• g/g produces green.
We note that for y/y and g/g the individual is homozygous and for y/g and g/y the individual is heterozygous.
It is possible to have co-dominant alleles. In this case neither allele is dominant nor recessive with respect to the other allele. We will see an example of this with blood types later in these notes.
Peas yet again
We can ask a simple probability questions at this stage.
1 Plants have factors (genes) that determine the inheritance of each character. Genes are never blended together.
2 One form (allele) of a gene may be dominant over another.
| 4 |
|---|
Mendel also worked with trait of seed shape. The two shape alleles are round (r) and wrinkled (w). Round is dominant over wrinkled and yellow is dominant over green. We will consider the locus with seed colour and the locus with seed shape. The combina-tions in this case are:
yr yw gr g w
These were found to segegate jointly with probabilty 1 4 each. Colour and shape are in-dependent. The punnett diagram can be formed as shown. The phenotypes will be denoted with capital letters in bold and brackets. For example (YR) means the seed is yellow and round.
We can see from this:
|
|---|
Because of the independence of segregation at the two loci we can use
Pr(A ∩B) = Pr(A)Pr(B)
to determine probabilities.b the genotype yyww given that the pea is yellow
c yyxx given that the pea is yellow (Here the xx denotes that any combination of r and w is possible.)
xxrr given that the pea is round (Here the xx denotes that any combination of y and d
g is possible.)12 ■ maths delivers!
c less than 10 seeds being yellow and round.
Hardy-Weinberg Law
P. S. I understand from Mr. Punnett that he has submitted the substance of what I have said above to Mr. Yule, and that the latter would accept it as a satisfactory answer to the difficulty that he raised. The ’stability’ of the particular ratio 1:2:1 is recognized by Professor Karl Pearson (Phil. Trans. Roy. Soc. (A), vol. 203, p. 60).
We assume a large random-mating population. Suppose that at any locus only two al-leles may occur A1 and A2. The corresponding three genotypes are (A1A1), (A1A2) and (A2A2). Suppose that the fractions of the total population of each of these are P, 2Q and R respectively. Furthermore suppose that the numbers are fairly large, and that the
| 1 | Female | ||
|---|---|---|---|
| • |
|
||
• |
|||
The proportion P′of A1A1 of the offspring generation is:
| 3 |
|
||
|---|---|---|---|
|
|||
| R′=1 4(4Q2)+ 1 24QR +R2 = (Q +R)2 | (3) | ||
• Show that Q2= PR
To find the proportions P′′,Q′′and R′′in the third generation we substitute P′,Q′and R′in equations (1), (2) and (3) respectively.
Clearly from this every succeeding generations will have the genotypes (A1A1), (A1A2) and (A2A2) with proportions P′,Q′and R′
(that is the proportions of genotypes stay the same if this condition holds).
Gene mapping ■ 15 Proof
First assume
| P = (P +Q)2 | (4) | |
|---|---|---|
| Q = (P +Q)(Q +R) | (6) | |
| R = (Q +R)2 |
Q= P +Q Q +R
PR
Theorem (Hardy-Weinberg)
Under the assumptions stated, a population having genotypic frequencies
16 ■ maths delivers!
genotype doesn’t improve the chance of surviving.
Exercise 4
You have sampled a population in which you know that the percentage of the heterzy-gous genotype A1A2 is 18 %. Using that 18 % and assuming Hardy-Weinberg conditions, calculate an estimate of the following:
d The proportion of the A2A2 genotype.
Human blood types
There are four possible phenotypes:A,B, AB and O.
In the table below the 6 genotypes and the associated phenotypes are given.
| Phenotype | Genotype |
|---|---|
| A | IAIAor IAIO |
| B | IBIBor IBIO |
| AB | IAIB |
| O | IOIO |
18 ■ maths delivers!
mother will produce children who are either blood type A or blood type B .None of the children will be of blood type O.
Assume Hardy Weinberg conditions in the following. In a given population, only the IAand IBalleles are present in the ABO system; there are no individuals with type O blood or with IOalleles in this particular population. If 200 people have type A blood, 75 have type AB blood, and 25 have type B blood, what are the alleleic frequencies of this population?
The Hardy Weinberg theorem can be extended to three alleles and in particular to blood. The genotypes are IAIA,IAIB,IAIO,IBIB,IBIO,IOIO. In this case we can use the expan-sion
(p1 + p2 + p3)2= p2 1+ p2 2+ p2 3+2p1p2 +2p1p3 +2p2p3
Each of the six terms of the expansiom can be associated as a probability with the geno-
| Genotype | Probabilty |
|---|---|
| p2 1 | |
| p2 2 | |
|
p2 3 |
|
2p1p2 |
| 2p1p3 | |
| 2p2p3 |
Exercise 8
| Exercise 9 |
|---|
20 ■ maths delivers!
The first gene controls whether the mouse is brown (agouti) or black. The agouti allele A is dominant. The allele a is non-agouti and is recessive. This genetic locus is known in mouse genetics as the agouti locus. The genotypes for this gene are A/A, A/a and a/a.
The second locus controls whether the mouse is white (albino) or not white. This is known as the albino locus. If the mouse is homozygous (c/c) for the white allele c, at the albino locus, the mouse is always white. The c allele is recessive. If the mouse has only one or no copies of the c allele then the mouse can show whatever colour is be-stowed upon it by the other coat colour locus in the mouse genome. ( The genome is the entirety of an organism’s hereditary information.) The allele C is non-white and is dominant. The genotypes for this gene are c/c,c/C,and C/C.
The x in the notation xxcc indicates that it doesn’t matter what allele is in that position, the resulting phenotype is determined by cc at the albino locus. Similarly aaCx indicates that the mouse will be black. The last two alleles can be CC or Cc.
The figure below illustrates the mating of a black (aaCC) male mouse with an female Albino (AAcc) female mouse. These are termed ’parents’.The C57/B16 × NOD label in-dicates the two strains of mice involved in the mating. The result of this mating is the F1 generation which is all agouti aACc.
| F2s:! |
|
|||||
| 9 (9.02)! |
|
|
||||
| AxCx! | ||||||
For the F2 generation we have the theoretical ratios of Agouti : Black : Albino = 9 : 3 : 4 (see the Punnet diagram below). An experimental ratio was found to be 9.02 : 3.37 : 3.61.
The punnet diagram below is for the two loci being considered. It shows the resulting phenotypes by shading and the theoretical ratios can be deduced.
of
a of an albino mouse occuring.
Twenty mice from the F2 generation are selected at random. Find the probability of ob-
taining
What is a Gene map
Gene mapping is the process of establishing the locations of genes on the chromosomes.
A major problem with Mendel’s theory was his law of independent segregation of alleles at two or more loci. As mentioned earlier this does not always happen. A measurement of how wrong it was led to the ability to map out exactly where on the chromosome each of its genes might lie.
Consider a double heterozygous father who has genotype a1b1 at locus 1 and genotype a2b2 at locus 2. If he obtained the pairs a1a2 from one parent and b1b2 from the other, we call these parental pairs and the other two a1b2 and a2b1 are called recombinant pairs.
Meiosis
Meiosis is a complex process, but there are only a few features of it we need to know. First, although a father (and mother) passes on to every one of his offspring a copy of each non-sex chromosome and a sex chromosome, these copies are only rarely (perhaps never) precise copies of one of those he received from his (her) parents. Each chromo-some passed on by a father in a sperm cell to one of his offspring is a mosaic of his two parental chromosomes, the result of a random process that takes place during meiosis. This random process is repeated independently for each chromosome. The same is the case for mothers and egg cells, although there are important differences in detail that need not concern us here. The mosaic chromosome 1 (for example) that a father passes on to his offspring results from a process whereby his two chromosome 1s are aligned alongside each other and replicated, so that there are now 4 versions of chromosome 1-two copies of his paternal chromosome 1 bundled together and two copies of his mater-
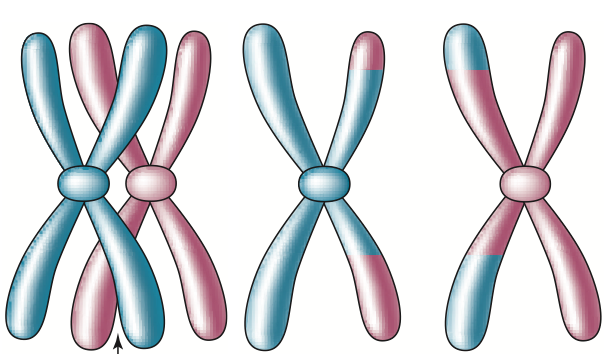
At the end of this process, there are now four versions of chromosome 1- two that were inherited from a parent (called the parental) and two that are a combination of paternal and maternal alleles (called recombinations). These four versions of chromosome 1 now separate, and each is passed to a sperm cell. Thus, a sperm cell might contain a parental or a recombination version of chromosome 1. The positions of the break points are ’ran-dom,’ and this entire process appears to take place independently for the different chro-mosomes. With this background, we can now begin to understand the meaning of the
For two loci that independently segregate r =1 2. This happens if the loci of genes are a long way apart on the same chrosome or are on different chromosomes.
The table below gives the two way tables of their genotypes, where we use the symbols A, B, and H for the genotypes at both loci. Here:
Gene mapping ■ 27
Locus 2
| Locus 1 |
|---|
the following table.
Male
28 ■ maths delivers!
Three of the summations are done here and the remaining summations are left to the reader.
combination is and a1a2 and b1b2 or b1b2 and a1a2 or a1b2 and b1a2 or b1a2 and a1b2 leading to a combined probability of
The multinomial distribution function gives:
|
129! | �(1−r)2 | �26 | �10 | �r 2 | �0 | �(1−r)2 | �23 | |
|---|---|---|---|---|---|---|---|---|---|
| 26!×10!×0!×···×5!×23! |
|
||||||||
| For r =1 |
|||||||||
Locus 1
| L(r) = | �(1−r)2 | �26 | × | �2r(1−r) | �10 | × | �r 2 | �0 | ×·× | �(1−r)2 |
|---|
This expression is called the lilelihood function, L(r) .
We are interested in the value of r for which the observed data recorded in the table above is most likely to occur. To do this we maximise L(r) with respect to r.
Linkage groups
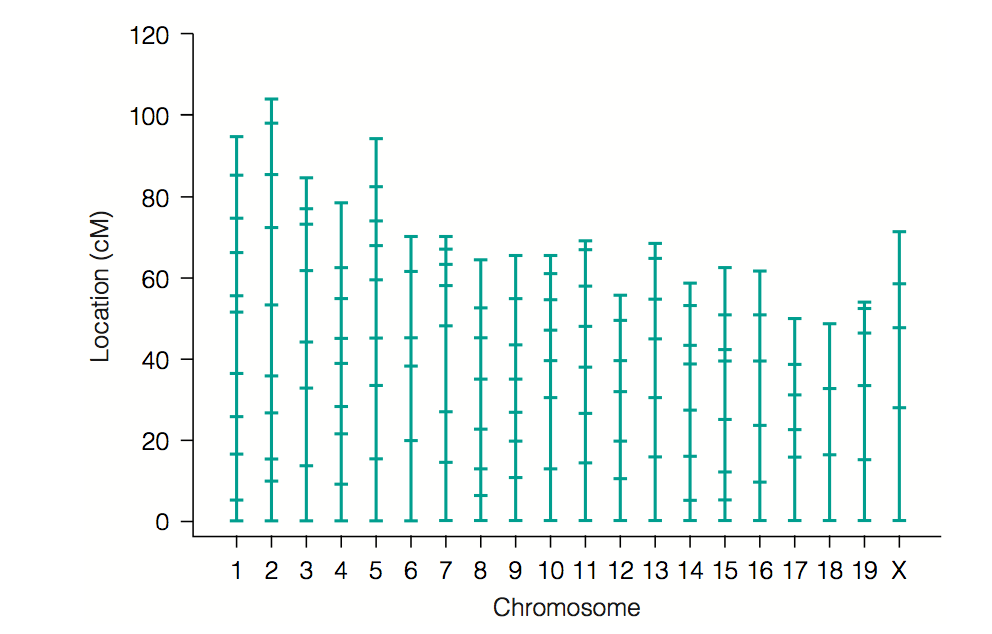
We recall that a marker is a DNA sequence with a known physical location on a chro-mosome. In our case there are 156 markers. Concerning the use of the LOD function I directly quote from Bahlo and Speed. ’Normal statistical practice would have us de-termine a cutoff for the test that would limit the chance of a type 1 error under the null hypothesis, that is, the chance of rejecting the hypothesis that r =1
2when it is in fact correct. This practice is rarely adopted in genetics, where tradition there dictates the use of more stringent thresholds that take into account the multiple testing common with linkage mapping. In genetics, we rarely carry out a single test of the kind just de-scribed; rather, many similar tests are conducted with the same data, some of which are correlated, and so new methods for controlling the overall error rate have evolved. For example, to create a genetic map of markers from a cross like ours, we would begin by computing all pairwise recombination fractions and the associated LOD scores. In our case, this would be156×155 2 = 12,090 calculations. We would then set a LOD cutoff, for example, 3, and a recombination fraction cut-off, for example 0.3, and declare as linked any pair of markers whose recombination fraction was less than 0.3 and whose LOD ex-ceeds 3, or is connected by a sequences of marker pairs each satisfying this threshold.
Mapping the albino trait
| Coat |
|
||||
|---|---|---|---|---|---|
|
Chromosome 2
| Coat |
|
||||
|---|---|---|---|---|---|
|
Here is the table introduced on page 24
| Locus 2 |
|---|
| Coat |
|
||||
|---|---|---|---|---|---|
|
For Chromosome 7 we have the following likelihood function Each value of r results in a
2. � 10�59
1. � 10�59
corresponding value of the LOD function is 24.0879.
In our present context, with 152 markers, what is known as a genomewide scan was car-
34 ■ maths delivers!
Answers to exercises
|
|---|
| p = 0.1 | or |
|---|
The proportion of allele A1 is 0.1 or 0.9.
Gene mapping ■ 35
Probability of type O blood is 1
4
| =5 24 |
|---|
Exercise 7
36 ■ maths delivers!
Exercise 8
p2 1+2p1p3 = 0.378 (1)
From (1) p1 ≈ 0.2417
From (2) p2 ≈ 0.0985
| Blood Type | O | A | B | AB |
|---|---|---|---|---|
| Frequency | 0.441 | 0.435 | 0.090 | 0.034 |
p2 2+2p2p3 = 0.09 (2)
2p1p2 = 0.034 (3)
b The probabability of albino or agouti = 13 16.
Gene mapping ■ 37
http://www.mendelweb.org
MendelWeb is an educational resource for teachers and students interested in the ori-gins of classical genetics, introductory data analysis, elementary plant science, and the history and literature of science. Constructed around Gregor Mendel’s 1865 paper "Ver-suche uber Pflanzen-Hybriden" and a revised version of the English translation by C.T.
Masaryk University Mendel Museum Augustinian Abbey in Old Brno, Brno, Czech Re-public
38 ■ maths delivers!
| 0 | 1 | 2 | 3 | 4 | 5 | 6 | 7 | 8 | 9 | 10 | 11 |
|
|---|