
Data str unlist data corpus documenttermmatrix data rownames
LifeCycleSavings <- na.omit(LifeCycleSavings)
str(LifeCycleSavings)
Code:
qbrk_pop = quantile(LifeCycleSavings$pop15, na.rm = T, probs = c(0,0.2,0.8,1))
LifeCycleSavings$ddpiCat <- cut(LifeCycleSavings$ddpi, breaks = qbrk_ddpi, labels = c("Low", "Medium", "High") )
table(LifeCycleSavings$pop15Cat)
library(ggplot2)
ggplot(data = LifeCycleSavings) + geom_point(aes(pop15Cat,sr, color = ddpiCat))
pain <- c(0,1,2,1,2,2,2,1,1,1,1,0,0,0,1,0,2,2)
pain <- factor(pain, levels = c(0,1,2), labels = c("Low", "Moderate","Severe"), ordered = is.ordered(pain))
If 5 values are missing in the pain column, we have 2 options to deal with it, first is remove the missing column if the dataset rows are much greater, second, replace the missing value with more frequent level.
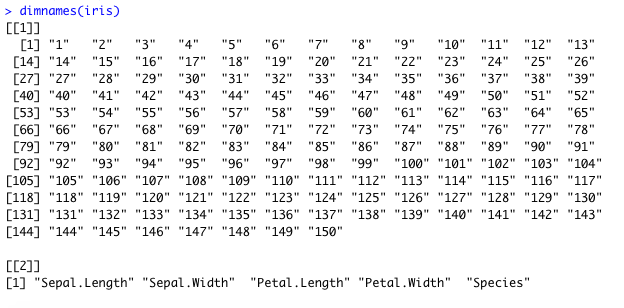
Loading the iris dataset into R,
The output states that there are 150 instances or rows in the dataset and 5 column named "Sepal.Length", "Sepal.Width", "Petal.Length", "Petal.Width" and "Species" in the dataset.
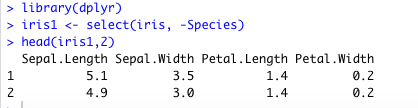
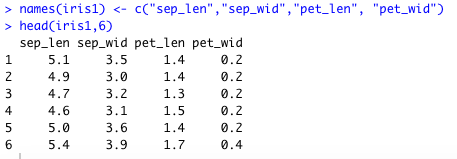
Renaming column names of iris1 dataset,
Proximity analysis:
dissimilarity_coef <- daisy(iris1[1:150,1:4], metric = "gower", stand = FALSE)
dissimilarity_coef
There are 1326 dissimilarity generated for 52th flower,
Code:
Most similar is which is having dissimilarities of 0.009259 and least similar is which is having dissimilarities with 0.764780.
Code:
SECTION C:
Count of missing values in Hb,
missing_val
output:
Total count of missing value is 35.

univariate_imputation
output:
str(data_sec_C)
sel_data <- data_sec_C %>% select(FC,CRP,Hb)
sel_data <- sel_data %>%
select(FC,CRP,Hb) %>%
We can differentiate between univariate and multivariate type of imputation. Multiple imputation (MI) is a sophisticated way to handle missing values. ... This means that one missing value is replaced with more reasonable imputed value in the original dataset. These numbers take account of imputation uncertainty. Interest statistics from each dataset are calculated and then merged into a final dataset. On the other hand, univariate imputation, fulfills the missing values of a vector, matrix or dataset by replacing the missing values. This sample is performed in columns for data frames.
SECTION D:
typeof(mystery_data)
output:
Code:
data$text <- gsub("@\\S*", "", data$text)
data$text <- gsub("[[:punct:]]", "", data$text)
data$text <- tolower(data$text)
data$text <- gsub("[^\x01-\x7F]", "", data$text)
data$text <- gsub("\\w*[0-9]+\\w*\\s*", "", data$text)
dtm<- DocumentTermMatrix(x)
inspect(dtm[255:300,1:5])
wordsum=as.matrix(colSums(data.dtm2[,-1]))
df <- as.data.frame(cbind(term = rownames(wordsum), wordsum))
barplot(c(words$V2),names.arg = c(words$term), xlab = "words", ylab = "Count(Frequency)", col = "red")
Output:
library("lattice")
levelplot(cosine_dist_mat)