
Erdem ozturk and dominik flum mikel armendia
Twin-Control
Mikel Armendia • Mani Ghassempouri
Tools Lifecycle
 123
123
Flavien Peysson
Predict
Six-Fours-les-Plages, France
The images or other third party material in this book are included in the book’s Creative Commons license, unless indicated otherwise in a credit line to the material. If material is not included in the book’s Creative Commons license and your intended use is not permitted by statutory regulation or exceeds the permitted use, you will need to obtain permission directly from the copyright holder.
This work is subject to copyright. All commercial rights are reserved by the author(s), whether the whole or part of the material is concerned, specifically the rights of translation, reprinting, reuse of illustrations, recitation, broadcasting, reproduction on microfilms or in any other physical way, and transmission or information storage and retrieval, electronic adaptation, computer software, or by similar or dissimilar methodology now known or hereafter developed. Regarding these commercial rights a non-exclusive license has been granted to the publisher.
Recent digitalization developments and the ever-increasing global competitiveness have made the utilization of virtual simulation tools and the collaboration between the physical world and the virtual world a key enabler for quality assurance as well as productivity.
European economy is relying on a strong industrial base. Europe cannot compete with low price and low-quality product due to scarce natural and energy resources as well as ambitious social and environmental goals. European-based industries need to focus on innovation, productivity and resource efficiency criterions to create added value on global markets. The competitive advantage, which is essential for any global player, falls on high value-added goods and services when it comes to the European industry. To maintain the advantage, European industry needs to rely
| on | innovation | and | technological | advancement | as | its | main | source | of |
|---|
vi Foreword
The Twin-Control approach developed in this project was mainly tested and implemented within two of the key industries for European economy: aerospace and automotive. The integrated concept adopted by Twin-Control enhances the necessary collaboration between machine tool builders and part manufacturers to improve the productivity of the manufacturing processes.
Twin-Control project () was kindly funded in H2020 by the European Commission (Grant agreement No. 680725), as part of the Factories of the Future initiative.
The editors of the book would like to thank all authors and industrial partners of Twin-Control project!
| Twin-Control Approach . . . . . . . . . . . . . . . . . . . . . . . . . . . . . . . . . | 23 |
|---|
Frédéric Cugnon, Mani Ghassempouri and Patxi Etxeberria
| Modelling of Machining Processes . . . . . . . . . . . . . . . . . . . . . . . . . | 57 |
|---|
| x | Real Representation of the Machine Tool and Machining | |
|---|---|---|
| Part III |
| Behaviours Indicators of Machine Tools . . . . . . . . . . . . . . . . . . . . . |
|---|
9 Non-intrusive Load Monitoring on Component Level
of a Machine Tool Using a Kalman Filter-Based
Disaggregation Approach . . . . . . . . . . . . . . . . . . . . . . . . . . . . . . . . 155 Johannes Sossenheimer, Thomas Weber, Dominik Flum,
Niklas Panten, Eberhard Abele and Tobias Fuertjes
11 Simulation of Machining Operations Based on the VMT
Concept . . . . . . . . . . . . . . . . . . . . . . . . . . . . . . . . . . . . . . . . . . . . . . 183 Frédéric Cugnon and Jean-Pierre Delsemme
|
||
|---|---|---|
| Performance . . . . . . . . . . . . . . . . . . . . . . . . . . . . . . . . . . . . . . . . . . |
Flavien Peysson, Christophe Mozzati, David Leon, Quentin Lafuste and Jean-Baptiste Leger
| Visualization of Simulated and Measured Process Data . . . . . . . . . |
|---|
Part V From Theory to Practice
15 Twin-Control Evaluation in Industrial Environment:
Aerospace Use Case . . . . . . . . . . . . . . . . . . . . . . . . . . . . . . . . . . . . 237 Mikel Armendia, Mani Ghassempouri, Guillermo Gil, Carlos Mozas,
Jose A. Sanchez, Frédéric Cugnon, Luke Berglind, Flavien Peysson
and Tobias Fuertjes
Conclusions and Next Steps . . . . . . . . . . . . . . . . . . . . . . . . . . . . . . . . . . . . 295
Abbreviations
CAM Computer-aided manufacturing
CAN Controller Area Network
CPS Cyber-physical system
CSV Comma separated value
FEA Finite element analysis
FFT Fast Fourier transform
HMI Human–machine interface
HP High pressure
KER Key exploitable results
KPI Key performance indicators
| xiv | ||
|---|---|---|
| LAN | ||
| MBS | ||
| MDA |
|
|
| MES |
|
|
| MT | ||
| MVC | ||
| NC | ||
| NILM | ||
| O&M |
|
|
| OEE |
|
|
| OPC-UA | Open Platform Communications—unified architecture | |
| PC | ||
| PHM | ||
| PLC | ||
| RMS | ||
| RUL |
|
|
| SCADA |
|
|
| SMS | ||
| SOA | ||
| SoU | ||
| SRM | ||
| STL |
|
|
| TCP |
|
|
| TWE | ||
| VMT |
Twin-Control project has developed ICT applications in the field of machine tool industry. Project developments have been split into two main workflows. Firstly, different simulation models were developed with the aim to create a digital twin of the machine tool. Secondly, a data monitoring and management infrastructure were defined and implemented in several use cases (industrial and research envi-ronments). These two workflows have, then, been combined to implement model-based control features in the form of cyber-physical systems. One of the highlights of Twin-Control project is the complete industrial validation stage, consisting in two scenarios from the most demanding industrials sectors: aerospace and automotive.
The structure of this book is based on the one applied in Twin-Control project. The book is separated into five main parts that are composed of several chapters. Each chapter deals with an independent feature developed in the project and begins with an abstract which briefly describes its contents. At the end of each chapter, the conclusions and future steps related to the presented feature are presented. Finally, related references are presented to allow further study of the subjects.
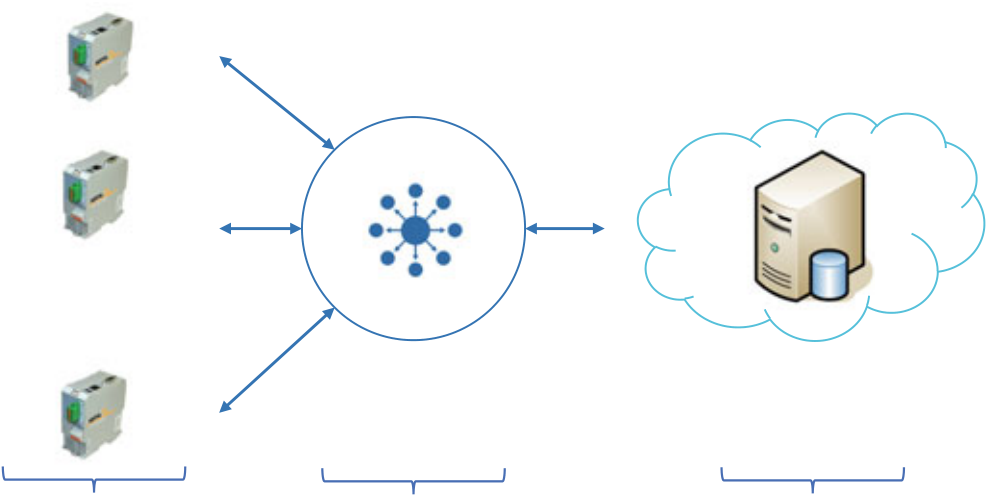
xvi Introduction
infrastructure basically consists of a local monitoring system that uploads data to a cloud-based data management platform where data is managed at fleet level. Secondly, two different chapters dealing with the application of energy monitoring capabilities are presented.
Mikel Armendia
Mani Ghassempouri
Erdem Ozturk
Flavien PeyssonPart I
Introduction
Europe is the world’s largest manufacturer of machine tools, but this position is threatened by the emergence of Asian countries. However, Europe has world-class capabilities in the manufacture of high-value parts for such competitive sectors like aerospace and automotive , and this has led to the creation of a high-technology, and
M. Armendia (B) · A. Alzaga IK4-Tekniker, C/Iñaki Goenaga, 5, 20600 Eibar, Gipuzkoa, Spain e-mail:
E. Ozturk
AMRC with Boeing, The University of Sheffield, Wallis Way, Catcliffe, Rotherham S60 5TZ, UK e-mail: kD. Flum
PTW TU, Darmstadt, Germany
e-mail: e
This cyber twin, better known as digital twin, is a digitalization of the machine tool. Some partial versions of this virtual representation of the machine are currently well known by machine tool builders, like computer-aided design (CAD), computer-aided manufacturing (CAM) and finite element modelling (FEM). These tools are very useful to optimize machine tool designs and reduce design and mechanical set-up stages. However, most available software packages deal with isolated features of the machine tools and/or manufacturing processes, and a lack of integration of the different key features exists [5]. In the last years, a new application of the digital twin has been spreading, called “virtual commissioning” [6, 7]. In this case, a virtual representation of the machine is used to design, program and validate the controller.
Another key principle of Industry 4.0 is to increase the knowledge of the process obtained through monitoring [8]. This knowledge can be applied, for example, for process control [9], maintenance actions optimization [10] and even to create digital twins. The combination of models and process monitoring will be useful not only in the development and design stages, but mainly during the production stage to check that production is running smoothly, detect wear and tear without needing to halt production or predict component failure and other disruptions.
Fig. 1.1 Increase of the overall equipment efficiency (OEE) in the different stages of the life cycle of a process
1.2 Machine Tool Digital Twin
– Digital twins can be also used to improve health monitoring capacities. Simulation models can be used to determine nominal conditions of the studied systems and, hence, improve the detection of anomalous performance [15].
6 M. Armendia et al.
For surface roughness prediction, Biermann [18] and Breitensprecher [19] pre-sented surface texture predictions using time domain models which correlate well with experimental measurements for specific processes. Altintas et al. [17] high-lighted the importance of tool/workpiece engagement evaluation along the tool path. This can be done by using various approaches (voxel, dexel, CSG, B-rep geometries, etc.).
The accuracy of virtual machining is directly related to the identification of the engagement conditions. However, there must be a trade-off between accuracy of engagement predictions and simulation times that is acceptable by the industry. Fur-ther research is needed to improve both the accuracy and computational efficiency of tool/workpiece engagement conditions.
| 1 | 7 |
|---|
Depending on the spindle used in the machine tool, nonlinear behaviour of the spindle may lead to inaccuracies in stability predictions. For example, Ozturk et al. [26] demonstrated the effect of including the effect variable preload in stability of a milling operation. Hence, such potential effects need to be included in stability predictions for improved accuracy.
1.2.2 Virtual Machine Tool
8 M. Armendia et al.
Even though simple energy optimization measures of machines tool are usually prof-itablewithinatimeperiodof twoyears [45], energyefficiencyininvestment decisions usually attracts minor interest due to a multitude of reasons. In the car manufactur-ing industry, some companies (BMW, Daimler) included energy efficiency criteria in the machine tool specification sheet during machine acquisition but, based on a
10 M. Armendia et al.
Numerous methods and tools can be used to predict the end of life of machine tool components [54]. These methods can be classified into two principal approaches: model-based prognostics (also called physics of failure prognostics) and data-driven prognostics. Model-based prognostics [55] deals with the prediction of the end of life of critical physical components by using mathematical or physical models of the degradation phenomenon (crack by fatigue, wear, corrosion, etc.). The main advan-tage of model-based approaches is their ability to incorporate physical understand-
| 1 | 11 | ||||
|---|---|---|---|---|---|
| NETWORK | ANALYTICS | ||||
| Cloud pla�orm | Fleet Management System | ||||
| machines | |||||
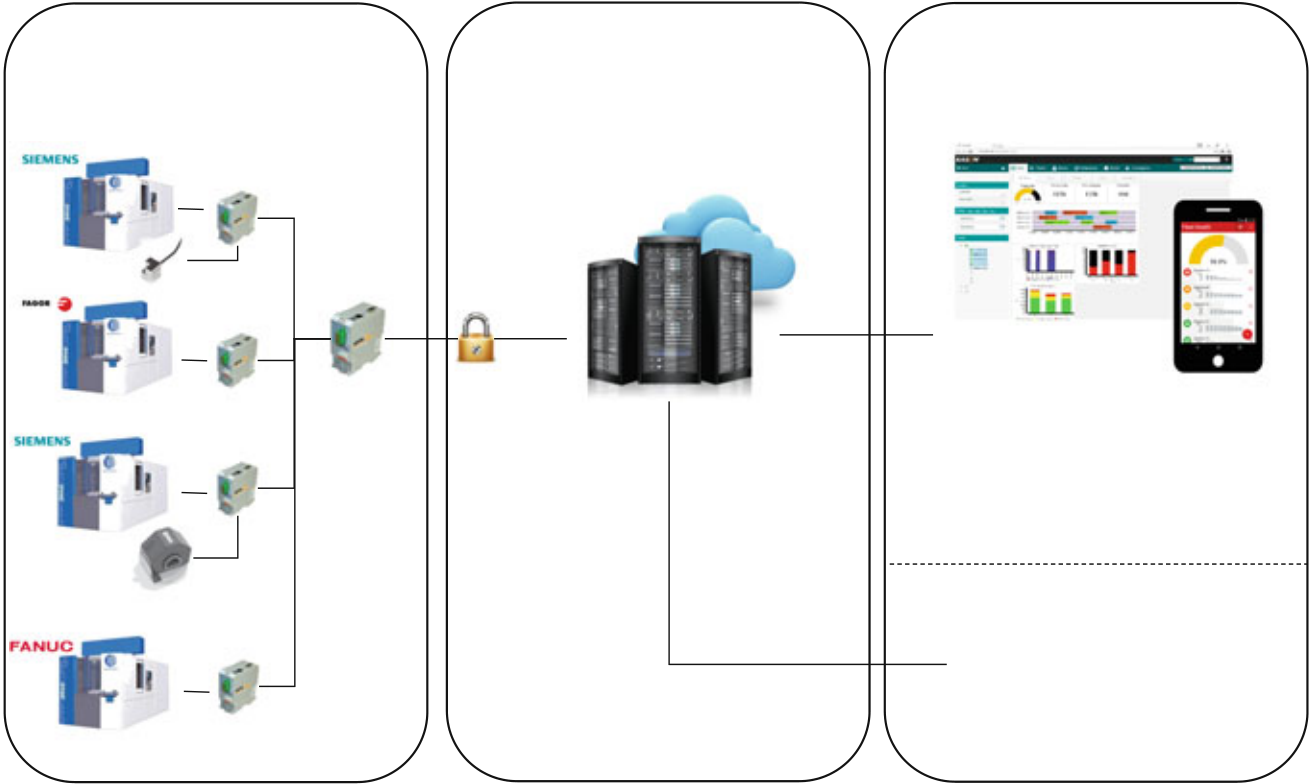
Fig. 1.4 Overview of a typical data monitoring and management architecture
| 12 |
|
|
|---|---|---|
| 1.3.1 |
Machine tool and process monitoring systems in general must deal with the two fields of data acquisition and data processing. The selection of the sensors for data acquisition is dependent on the type of machine tool, mounting options, process influences, signal amplitudes and process disturbances. They can be classified into three types:
There exists a wide variety of monitoring hardware to collect this data. This hardware provides high connectivity features (Ethernet, CANOpen, Profibus, etc.) and, in some cases, the integration of some intelligence in the system and even the feedback to the machine controller.
Kaever [65] classified the state of the art of local process monitoring strategies into two categories. The strategies of the first category rely on a teach-in phase in which tolerances or characteristic values for the individual process are determined. The strategies of the second category do not have the possibility to access to teach-in data which is the case of single-piece production. Current research trends in the context of process monitoring focus on the integration of machine positions into the monitoring or even to use process simulation approaches. In [66], Klocke, Kratz and Veselovac presented a position-oriented monitoring by utilising all position encoder signals from a 5-axis milling machine for an in-depth analysis of a freeform milling operation. In [59], Yohannes presented a monitoring strategy based on a material removal simulation. By integrating a simulation into the monitoring, the teach-in phase can be eliminated.
Several services are defined in the specification. The main service is data access that describes data flow of values such as sensor signals. There are also services transmitting alarms, history data, aggregates or programs. All these services are using a structured information model that can be expanded to describe complex data.
Transport can be made using binary streams or HTTP requests. Security uses standard TLS protocol, using public key infrastructure (PKI) with certificates, for signature and encryption and authentication.
Big data is defined as data where one or more of the following characteristics are high: volume, velocity, variety. Machine tool industry encounters big data in the following sense: firstly, machine tools produce data of high rate such as axes movements that must be acquired with millisecond precision. Secondly, machine tools related data has a variety of types, such as time series, spectral data, production data, and quality control data. Finally, data volume generated by a machine tool has a considerable daily volume. Each machine can generate several gigabytes of data per day.
| 1 |
|
15 |
|---|
Fleet-wide diagnosis, prognostic and knowledge management has gained signif-icant interest across different industries and is at different maturity level depending on the industry. Sensory data is becoming more and more accessible from supervi-sory control and/or low-cost embedded acquisition system that drives the need of more advanced, structured data management strategy [70]. As a result, several fleet-management systems have been developed in military, energy and mining sectors. In most of those systems, the fleet concept mainly addresses only centralized and remote access to “n” system (individually). Even if a large amount of data can be managed, they are lacking enough structuring in order to benefit from the knowl-edge arising from the fleet dimension. Moreover, the data processing in such system is rather limited where aggregated synthesis and comparison of “n” systems is not addressed.
1.4 Cyber-Physical Systems in Machine Tools
Cyber-physical system (CPS) is a term supported by important initiatives, like indus-try 4.0 [3], that is gaining relevance in the manufacturing community. Although sev-eral interpretations of CPSs exist, they can be defined as physical and engineered systems whose operations are monitored, coordinated, controlled and integrated by a computing and communication core [1]. Cyber-physical systems are considered as one of the main enablers for flexibility and productivity in manufacturing processes in the future [74].
EU-funded MC-Suite project presents relevant developments in the field of CPS application in Machine Tools. Mancisidor et al. [77] present an active damper system to suppress chatter effects during machining. In addition, Beudaert et al. [78] devel-oped a chip breaking system to control chip length and, hence, make the automation of the processes possible.
Another example of the application of CPSs in machine tools is the intelligent fixtures. Möhring et al. [79] present an overview of the work done in this field within the EU project INTEFIX. Fixtures provided by sensors and actuators that were able to adapt to the workpieces and process have been developed in this project. For example, Gonzalo et al. [80] presented an intelligent fixture for turning low pressure turbine castings. This fixture was provided with special actuators which apply forces in specific areas of the workpiece to modify its dynamic behaviour to reduce vibrations.
control the machining processes, with feedback loops in which machining processes can affect computations and vice versa (Fig. 1.6).
1.5 Conclusions
1. Rajkumar, R., Lee, I., Sha, L., Stankovic, J.: Cyber-physical systems: the next computing revolution. In: 47th ACM/IEEE, Design Automation Conference (DAC), Anaheim, CA, USA (2010)
2. Dervojeda, K., Rouwmaat, E., Probst, L., Frideres, L.: Internet of Things: Smart machines and tools. Report of the Business Innovation Observatory for the European Commission 3. Kagermann, H., Wahlster, W.: Recommendations for Implementing the strategic initiative INDUSTRIE 4.0. Final Report of the Industrie 4.0 Working Group
4. Liu, C., Xu, X.: Cyber-physical machine tool—the Era of Machine Tool 4.0. In: The 50th CIRP Conference on Manufacturing Systems. Taichung, Taiwan (2017)
5. Abdul-Kadir, A., Xu, X., Hämmerle, E.: Virtual machine tools and virtual machining—a tech- nological review. Robot. Comput.-Integr. Manuf. 27, 494–508 (2011)
6. Hoffmann, P., Maksoud, T. M. A.: Virtual commissioning of manufacturing systems: a review and new approaches for simplification. In: Proceedings 24th European Conference on Mod- elling and Simulation; Kuala Lumpur, Malaysia (2010)
7. Lee, C.G., Park, S.C.: Survey on the virtual commissioning of manufacturing systems. J.
Comput. Des. Eng. 1(3), 213–222 (2014)
8. Lee, J., Bagheri, B., Kao, H.-A.: A cyber-physical systems
architecture for industry 4.0-based manufacturing systems. Manuf. Lett.
3, 18–23 (2015)
9. Denkena, B., Fischer, R., Euhus, D., Neff, T.: Simulation based
process monitoring for sin- gle item production without machine external
sensors. In: 2nd International Conference on System-Integrated
Intelligence: Challenges for Product and Production Engineering,
Procedia Technology, vol. 15, pp. 341–348 (2014)
10. Alzaga, A., Konde, E., Bravo, I., Arana, R., Prado, A., Yurre, C.,
Monnin, M., Medina-Oliva, G.: New technologies to optimize reliability,
operation and maintenance in the use of machine tools. In:
Euro-Maintenance Conference, Helsinki, Finland, 5–8 May 2014
11. Mahmood, K., Otto, T., Shevtshenko, E., Karaulova, T.: Performance
evaluation by using overall equipment effectiveness (OEE): an analyzing
tool. In: International Conference on Innovative Technologies 2016,
Prague
12. Vergniaud, M.: Exemples de Jumeaux Numeriques, Report from the
Centre technique des industries mécaniques (CETIM) (2018)
13. Jerard, R., Fussell, B., Xu, M., & Schuyler, C.: A Testbed for
research on smart machine tools.
| 1 | 19 |
|---|
21.
22.
23.
24.
25.
26. , T.: Investigation of Spindle bearing preload on dynamics and
stability limit in milling. CIRP Ann. Manuf. Technol.
61(1), 343–346 (2012) 27. Altintas, Y., Brecher, C.,
Weck, M., Witt, S.: Virtual machine tool. CIRP Ann. Manuf. Technol.
54(2), 115–138 (2005)
28.
Weule,H.,Albers,A.,Haberkern,A.,Neithardt,W.,Emmrich,D.:Computeraidedoptimisation
of the static and dynamic properties of parallel kinematics. In:
Proceedings of the 3rd Chemnitz Parallel Kinematic Seminar, pp. 527–546
(2002)
29. Weule, H., Fleischer, J., Neithardt, W., Emmrich, D., Just, D.:
Structural optimization of machine tools including the static and
dynamic workspace behavior. In: Proceedings of the 36th CIRP
International Seminar on Manufacturing Systems, Saarbrücken, pp. 269–272
(2003) 30. Fesperman, R.R., Moylanb, S.S., Vogl, G.W., Alkan Donmez, M.:
Reconfigurable data driven virtual machine tool: geometric error
modeling and evaluation. CIRP J. Manufact. Sci. Technol.
20 M. Armendia et al.
49. Heinemann, T., Schraml, P., Thiede, S., Eisele, C., Herrmann, C.,
Abele, E.: Hierarchical evaluation of environmental impacts from
manufacturing system and machine perspective. In: 21st CIRP Conference
on Life Cycle Engineering in Trondheim, pp. 141–146. Norway, 18–20 June
2014
50. Kienzle, O., Victor, H.: Spezifische Schnittkräfte bei der
Metallbearbeitung. Werkstofftechnik und Maschinenbau
47(H5), 224–225 (1957)
51. Schrems, S.: Methode zur modellbasierten Integration des
maschinenbezogenen Energiebe- darfs in die Produktionsplanung:
[Dissertation] (2014)
52. Abele, E., Eberspächer, P., Schraml, P., Schlechtendahl, J., Verl,
A.: A model- and signal-based power consumption monitoring concept for
energetic optimization of machine tools. in: 21st CIRP Conference on
Life Cycle Engineering in Trondheim, pp. 44–49. Norway, 18–20 June
2014
53. Iqbal, S., Croes, J., Al-Bender, F., Pluymers, B., Desmet, W.:
Frictional power loss in solid grease lubricated needle roller bearing.
Lubr. Sci. (2012). 54. Medjaher, K., Tobon-Mejia, D., Zerhouni, N.:
Remainitical
componentswithapplicationtobearings.IEEETrans.Reliab.Inst.Electr.Electron.Eng.(IEEE)
61(2), pp. 292–302 (2012)
55. Heng, A., Tan, A.C., Mathew, J., Montgomery, N., Banjevic, D.,
Jardine, A.K.: Intelli- gent condition-based prediction of machinery
reliability. Mech. Syst. Signal Process. 23(5),
1600–1614 (2009)
56. Dragomir, O.E., Gouriveau, R., Dragomir, F., Minca, E., Zerhouni,
N.: Review of prognostic problem in condition-based maintenance. In:
IFAC and in Collaboration with the IEEE Control Systems Society.
European Control Conference, ECC’09, 2009. Budapest, Hungary 57. Zheng,
B., Xu, J., Li, H., Xing, J., Zhao, H., Liu, G.: Development of remotely
monitoring and control system for siemens 840D sl NC machine tool using
Snap 7 codes. In: 2nd International Conference on Electrical, Automation
and Mechanical Engineering (EAME 2017)
58. Weck, M., Brecher, C.: Werkzeugmaschinen 3 - Mechatronische Systeme,
Vorschubantriebe, Prozessdiagnose. Springer, Berlin (2006)
59. Yohannes, B.: Industrielle Prozessüberwachung für die
Kleinserienfertigung. Dr. -Ing. Diss., Leibniz Universität Hannover,
Berichte aus dem IFW, TEWISS (2013)
60. Chen, J.C., Chen, W.L.: A tool breakage detection system using an
accelerometer sensor. J.
72. Voisin, A., Medina-Oliva, G., Monnin, M., Leger, J-B., Iung, B.: Fleet-wide diagnostic and prognostic assessment. In: Annual Conference of the Prognostics and Health Management Society (2013)
73. Medina-Oliva, G., Voisin, A., Monnin, M., Leger, J.-B.: Predictive diagnosis based on a fleet- wide ontology approach. Knowl.-Based Syst. 68, 40–57 (2014)
74. Medina-Oliva, G., Voisin, A., Monnin, M., Leger, J-B., Iung, B.: Key factor identification for energy consumption analysis. In: 2nd European Conference of the Prognostics and Health Management Society, PHME (2014)
75. Johansson, C-A., Galar, D., Villarejo, R., Monnin, M., Green condition based maintenance-an integrated system approach for health assessment and energy optimization of manufacturing machines. In: International Conference on Condition Monitoring and Machinery Failure Pre- vention Technologies (2013)
76. Reinhart, G., Wittenstein, M., Scholz-Reiter, B., et al. (eds.): Intelligente vernetzung in der fabrik: industrie 4.0 umsetzungsbeispiele für die Praxis. Fraunhofer, Stuttgart (2015) 77. Mancisidor, I., Laka, I., Beudaert, X., Munoa, J.: Design and Validation of an active damping device for chatter suppression on flexible workpieces. In: 5th International Conference on Virtual Machining Process Technology (VMPT 2016) (2016)
78. Beudaert, X., Bediaga, I., Argandoña, J., Loc’h, J., Muñoa, J.: Effects of a chip breaking system using machine drive oscillations. In: IVth International Conference on High Speed Machining—17–18 April 2018, Donostia/San Sebastian-Spain
79. Möhring, H.-C., Wiederkehr, P., Gonzalo, O., Kolar, P.: Intelligent Fixtures for the Manufactur- ing of Low Rigidity Components. Lecture Notes in Production Engineering. Springer, Berlin (2018)
80. Gonzalo, O., Olabarrieta, E., Seara, J.M., Esparta, M., Zamakona, I., Gómez-Korraletxe, M.: Conceptos de Utillaje para la Mejora del Mecanizado de Componentes Aeronáuticos de Baja Rigidez. 20 Congreso de Máquinas-Herramienta y Tecnologías de Fabricación 2015, San sebas- tian, Spain
81. Chen,T.C.,Chang,C.J.,Hung,J.P.,Lee,R.M.,Wang,C.C.:Real-timecompensationforthermal errors of the milling machine. Appl. Sci. 6 (2016)
82. Holub, M., Blecha, P., Bradac, F., Marek, T., Zak, Z.: Geometric errors compensation of CNC machine tool. MM Sci. J. (2016)Open Access This chapter is licensed under the terms of the Creative Commons Attribution 4.0 International License (), which permits use, sharing, adaptation, distributionas long as you give appropriate credit to the original author(s) and the source, provide a link to the Creative Commons license and indicate if changes were made.
Mikel Armendia, Aitor Alzaga, Flavien Peysson and Dirk Euhus
2.1 Introduction
A. Alzaga
e-mail:F. Peysson
PREDICT, Vandoeuvre-lès-Nancy, France
e-mail: r
|
|
|||||
|---|---|---|---|---|---|---|
|
Model | (Fleet) | Cyber world | |||
| Energy | update | |||||
| Reference | Real Machine data | |||||
| data | ||||||
| Performance prediction | Monitored data | Performance prediction | ||||
| Maintenance plan | ||||||
| Records: | ||||||
| Compensation/Control | ||||||
| -Working conditions | ||||||
| -Component condition | ||||||
| DESIGN |
|
|
Manufacturer | |||
Both Physical and Cyber worlds will be interconnected. The Cyber world will make use of real machine tool and process data through all its life cycle. The Digital Twin of the manufacturing system has been created by combining the correspondent theoretical models according to machine tool design and process specifications. Dur-ing part manufacturing, the holistic simulation model can be updated according to machine tool real condition using data obtained through monitoring and additional characterization tests designed for this purpose. This way, the virtual manufacturing system will be able to predict current machine/process performance in an accurate way.
In the same way, the simulation outputs obtained with the new Twin-Control tool will be useful through all machine tool life cycle. In the machine tool design stage, Twin-Control will be an extraordinary tool to predict the performance of pro-jected machine tools. The same occurs with the process design, providing accurate estimation of cycle times and resultant part accuracy allowing a quick optimization procedure. By applying Twin-Control, machine tool and machining process set-up stage will be considerably reduced.
The following pages provide an overview of the Twin-Control concept and its architecture and serve as introduction of the rest of the book, where developments are presented in detail. The first chapter introduces the Twin-Control concept. The second one presents an overview of the technical solution architecture of Twin-Control. Next, one of the highlights of the project, the industrial evaluation of Twin-Control is introduced. Finally, the conclusions are presented.
2.2 Twin-Control Architecture
| Simulation |
|
|
|---|
The core of the developed Digital Twin is a Virtual Machine Tool module based on SAMCEF Mecano [4] finite element (FE) software that is able to integrate the toolpath simulation and process effects (Fig. 2.3). This integration leads to a com-plete understanding of machine tool dynamic performance during real machining processes and will allow the prediction of the most important features like surface roughness and form errors. The integrated process models include features like cut-ting force estimation, stability analysis and even surface roughness estimation. The usage of ModuleWorks libraries provides advanced capabilities for tool-workpiece engagement calculation and also the possibility to visualize process results over workpiece geometry, improving user experience.
By using the results of this Virtual Machine Tool, some complementary features are studied through additional models. This way, energy efficiency of the simulated machine tool and/or process and end-of-life estimations of the most critical elements can be also provided by the developed Digital Twin.
Process
| 2 | 27 |
|---|
The energy efficiency module provides the energy consumption of machine tools. To gain a most wide transparency, the energy consumption is observed on a com-ponent level. This leads to the possibility to design energy efficient machine tools and processes. The Simscape model library to be developed will be the basis for the configurator. The physical input parameters are obtained from data sheets: if detailed characteristic curves are available, they are directly used for simulation; if less information is available, the behaviour will be modelled.
The link with the real world is obtained, in one direction, by the usage of the fleet-level knowledge stored in the cloud for validation (inputs and outputs for the simulations) and, in the other direction, by uploading simplified models or simulated results and parameters to the cloud (“reference” machine values).
Additionally, an ARTIS OPR unit—Offline Process Recorder—will be used and connected via Ethernet to the Genior Modular to store the real-time data capturing and also to receive OPC data in non-real-time as a second data source. The OPR will act as a gateway by pushing real-time and OPC data to the remote or local service hosting the fleet-based database, in this case, KASEM®(Fig. 2.4).
The real-time local data management does not only monitor data, it allows imple-menting some intelligence that can be used to detect anomalous performance or even directly act on the machine controller to optimize its behaviour. For example, ARTIS process monitoring capabilities are used to safeguard production [6]. Spindle torque monitoring on all machines will be used to detect abnormal behaviour during processing. This could be a sudden action in case of tool breakage, delayed stop in
Fig. 2.4 Conceptual diagram of the monitoring architecture used in Twin-Control
the case of tool breakage during tapping operation or tool wear events. Currently, process monitoring is done based on a learning stage and, hence, can be only applied to medium-to-large batch sizes.
| 2 | 29 |
|---|
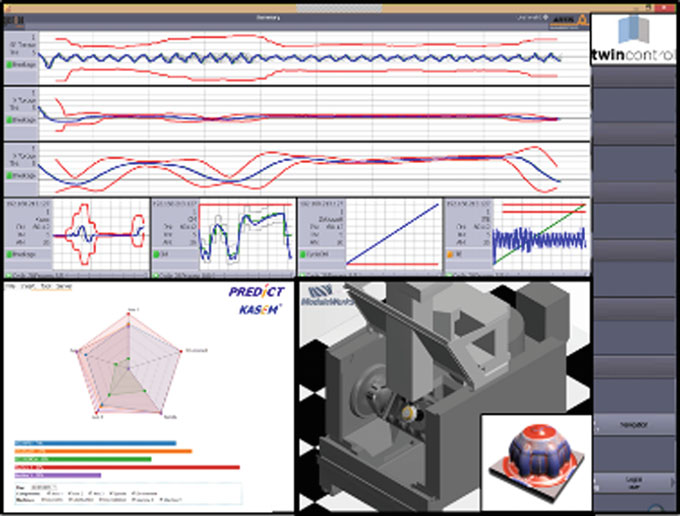
Fig. 2.5 Conceptual design of the ARTIS HMI including Twin-Control PlugIns
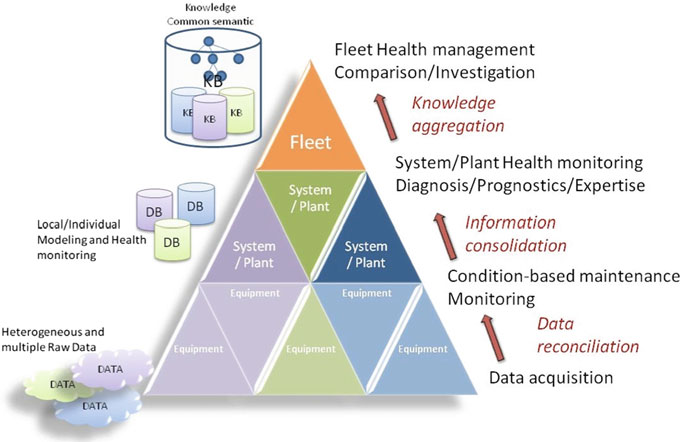
Fig. 2.6 Hierarchical approach of the proactive fleet management [7]
Twin-Control’s fleet platform is in the “cloud”, i.e. on the Internet, and hosted to a predict secure server. Machine tools push data to the server to feed the knowledge base. Details of the proposed monitoring and data management architecture are presented in Sect. 3.1 of this book.
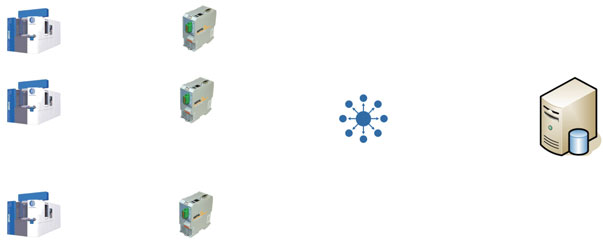


| Machines | Monitoring |
|
|
|---|---|---|---|
| Processing |
– Automatic inputs that are regularly pushed to the fleet platform. The automatic inputs are:
32 M. Armendia et al.
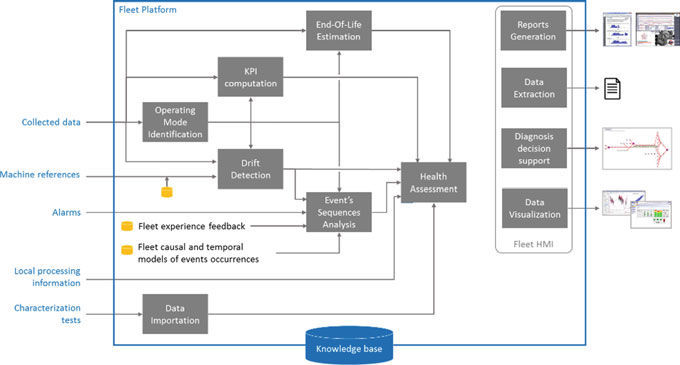
Fleet platform will be powered by the KASEM®platform of predict. KASEM®willalsoprovidegenericandstandardHMIthatcouldbeupdatedtofitprojectrequire-ments. KASEM®is a Web platform with a service-oriented architecture (SOA). Following sub-sections explain main functions deployed in the fleet platform once machine tools knowledge will be formalized.
2.2.3.2 Health Assessment
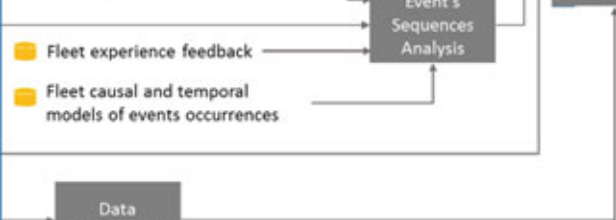
2.2.3.3 Event’s Sequence Analysis
Events include both alarms from local monitoring and alerts from fleet drift detection. This module will oversee the interpretation of event sequences, i.e. the interpretation of frequency and order of the events. Information about event types and the time stamps of their occurrence will be used to analyse the time series data and thus finding dependencies between different alarms. Generic causal models, i.e. models shared by all machines of the fleet, will be used during the analysis. A causal model represents the relationship between the different event types. These causal relationships can be used to recognize an event sequence on a given period. Once the sequence is identified, causal models allow to identify the sequence root cause (diagnosis) but also to know what could be the next event (prognostic) of the sequence.
2.2.3.4 Platform Portal and Outputs
For accessibility, all the functions of the platform are available through a Web por-tal. Results can also be made available directly on site by means of report, for instance, that can be sent (e.g. by mail) to the users and/or displayed on machine local HMI through ARTIS PlugIn. The platform Web portal will provide HMI to support decision-making for diagnosis activities, to visualize knowledge-based information with dynamics dashboards and static reports.
Different demonstrator scenarios have been implemented in two of the key indus-tries for European economy: automotive and aerospace. These two sectors are very dependent on machine tool industry but show several differences with respect to the process types and requirements. Automotive sector typically deals with large batches of moderate cycle-time parts. Current major concerns are (1) to ensure part quality over time, (2) reduction of breakdowns and (3) energy efficiency. In aerospace, smaller batches are usually manufactured, but parts are normally bigger and with a complex geometry. There, new process set-up times and quality requirements are most important concerns.
The different requirements of such important industries have been taken as a reference to determine the Twin-Control concept and architecture. Apart from that, both use cases will be used for the evaluation of the different features of Twin-Control, not only at technical level, but also by studying the impact caused by the features in the end-users. For each automotive and aerospace sector, a tandem of end-users composed by a part manufacturer and one of its machine tool providers will be involved in this industrial validation (Fig. 2.11). Three machines will be monitored on each end-user installation to apply fleet-based knowledge management.
– Scenario of Use 2: Machining process design. Twin-Control process simulation feature provides the chance to optimize process definitions of part manufacturers
36 M. Armendia et al.
– Scenario of Use 4: Maintenance. Fleet knowledge system developed in Twin- Control will lead to a better maintenance strategy for end-users.
– Scenario of Use 5: Quality. The combination of process and quality monitoring leads to a better control of part quality by reducing the amount of time spent in measurements.
| 2 | 37 |
|---|
2.4 Conclusions
Twin-Control () is a new concept for machining process per-formance optiT-related features like Digital Twin, condition monitoring, fleet data management and model-based control. This section presents the concept behind Twin-Control and the proposed architecture, defined after gath-ering requirements from end-users involved in the project. In addition, the industrial evaluation approach is also introduced. In the next chapters of the book, the presented features will be defined in detail.
38 M. Armendia et al.
8. Léger, J-B.: A case study of remote diagnosis and emaintenance information system. Keynote speech of IMS’2004. In: International Conference on Intelligent Maintenance Systems, Arles, France (2004)
9. Prado, A., Alzaga, A., Konde, E., Medina-Oliva, G., Monnin, M., Johansson, C-A., Galar, D., Euhus, D., Burrows, M., Yurre, C.: Health and performances machine tool monitoring architecture. E-maintenance Conference from 17th to 18th of June 2014, Luleå, Sweden 10.


Chapter 3
Virtualization of Machine ToolsNew highly dynamic machine requires high static and dynamic stiffness to ensure machining accuracy and high dynamic properties of the feed drive to decrease the manufacturing time. This is achieved by employing small moving masses with suffi-
F. Cugnon (B)
Samtech s.a, a Siemens Company, Liège, Belgium e-mail:
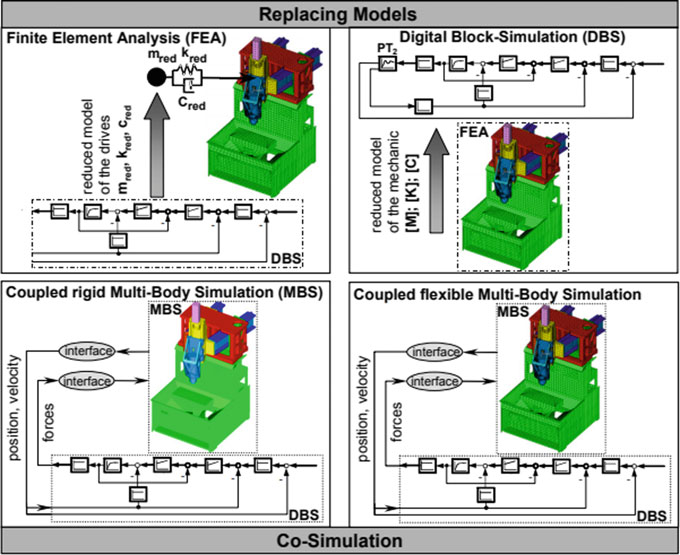
cient stiffness of the structural parts and high adjustable controller parameters of the drives. This leads to interactions between structural dynamics and feed drive con-trols, which have to be considered in the simulations [6, 7]. Natural frequencies of the feed drives are coupled with lower natural frequencies of the machine structure. To avoid instabilities, the control parameters have to be reduced, which leads to a limitation of the productivity of the machine tool.
The methodology proposed in Twin-Control is considering these interactions from the early design stage of the machine to the virtual prototyping verifications. The best method to couple structural dynamic and control loops is the flexible multi-body approach. In this case, the components of the machine tool can represent the static as well as the dynamic behaviour. Those flexible components are introduced in flexible multibody system (MBS) simulation tool as super-elements created by modal reduction of detailed FEA models. The different elements which are used to connect the structural components, such as guiding systems, mounting devices or ball screw drives, are modelled as a combination of flexible connectors and flexible joints depending on the specific configuration.
• Limit the number of degrees of freedom to as few as possible to allow for effi-cient time domain simulation (small time step imposed mainly by the machining simulation module and the controller model).
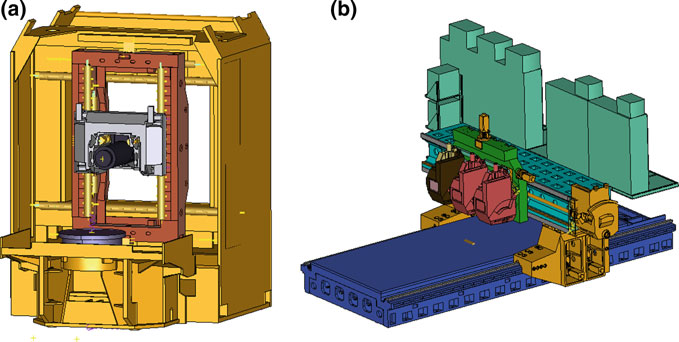
Usually, a machine is made of several main structural frames, which are modelled usingthesuper-elementtechnique.Theselectedmodalcontainsofthesuper-elements allow considering vibrations up to a desired frequency range. Non-structural masses are added to the moving frames to properly account for all moving components as motors, lubrication and cooling systems, etc., which are not considered in the mechanical model. Figure 3.2 shows the mesh used to create the super-element corresponding to one of the “support leg” of the Gepro machine. Ones can see the spider connections that link the retained nodes to the structure.
| 3.2.2 |
|
|
|---|---|---|
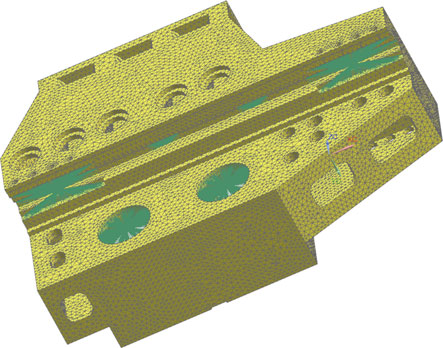
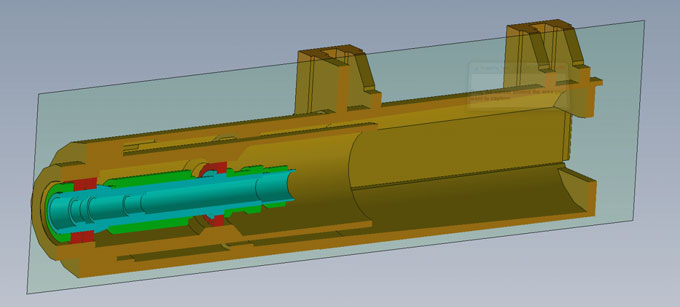
Fig. 3.4 Spindle CAD model
To summarize, the modelling process based on the CAD model of the machine is the
following:
are at correct positions.
• Connect the structural components with flexible joints.
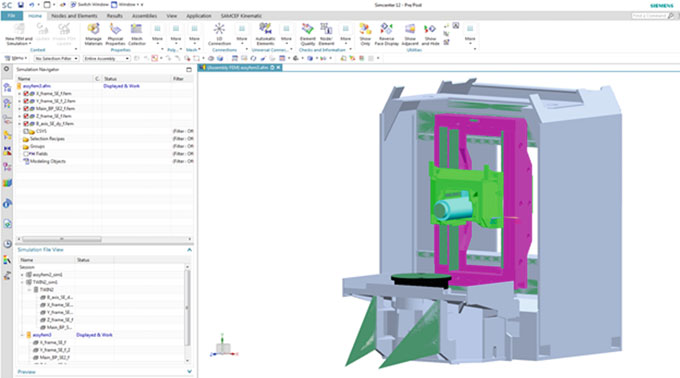
Fig. 3.6 Definition of a machine tool in Simcenter for Samcef
| 48 | F. Cugnon et al. | |
|---|---|---|
| 3.2.5 |
A simplified version of the control model was developed [10], disregarding the effect of current control loop and filters. Proper inputs and outputs are added to connect the mechanical model. Also, specific systems such as the pre-load loop are integrated to adapt to specific machine axes. This adapted Simulink model (see Fig. 3.7) is translated into a dynamic library and associated with a specific control element of SAMCEF Mecano that is used to manage the coupling between 1D model (control) and the full flexible 3D model (machine).
3.3 Validation of the VMT
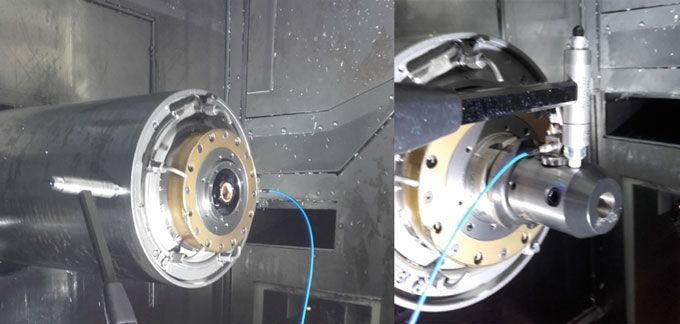
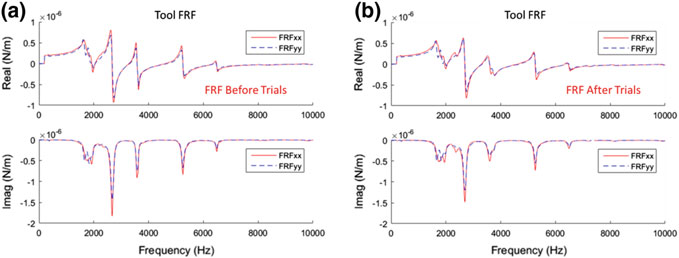
The modelling of a hammer test can be performed either in the frequency or the time domain. In the first approach, the flexible MBS model is used to position the machine in the desired configuration, and the solver exports its linearized matrices that are used to perform a harmonic response on the frequency range of interest. For this analysis, a unitary force is applied on the hammer impact position, result-ing acceleration at the measurement point is monitored to obtain the desired FRF function. Modal damping is introduced to tune the magnitude of the excited modes. For the time domain simulation, the machine is positioned in the test configuration, and a constant force impact is applied during 1 ms. The one-second interval after the impact is simulated, and the acceleration signal is stored. The FRF is then obtained by dividing the fast Fourier transform (FFT) of the measured acceleration by the FFT


| 3 | 51 |
|---|
0.002
0.001
| 0 | 50 | 100 | 150 | 200 | 250 | 300 | 350 | 400 | 450 | ||
|---|---|---|---|---|---|---|---|---|---|---|---|
| Frequency (Hz) | |||||||||||
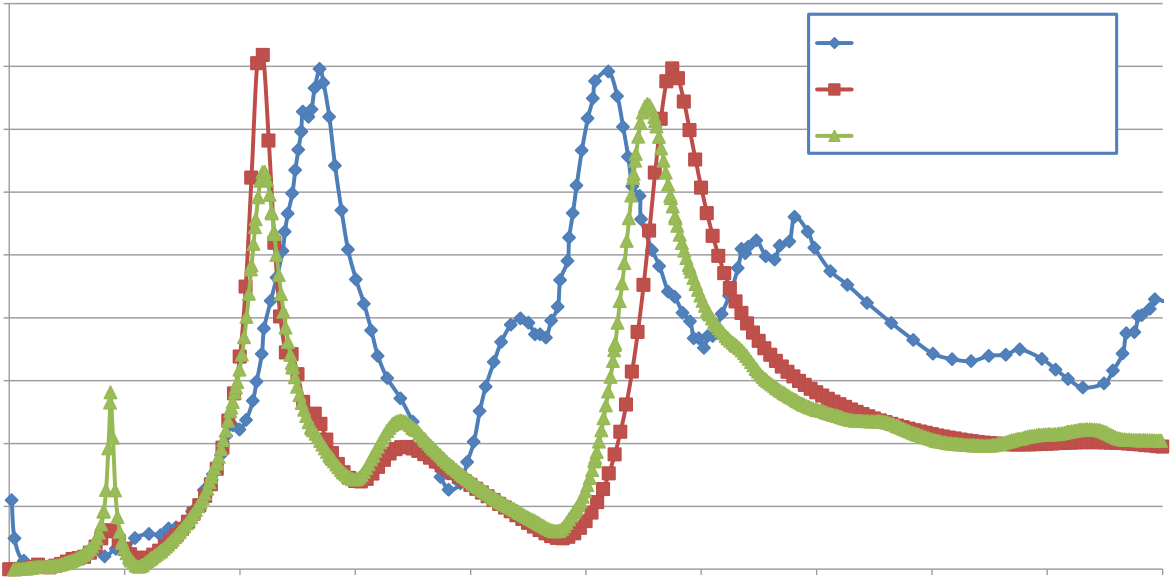
Both numerical models exhibit two main peaks close to 110 and 260 Hz that corresponds to the measurement within a 10% error margin. Frequency and time domain responses show small discrepancies in resonance locations because of differ-ent representations of the CNC, damping models are also different in both modelling approaches. The experimental curve presents “noise” in the frequency range above 300 Hz, and this behaviour is approached by the model. For harmonic response, the magnitudes at the resonances are easily tuned from the definition of modal damping. The management of damping in time domain simulation is less flexible. However, it
52 F. Cugnon et al.
was possible to approach resonance magnitudes by adjusting structural damping in the super-elements and inside the ground fixations.
Higher natural frequencies relatedtothespindledynamics areobserveddepending on the direction of the impact and the measure. Results from the model are compared to the validation test data in Table 3.1.
| 3 |
|
53 |
|---|
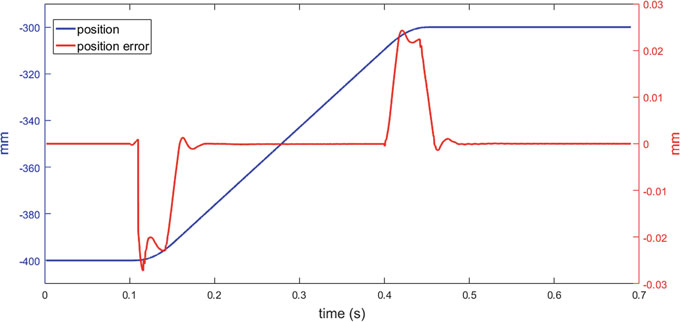
The upper graph recorded by the CNC (Fig. 3.13) presents the requested position and the associated positioning error. The bottom graph presents the velocity and applied current inside the linear motor, which is proportional to the generated force.
54 F. Cugnon et al.
References
1. Altintas, Y., Brecher, C., Weck, M., Witt, S.: Virtual machine tool. CIRP Ann.—Manufact.
The images or other third party material in this chapter are included in the chapter’s Creative Commons license, unless indicated otherwise in a credit line to the material. If material is not included in the chapter’s Creative Commons license and your intended use is not permitted by statutory regulation or exceeds the permitted use, you will need to obtain permission directly from the copyright holder.

Interactions between cutting tool and workpiece are critical in any machining opera-tion. As the tool moves through a workpiece, cutting process induces forces on both the tool and the workpiece. These forces in turn have an effect on the process and can have a detrimental effect on the machine, tool and resulting part under certain con-ditions. It is critical then to understand these interactions before a part is machined to avoid scrapped parts or damage to the tool or machine. This chapter first covers the development of process models used to predict cutting forces for specific part programs. The cutting force model is then used for dynamic analysis to determine the effects of tool vibration on the final part outcome.
4.2 Discrete Cutting Force Model
© The Author(s) 2019 57 M. Armendia et al. (eds.), Twin-Control,
58 L. Berglind and E. Ozturk
In the current model, ModuleWorks software which applies the tri-dexel model is used to determine TWE data for every cutter location (CL) point of a part program (see Fig. 4.1a). This TWE data determines which elements of a discretized tool mesh are engaged in the cut during that move. The cutting force contribution of each engaged element is then combined to determine the global cutting force for that move.
The complex cut area from Fig. 4.1c is discretized into multiple elements in Fig. 4.1d. Each element has an effective cut width, bel, along the tool profile, and thickness, hel, normal to the tool profile. The global tool force is determined by combining the effects of all active cutting elements.
This section outlines the processes to determine the effects each tool element have on global cutting force.
Fig. 4.2 Tool discretization along the tool profile, L, with increments, bel, at angle, θ, in increments of dθ
The tool is discretized along the tool profile, L, into NL elements, and circum-ferentially into Nc. The mesh structure is shown in Fig. 4.2c, with L mesh indices representing concentric circles radiating from the tooltip center and extending up the side of the tool. The element cut width, bel, is the distance between two adjacent L elements. The � indices indicate the circumferential position of the elements. The elements are positioned with lag angles to follow the helical curve of the cutting edge, as shown in Fig. 4.2c. By creating the mesh along the helical curve, the indices of the TWE map always correspond directly to the cutting edge, and each � index corresponds to the elements of one flute at one rotational position.
| 4 | 61 |
|---|
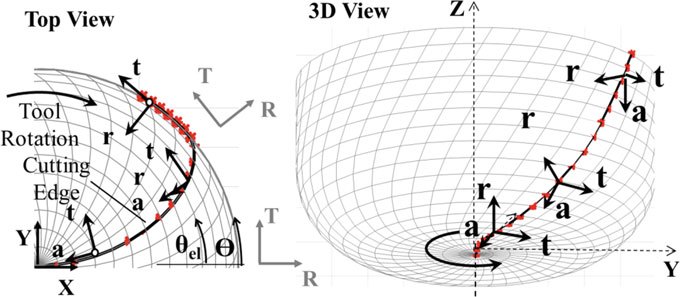
Fig. 4.3 Local and global coordinate systems
4.2.2.4 Element Local Cutting Force
Element cutting forces are calculated in {rta} using Eq. (4.1). To determine these element forces for any feed direction, chip thickness, hel, in Eq. (4.1) is defined based on the relative feed of that element in the local rta directions, f rta (feed per tooth vector in the rta directions). By defining the element uncut chip thickness, hel, as a function of the feed vector, it is possible to calculate element forces for any feed direction from a single cutting force matrix for that element. This feature is especially convenient in 5-axis machining where the tool continually changes feed direction.
Ft,el⎫⎪⎬�⎧⎪⎨Ke,a Ke,r
Ke,t⎫⎪⎬bel +⎧⎪⎨Kc,a Kc,r
points inward, normal to the cut surface). Defining the uncut chip thickness for each
element in Eq. (4.2) and combining with Eq. (4.1), the resulting expression for the
⎪⎩
Fa,el
Fr,elFt,el⎫⎪⎬
⎢⎢⎣Fc,r,el−Kc,abel
−Kc,rbel−Kc,tbel
⎪⎩
0
0
⎤
Equation (4.3) gives cutting forces in {rta} based on the element feed in the rta ⎧⎪⎨
⎪⎩
�
��
⎧⎪⎨
⎪⎭+
+�Qrta,el
⎡
�{frta}
Fc,a,el
Fc,t,el
ft
fa
fa
⎤
directions using the cutting force matrix, Fc,rta,el/frta, or Qrta,el. The use of Qrta,el is
not a significant improvement on Eq. (4.1) in {rta}, however, though transformation
4.2.2.5 Cutting Force Transformations
Cutting forces from Eq. (4.3) must be transformed from {rta} to {XYZ}, as shown in Fig. 4.5. Two coordinate transformations are required. The first transformation accounts for the local orientation of the cutting edge which is defined by the tool profile angle, κel. The transformation matrix, T κel, in Eq. (4.4) transforms from {rta} to the tool {R T A}.
0 cos θel 0 0 1 ⎤ ⎥⎦
(4.5)Combining (4.4) and (4.5), the transformation matrix to transform from {rta} to {XYZ} is shown in Eq. (4.6).
|
(4.7) | |
|---|---|---|
| (4.8) |
After transforming in Eqs. (4.7) and (4.8), all of the element force vectors, Fe,XYZ,el, and matrices, QXYZ,el, share a common CS. Also, at any instant in time (or at any flute position, �), all elements of the tool share a common feed, f XYZ. As a result, the global effect of a flute at each position, �, can be determined by combining Fe,XYZ,el and QXYZ,el of active elements at each � position. The total cutting force for each angular position is calculated in Eq. (4.10), where the outer inner summation considers all active cutting elements along a single cutting edge, and the outer sum-mation combines the effects of multiple cutting flutes, where Nf is the total number of flutes, NL is the number of elements along the tool profile, and Nc is the number or circumferential elements.
| Fe,XYZ(�) � |
|
(4.10) | ||
|---|---|---|---|---|
| �QXYZ(�)� | � | |||
|
||||
The term, g(�, L), in Eq. (4.10) is a matrix of ones and zeros defining which tool mesh elements along the tool profile, L, are engaged in the workpiece at each flute position, �. g(�, L) is illustrated in Fig. 4.6, for example, TWE for a 30° helix tool mesh with 30 angular positions, �, and 30 elements along the tool profile, L. As the tool rotates, the flute position shifts to different angular positions, and only the elements corresponding to those angular position are engaged at that time. For example, at position �1 in Fig. 4.6 the flute is not in the cut, and g(�, L) � 0 for all elements at that position. When the flute is at �26, elements 10 through 20 are engaged and their effects are combined using Eq. (4.10).
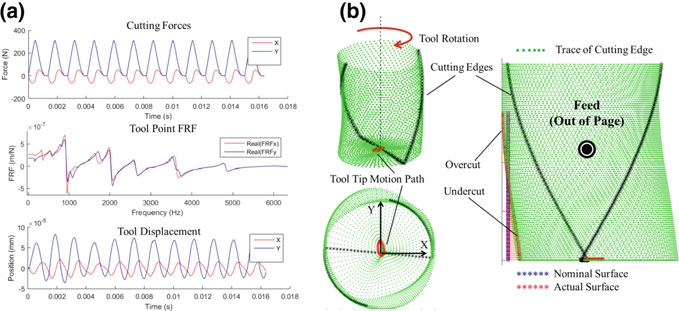
The example in Fig. 4.7 shows the calculated cutting forces for a two-fluted, 12-mm-diameter ball end mill with full radial immersion at 10,000 RPM with a cutting depth of 3 mm. For this cut, the tool is fed in the negative Y-direction at a rate of 0.1 mm per tooth, so the feed vector is constant at fXYZ � {0, −0.1, 0}T. Equa-tion (4.11) is then evaluated at each position (only positions 1 through 7 are shown), to obtain the changing cutting forces as the tool rotates through the engagement region.
4.2.4 Part Cutting Forces
| 4.2.5 | � TT2P���QXYZ(�) Fe,XYZ(�) |
(4.12) | |
|---|---|---|---|
| (4.13) | |||
|
Two cutting tests are performed to compare simulated and measured cutting forces. The tool for both tests is a 12-mm-diameter ball end mill with two flutes and helix
Fig. 4.7 Calculation of cutting forces with a single operation for each global rotation angle by combining all active cutting elements at that angle
angle of 30° (Sandvik R216.42-12030-AK22A H10F). The machine used for the tests is a MAG FTV5-2500, and force measurements are collected using a Kistler 9139AA dynamometer. The CFCs used for the AL7075-T6 workpiece are found experimen-tally using a ball end mill mechanistic model [11], to be: Ke,r � 13.9, Ke,t � 7.1, Ke,a� −1.3 N/mm, and Kc,r � 619.9, Kc,t � 1014.2, and Kc,a � 58.2 N/mm2. Note that average CFC values identified experimentally are used for all elements regardless of local oblique and rake angles. A summary of CFCs for this set of trials (“M” machin-ing tests) along with the CFCs for other trials in this chapter are provided in Table 4.1.
| 4 | 67 |
|---|
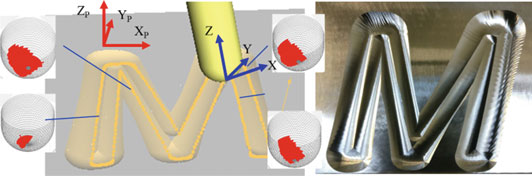
Fig. 4.9 Test cut “M” character with varying cut depth
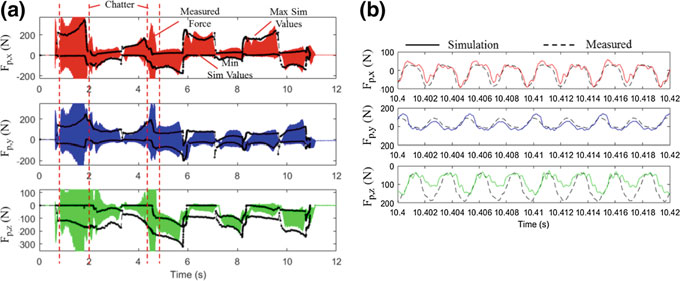
Fig. 4.10 a Measured forces in workpiece CS with maximum and minimum simulated force values at each corresponding location. b Comparison of simulated and measured force data at one location of the “M” part
The cutting force model developed here was created to predict forces for complex machining operations where the tool/workpiece engagement is complex and highly variable throughout. The key feature of this model is that it treats the elements of a discretized tool as individual entities which have predetermined force characteristics (Fe,XYZ,el and QXYZ,el) which are independent of the feed rate and feed direction of the tool. When coupled with ModuleWorks TWE software to capture effect of changing cutting conditions on the TWE, it is possible to efficiently obtain complex cutting force predictions for 5-axis milling operations.
In order to simulate stability of a complex toolpath, Budak et al. simulated stability lobe diagrams for different points along the toolpath [21] and generated 3D stability lobe diagrams. This approach is applicable for parameter selection while designing toolpath. By looking to the 3D stability lobe diagram, the most conservative cutting depth and spindle speed can be selected for the process to have a chatter-free process. On the other hand, there are practical issues with using 3D stability lobe diagrams.
In complex cutting cases, definition of cutting depth can be vague. Even if the process planner has the 3D stability lobe diagram for a given process, it will be difficult for the process planner to identify whether the process is stable at a given point. First, they need to determine the cutting depths at each point in the toolpath and spindle speed and compare them with the 3D stability lobe diagram. Moreover, once the toolpath is generated it is not possible to change the cutting depth without generating the toolpath again. For these reasons stability lobe diagrams are less practical for the visualization of the stability and changing the cutting depth without changing the toolpath. In order to visualize the stability of a given process, the
4.3.1 Dynamic Force Model
The cutting force matrices developed in Sect. 4.2.2 to predict cutting forces for any tool/workpiece engagement, and feed direction can also be applied to predict stability for the same operations. To simulate dynamic effects, Eq. (4.11) is modified by including dynamic effects in the tool displacement vector, �XYZ. The dynamic feed vector is shown in (4.14), where f XYZ is the nominal feed per tooth vector, and XYZ and XYZτ are tool displacements from the nominal position at the current time and at the previous tooth pass.
After averaging to obtain Q0 and defining �XYZ(ω) as a function of the frequency response function, FRF(ω), in Eq. (4.17), the resulting time-invariant dynamic force
| 4 |
|
71 |
|---|
For calculation, Eq. (4.19) is rearranged to the form used by the eig function in det
�[I] −�1 − e−iωτ���Q0�[FRF(ω)]
(4.20) in Eq. (4.21), when the real component of eig
|
|---|
a result, stability is predicted for each new Q0 matrix, where Q0 changes throughout a
program based on changing TWE data. For each new Q0 matrix, the eigenvalues are
< 0.5,
Unstable
Stabiltity Limit
frequency, ω, at which λmax(ω) > 0.5 is considered a chatter frequency, ωc.
72 L. Berglind and E. Ozturk
The process used to produce a SRM from the system eigenvalues is shown for three example engagements in Fig. 4.11. For each engagement, the maximum real eigenvalues are identified over a range of frequencies, and values greater than 0.5 are considered chatter frequencies, ωc, as indicated for the third engagement in Fig. 4.11a. The chatter frequencies correspond to spindle speeds, �c, which repeat for each jth lobe, according to (4.23). Here, start and end chatter frequencies, ωc,(1,2), are identified at location where the eigenvalues cross 0.5, and these values are used to calculate start and end chatter speeds, �c,(1,2), for each jth lobe for each engagement, as shown in Eq. (4.24) and for the third engagement in Fig. 4.11b.
| �c,(1,2) � | Nf | �∈ | (4.24) |
|---|
4 Modelling of Machining Processes 73
4.3.3 Stability Roadmap Trials
The results of both tests are shown in Fig. 4.13. The SRM color map indicates the predicted chatter frequency at that location, where the chatter frequency with the highest real eigenvalue, λmax, is represented for each spindle speed (there can be multiple chatter frequencies at the same speed). The results from the 12,250 RPM test (Fig. 4.13a) show that two frequencies are predicted to be dominant, at 1500 and 2300 Hz. The spectrogram results show high amplitudes at both frequencies when unstable during the first 850 CL points.
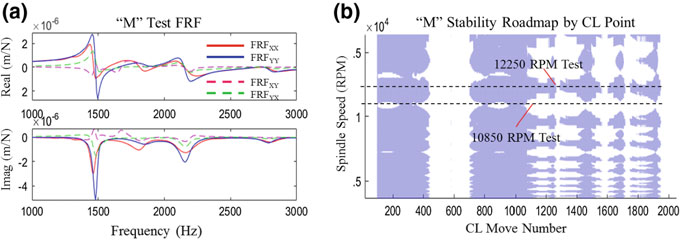
The 10,850 RPM test results (Fig. 4.13b) match the predicted chatter frequen-cies near 2300 Hz, and no chatter is observed near 1500 Hz. Predictions from the 10,850 rpm test are again most accurate for the first 850 CL points.
Both machined “M” parts are shown in Fig. 4.13 with locations of visible chatter on the part surface labelled. The CL points corresponding to the chatter locations are indicated both on the SRM and on the photos of the part for sections A1 and A2 at 12,250 RPM and B1 and B2 at 10,850 RPM. It can be seen that these chatter locations agree with the spectrogram measurements and SRM predictions for the first 850 points.
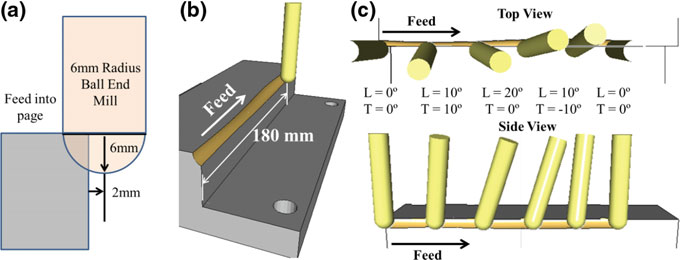
Fig. 4.14 Edge machining trial setup with no tip engagement, and continuously varying lead, tilt, and engagement
76 L. Berglind and E. Ozturk
The results from Fig. 4.17 show that the stability regions do not line up exactly, as there is a shift in RPM between the predicted and measured stability regions. The cause of this shift is not known for certain; however, it is possible that this shift is a result of changes in the spindle dynamic parameters as a result of spindle speed. Despite these differences and the highly transient nature of this operation, the measured regions of stability of the corner machining example closely follow
| 4 |
|
77 |
|---|
the stability roadmap, and the chatter vibration amplitudes follow the qualitative predictions of the system eigenvalues.
Whereas the SRM was colored to represent predicted chatter frequency in the pre-vious example, here, the SRM colors show the predicted maximum real eigenvalues of the system, λmax(ω). The use of λmax(ω) is useful for showing the predicted severity of the chatter. This is seen in Fig. 4.18 where the experimental chatter data is plotted with a third dimension, showing the ratio of the measured maximum chat-ter frequency amplitude, max(Amp(ωc)), to the tooth pass frequency amplitude, max(Amp(ωt)). It can be seen that the amplitudes of the chatter vibrations qualita-tively follow the form of the eigenvalues, λmax(ω).
The SRM provides an effective means of representing stability information for com-plex machining operations. Application of the zero-order approximation method to a discretized cutting force model allows for efficient stability prediction regardless of the engagement or the tool feed direction. When coupled with TWE simulation software, this approach can be used to represent the entire process virtually for a specific part program with a specific tool.
The experiments from this paper show that the SRM can accurately predict chatter locations,evenwithatoolwithnonsymmetricdirectFRFsandsignificantcrossFRFs. However, the experimental results have shown that the current model is only effective when the tooltip center is not engaged in the cut.
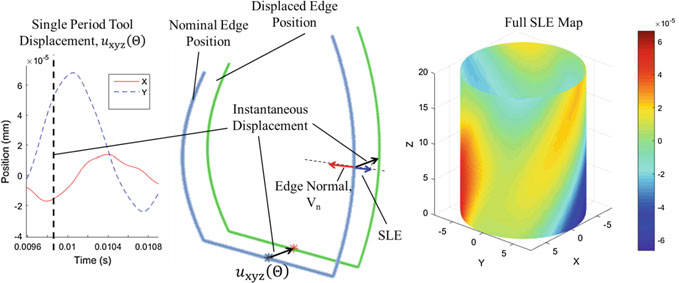
The prediction of surface location error has been made using various techniques in prior research. In these works, the motion of the tool in response to the cutting force is predicted, and this motion is imposed onto the rotating cutting edge to predict the true surface left behind. A closed form solution to predict SLE as a function of the tool FRF and forcing function is developed in [23]. Time domain simulations have also been used to predict tool motions in more complex cases, such as run-out [24], or 2-DOF milling dynamics [25]. Others used a truncated Fourier solution to determine tool motions based on modal parameters [26]. They then simulated the full 3D “morphed” cutting edge path, which then used to model the final machined surface.
These steps are shown in Fig. 4.19 for an example case. In Fig. 4.19a, the simulated tool displacements are shown which is based on the cutting force for the current operation and the frequency response function (FRF) of the tooltip.
Once the tool displacements are known, they are combined with the rotary motion of the cutting edge, as shown in Fig. 4.19b. With no tool displacements, the helical cutting edges nominally follow a path that forms a cylindrical shape. The addition of the tool vibrations causes the helical cutting edges to form a new shape, which represents the actual profile of the tool. By following the shape traced by the cut-ting edges, which is plotted with green points, the deviation of each point can be determined and the surface location error identified at each point of the tool. In the example in Fig. 4.19b right, the tool edge trace is oriented so that the tool is feeding out of the page, and the machined surface left behind is the leftmost side of the tool profile. Nominally, the tool removes material along the cylindrical shape, leaving behind the straight, blue edge. When vibrations are included, the resulting machined
⎧⎪⎨Fx(ω)
Fy(ω)
the tool dynamic data (FRF(ω) in Fig. 4.19). The 3×3 FRF matrix in (4.26) allows for all direct and cross FRFs to be used when determining the tool response, although, typically only the diagonal, direct FRFs are nonzero. However, cross FRFs were used in the validation tests presented here due to their significant magnitudes.
tool position prediction using
both time domain simulation
Y(ω)
Z(ω)⎫⎪⎬
⎥⎥⎦⎧⎪⎨
⎪⎩
Fx(ω)
⎧⎪⎨X (t)
Y(t)
with time domain simulation results in Fig. 4.20. It can be seen that even though
regenerative effects are ignored, the results are nearly identical using either method.
ensure that the process is stable.
4.4.2 Surface Location Error Calculation
82 L. Berglind and E. Ozturk
Surface Element if: g(�, L) � 1 & Vn,el(�,L) · fxyz < MinVal (4.29)
| 4 |
|
83 |
|---|
Figure 4.23b shows both the nominal surface (with no vibrations) and the sim-ulated surface with vibrations. From this view, the simulated surface is offset from the nominal surface by the surface location error (SLE) values which are predicted for each element based on the cutting edge trace.
Since we are comparing error results at many points along the simulated part surface, a best fit error approach is used to characterize surface errors. As the nominal shape of the ball end mill machined grooves is circular, circular fit errors are used.
Fig. 4.23 Process used to measure simulated surface errors with tool vibrations
Bilz ThermoGrip T1200/HSKA63 tool holder with a tool overhang of 67.2 mm. The machine used for the tests is a MAG FTV5-2500, and force measurements are collected using a Kistler 9139AA dynamometer. The workpiece material is AL 7075 T6 and PTFE nylon. The CFCs used for the AL7075-T6 workpiece are found experimentally using a ball end mill mechanistic model [11], to be: Ke,r � 7.43, Ke,t � −2.98, Ke,a � −2.7 N/mm, and Kc,r � 128.35, Kc,t � 965.49, and Kc,a �85.34 N/mm2(also see “corner cut tests” in Table 4.1). Note that average CFC values identified experimentally are used for all elements regardless of local oblique and rake angles.
|
|
Tilt (Degrees) | |||
|---|---|---|---|---|---|
|
|
||||
|
|
||||
|
|
||||
|
|
||||
|
|
||||
|
|
||||
|
|
||||
|
|
||||
|
|
||||
|
|
||||
|
|
||||
|
|
||||
|
|
||||
|
|
Fig. 4.24 Alicona Infinite Focus G5 and an example groove surface measurement
measurement are shown in Fig. 4.24b, c. Surface data generated in these measure-ments are used to characterize the true form of the grooves. As they are all machined with a 6 mm radius ball end mill, the nominal surface generated should also have a circular form with a radius of 6 mm.
Fig. 4.25 Process of extracting surface profile traces from Alicona measurements, which are then compared with simulated surface traces
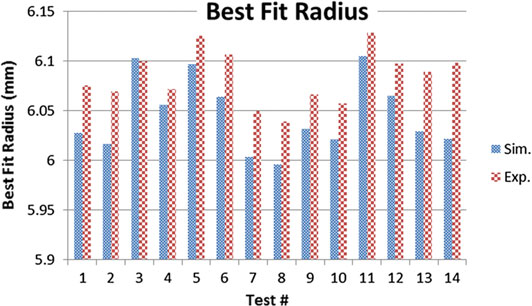
Fig. 4.27 Illustration of how profile errors are measured from a best fit circle for both the simulated and measured aluminum surfaces
One challenge for SLE experiments is determining an absolute reference from which to measure the errors in the true surface. For example, it is difficult to define the nominal center of the tool from which to compare the measured surfaces. For this reason, the best fit circles are used as a reference to measure errors for both simulated and measured surface data.
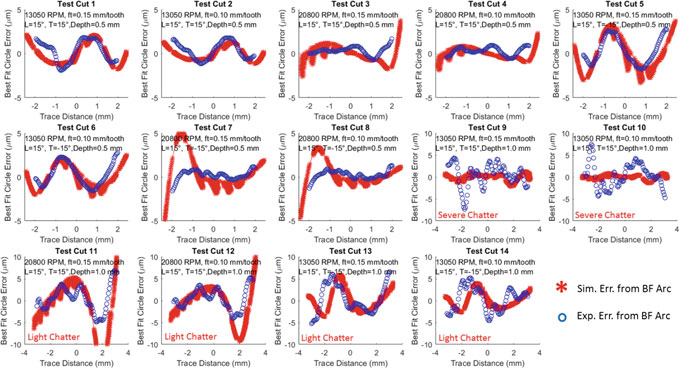
Fig. 4.28 Comparison between best form errors for measured and simulated surfaces
| 4 | 89 |
|---|
The results from these tests show that the SLE model can provide a good indication of surface error for simple 5-axis operations using a ball end mill.
4.5 Process Model Simulation Interface
Fig. 4.30 Process model GUI developed to run process model code in MATLAB
90 L. Berglind and E. Ozturk
C. The user can control the resolution of the tool mesh and the tool path resolution at which all analysis is performed (analysis is performed at fixed distance points along the toolpath, and not an every CL point). The user can also select which section of the part program to analyze based on CL move number using Max/Min Move.
D. Once options are set, the user selects “Start Analysis” to start the simulation. Dur-ing simulation, the status of the simulation is updated in the “Status” box. Once the simulation is complete, the user has the option to view all tool/workpiece engagements along the toolpath by selecting “Check Engagements”.
H. Plot of simulation results against toolpath.
I. Main display window used during simulation setup and to show simulation results.
Fig. 4.31 Outputs of AMRC process model GUI, showing simulated force, torque, chatter, and surface location errors graphically on the part geometry
results are represented by both a color scale and dot size. For chatter results, the color indicates the predicted chatter frequency along the toolpath, and the dot size indicates the system eigenvalue along the toolpath, which correlates to the severity of chatter predicted (no dot indicates no predicted chatter). The color scale of the SLE data represents the maximum SLE value calculated within the surface generation section of the tool, and the dot size represents the range of SLE values over the surface generation section.
| 92 | L. Berglind and E. Ozturk | |
|---|---|---|
| 4.6 |
References
1. Ozturk, E., Budak, E.: Modelling of 5-axis milling processes. Mach. Sci. Technol.
13. Altintas, Y., Budak, E.: Analytical prediction of stability lobes in milling. CIRP Ann. Manuf.
Sci. Technol. 13, 227–245 (2009)
Open Access This chapter is licensed under the terms of the Creative Commons Attribution 4.0 International License (), which permits use, sharing, adaptation, distributions long as you give appropriate credit to the original author(s) and the source, provide a link to the Creative Commons license and indicate if changes were made.
Dominik Flum, Johannes Sossenheimer, Christian Stück and Eberhard Abele
5.1 Introduction
C. Stück
e-mail:E. Abele
e-mail:
| 96 | kWh/year | D. Flum et al. | ||||||
|---|---|---|---|---|---|---|---|---|
| Powertrain | ||||||||
| Cooling lubri. High Pr. | 4743 | -75% | [kWh/year] | |||||
| CoolingLubr . Purging, Shower | 5212 |
|
-52% | |||||
|
0 | |||||||
|
||||||||
| Hydraulic |
|
7796 | 48.620 kWh | |||||
| Machine chiller | -27% | 17152 | ||||||
| -43% | ||||||||
| Control cabinet air conditioning | ||||||||
| 24V-Supply | Initial State | |||||||
| 230V-Supply |
|
|||||||
| Exhaustventilation |
|
|||||||
| Pressurized air | ||||||||
| Optimized System | ||||||||
5.1.2 Scope of Investigation
The measures to optimize the energy efficiency of metal-cutting machine tools are manifold. The optimization measures can generally be classified according to the overviewinFig.5.2.Accordingtothis,anincreaseintheenergyefficiencyofmachine tools can be achieved by [6]:
|
Process design | Energy Reuse | ||||
|---|---|---|---|---|---|---|
| ... |
|
... | ||||
| Machine-related | ||||||
| Efficient | Demand-oriented | Machine states | ||||
| control | ||||||
|
Energy saving modes | Arrangement and structure of the components |
Path planning |
|
Energy saving modes | |
|
||||||
| Structural | ||||||
| Technology (dry machining,...) | ||||||
| optimization | ||||||
|
||||||
Whenconsideringthedesignoftheassemblies,oversizingand“safetysurcharges”thatarefrequentlyencountered,especiallywhendesigningpumpsandmotors,should be avoided. This results in the components no longer running at their optimum operating point, which in turn has a negative effect on energy efficiency [7].
Standby operation, which means switching off or activating an energy-saving mode for modules or components when they are not in use, also reduces the energy consumption of metal-cutting machine tools [8]. This is achieved, for example, by implementing energy management functions on the machine control whereby certain modules are switched off either after a time defined by the user or after completion of the part program [9].
Existing scientific approaches for both approximation and simulation of the energy requirements of machines and production processes are presented below.
5.2.1 Machine Simulation and Process Modelling
Draganescu et al. [22] evaluate the energy efficiency of machine tools by analysing the energy effectiveness, which is defined as the ratio of theoretical cutting energy to total energy demand. Using statistical methods and empirical data, a mathematical model was developed that maps the ratio of different operating parameters, such
5.2.2 Energy Demand Approximation of Production Machines
Kuhrke [7] developed a methodology for a prospective assessment of the medium and energy demand that can already be used in the offer phase of machine tools. Therefore, a foundation for machine tool manufacturers, as well as for operators for a coherent evaluation of the energy and medium demand, is provided. The basis for this is the analysis of a sample machine, in which he developed calculation rules for each energy-relevant component. This was based on information from datasheets and data gainedbymeasurementsiftherequiredinformationinthedatasheetswasinsufficient. Finally, by aggregating the individual demands, the total energy consumption of the machine tool can be calculated [7].
| 100 | D. Flum et al. | |
|---|---|---|
| 5.2.3 |
The energy efficiency module of Twin-Control aims to support machine tool builders within the machine design phase to choose an energetically optimal machine con-figuration. In addition, the simulation tool enables part manufacturers to guarantee an energy-efficient part production considering different NC Code alternatives. For establishing energy efficiency measures, a machine tool builder or user needs, in the first place, information about the possible energy efficiency measures. Secondly, a systematic and transparent decision-making process is necessary to evaluate several energy efficiency measures. These prerequisites will be accomplished by the energy efficiency module.
5.3.1 Framework
Fig. 5.3 Framework of the energy efficiency module
• Workpiece information: the component information includes the part to be pro-duced, which is described by the NC program and related information, such as material and tool parameters.
The design of the energy efficiency module follows a tripartite model–view—controller (MVC) approach with the following features.
• Module database: the modules are held in the form of strategies for energy effi-ciency measures.
The key elements of the energy efficiency module are briefly described below. Since the energy simulation models make up the essential part, they are discussed separately in this chapter.
• Energy efficiency measure pool: the basic approaches to energy efficiency improvements are collected in a measure pool. These approaches represent tem-plates for energy efficiency measures that can be taken into account for the con-figuration.
• Configuration result: The generated configuration is a collection of measures. To make them available outside the platform, they must first be prepared. This includes, e.g. a collection of parts lists or datasheets based on the selected alter-
| 5 |
|
103 |
|---|
| 104 | D. Flum et al. | |
|---|---|---|
| 5.4.1 |
Process Layer (NC Code Interpreter)
Within the process layer, the interaction between the workpiece and the tool is mapped. Cutting force calculations, as well as tool engagement estimations, are performed in this part of the simulation model. Through transforming the calculated cutting forces into torque on the main spindle as well as forces on the feed drives, the load on the drive system of the production machine can be predicted.
Fig. 5.5 Basic concept of the (physical) energy simulation models (see [3])
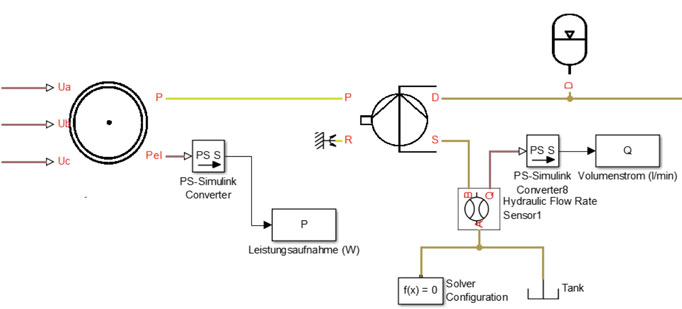
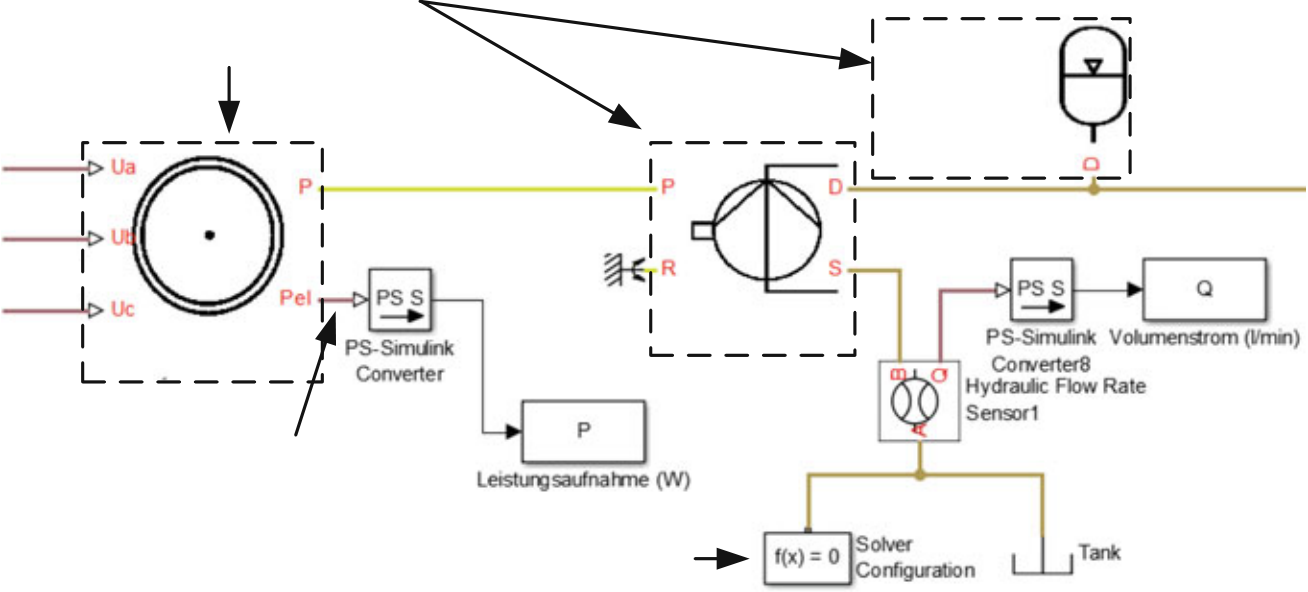
With the help of this library, machine assemblies can be easily mapped. Manu-facturer information such as fluid or electrical plans is used for this purpose. The parameterization of the component models is carried out via datasheets. This results in a simple adaptability to different applications (Fig. 5.6).
A concrete model is built up from the individual components, which are taken from the Twin-Control library and then linked to each other. It is possible to orientate
| Electric drive |
|
|
|---|
Parameters of components
Cylinder
106 D. Flum et al.
| Constant pump | Hydraulic | |||
|---|---|---|---|---|
|
Directed connection
(Power demand)
Using this modelling approach, the level of detail is particularly high and allows the technical behaviour to be checked down to individual parts (valves, pumps, etc.). All energy-relevant assemblies can be modelled, including the drivetrain with dynamic effects.
5.5 Implementation on EMAG VLC100Y Turning Machine
Fig. 5.8 Electric Power Measurement with mobile measurements device on the EMAG VLC 100Y turning machine
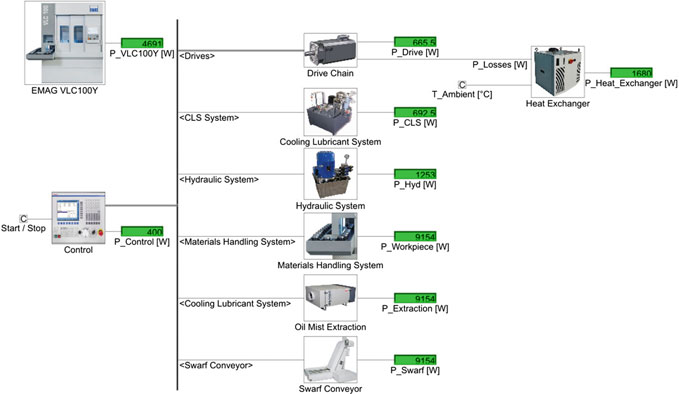
Table 5.1 Comparison of measurement and simulation data
|
|
|||||
|---|---|---|---|---|---|---|
|
|
|
||||
| Drive units |
|
|
||||
|
|
|||||
|
|
|||||
|
0 | 0 |
|
|||
| 0 | 0 |
|
|
|||
| 0 | 0 |
|
||||
|
|
|
References
Mod. Mach. (MM) Sci. J. 4 (2009)
27. Dietmair, A., Verl, A., Huf, A.: Automatisierung spart Energie – Direkte und indirekte Maß- nahmen in der Gerätetechnik. In: Energy 2.0, p. 26 (2009)
28. Bittencourt, J.L.: Selbstoptimierende und bedarfsgerechte Steuerungsstrategien für Werkzeug- maschinen zur Steigerung der Energieeffizienz. Apprimus, Aachen (2013)
29. Schrems, S.: Methode zur modellbasierten Integration des maschinenbezogenen Energiebe- darfs in die Produktionsplanung. Shaker Verlag, Aachen (2014)
30. Rief, M.: Vorhersagemodell für den Energiebedarf bei der spanenden Bearbeitung für eine energieeffiziente Prozessgestaltung. Shaker, Aachen (2012)
31. VDI Verein Deutscher Ingenieure: Simulation von Logistik-, Materialfluss- und Produktion- ssystemen(3633). Beuth Verlag GmbH, Berlin (2013)Open Access This chapter is licensed under the terms of the Creative Commons Attribution 4.0 International License (), which permits use, sharing, adaptation, distributions long as you give appropriate credit to the original author(s) and the source, provide a link to the Creative Commons license and indicate if changes were made.
Eneko Olabarrieta, Egoitz Konde, Enrique Guruceta and Mikel Armendia
6.1 Introduction
E. Guruceta
e-mail:M. Armendia
e-mail:
The presented activity does not pretend the development of a new wear model that improves the performance of well-known references like the ones presented in the ISO 281 [9], but to present an approach that can facilitate the analysis to the end user and can be combined with other data sources to improve end-of-life estimations. The work is focused on bearings performance, but it can be easily extrapolated with other rolling-based elements like guideways and screw drives.
This work is composed of five sections. The first one presents the introduction and context of this research. The second one presents the background of the pro-posed approach. The third chapter introduces the developed calculation module and proposes a new approach for bearings lifecycle study. Next, a summary of the results obtained in experimental tests is provided. Finally, the conclusions are presented.
| L | 106 | �C | (6.1) | |
|---|---|---|---|---|
| 10h � | 60 · n |
where n is the rotating speed, C is the dynamic radial load capacity of the bearing with a 90% of reliability, P is the equivalent load and p is an exponent defined by the bearing type.
P � X · Fr + Y · Fa (6.3)
whereX istheradialloadfactor,Y istheaxialloadfactorandFr andFa aretheaverage radial and axial loads actuating on the bearing. The factors are given by the bearing characteristics, and the average loads must be estimated from the correspondent application through calculations or measurements.
| ne � | N � |
(6.4) |
|---|
• Load:
| 114 | E. Olabarrieta et al. | |
|---|---|---|
| 6.3 |
In the machine tool design stage, the module can calculate end-of-life based on loads provided by a machine tool simulation module [11–13] that can provide very accurate component loads. The possibility to use an accurate input to the end-of-life module will, of course, enhance the life predictions and, hence, machine tool designers will be able to select more suitable bearing. Figure 6.2 presents the module integrated in the Twin-Control application, with two interfaces for the configuration and results visualization.
In the machine tool usage stage, thanks to the current NC monitoring capabilities, real component loads can be derived, without the need of expensive and complex bearing monitoring sensors. This allows the estimations of the remaining useful life of the studied component. In Twin-Control project, the end-of-life module has been integrated in KASEM, the fleet management system provided by PREDICT (Fig. 6.3). Remaining useful data is calculated periodically using real usage condi-tions monitored and uploaded thanks to the ARTIS hardware installed in the machine.
| Real | Remaining | ||
|---|---|---|---|
| useful life | |||
| module | |||
| Machine |
Fig. 6.1 Bearing lifecycle analysis approach
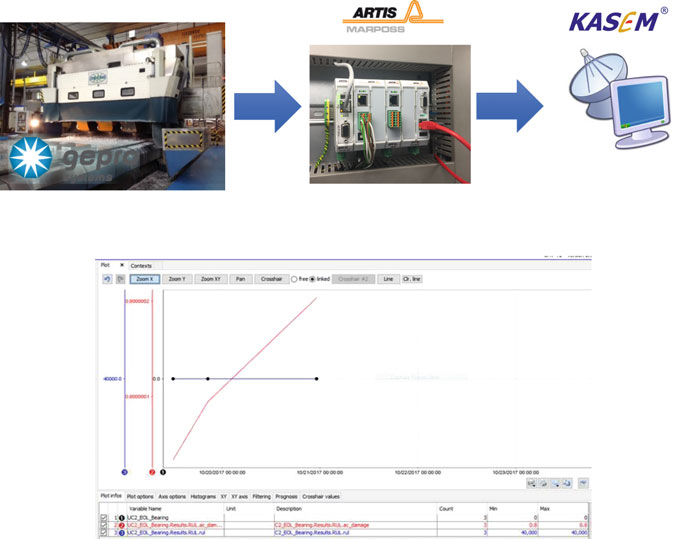
116 E. Olabarrieta et al.
The FALEX test bench has a complete monitoring infrastructure, including force, speed, temperature and vibration sensors and a National Instruments cDAQ acquisi-tion system.
Bearing wear is normally a long duration phenomenon. To adapt test duration and be able to analyze results in an affordable period, accelerated wear tests have been performed by selecting a bearing that provides an end-of-life below 24 h with the loads that can be applied by the test bench (10 kN axial static force at 10,000 rpm).
| 6 | 117 |
|---|
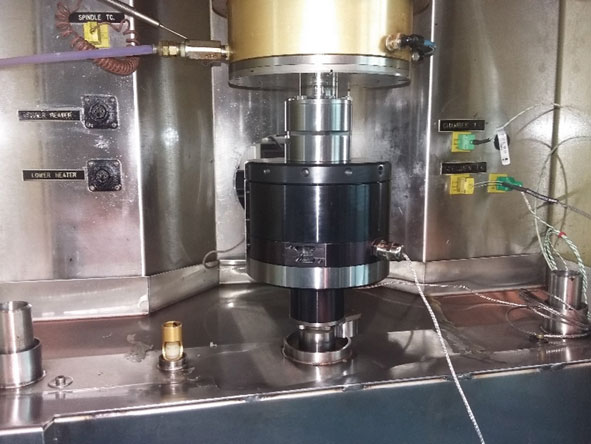
Fig. 6.4 FALEX test bench available at IK4-TEKNIKER installations
118 E. Olabarrieta et al.
Table 6.1 Summary of the experimental tests (4 kN of static axial load and 6200 rpm of rotation speed)
|
|
||
|
|
||
|
|
||
|
|
||
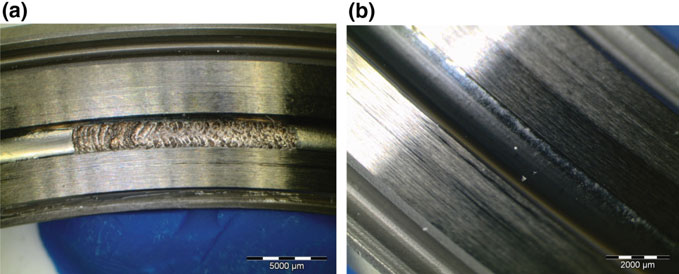
Fig. 6.6 Microscope images showing outer rings of the bearings: a #5 with severe pitting after 18 h; b #6 with micro-pitting after 35 h (with a regreasing every 5 h)
Figure 6.7 shows the evolution of the root mean square (RMS) in the whole studied frequency range (10–2000 kHz) of the vibration signal acquired during test #5. A sudden increase of vibration is observed at around 14 h, clear indicator that the bearing started to fail. The test continued until 18 h, showing a totally worn condition
6.5 Conclusions
A new approach for the study of bearing lifecycle performance is presented. The proposed approach is based on the well-known ISO 281 for end-of-life determination. The work is focused on bearings performance, but it can be easily extrapolated with other rolling-based elements like guideways and screw drives.
of the critical components. On the other hand, the tool is prepared to be fed by real machine usage data (monitored). This way, remaining useful life of a component can be provided. In parallel, the usage of a condition monitoring system based on vibration measurement can be used to detect anomalous performance (out of the nominal behavior, like collisions).
Some preliminary validation tests have been done in a test bench available in IK4-TEKNIKER installations. The tests showed that the ISO standard underestimates the end-of-life of components. In addition, results provided by the vibration measure-ments showed the possibility to detect component failure in an early stage. This early detection will allow more efficient maintenance actions in industrial applications.
| 6 |
|
121 |
|---|
3. Stribeck, R.: Kugellager fü r beliebige Belastungen. Zeitschrift des Vereines deutscher Inge- nieure 45(3), 73–9 (pt I) & 45(4), 118–125 (pt II)
4. Goodman, J.: Roller and ball bearings. Proc. Inst. Civil Eng. 189, 82–166 (1912)
5. Palmgren, A.: Ball and Roller Bearing Engineering, First edn., (trans.: Palmgren, G., Ruley, B). SKF Industries, Inc., Philadelphia, PA (1945)
6. Weibull, W.: A statistical theory of the strength of materials. In: Proceedings of the Royal Swedish Academy of Engineering Sciences, 45 pp., vol. 151, Stockholm, Sweden (1939) 7. Lundberg, G., Palmgren, A., Dynamic capacity of rolling bearings. In: Proceedings of the Royal Swedish Academy of Engineering Sciences, 50 pp., vol. 196, Stockholm, Sweden (1947) 8. Lundberg, G., Palmgren, A.: Dynamic capacity of roller bearings. In: Proceedings of the Royal Swedish Academy of Engineering Sciences, 32 pp., vol. 210, Stockholm, Sweden (1952) 9. ISO 281:2007: Rolling bearings—Dynamic load ratings and rating life
10. Halme, J., Andersson, P.: Rolling contact fatigue and wear fundamentals for rolling bearing diagnostics—state of the art. Proc. Inst. Mech. Eng. Part J: J. Eng. Tribol. 224(4) (2010) 11. Cugnon, F., Berglind, L., Plakhotnik, D., Ozturk, E.: Advance modelling of machine tool machining process. In: ECCOMAS Conference 2017, Prague, 19–22 June 2017
12. Gugnon, F., Ghasempouri, M., Armendia, M.: Machine tools mechatronic analysis in the scope of Twin-Control project. In: NAFEMS World Congress 2017, Stockholm, 11–14 June 2017 13. Berglind, L., Plakhotnik, D., Ozturk, E.: Discrete cutting force model for 5-axis milling with arbitrary engagement and feed direction. Procedia CIRP 58, 445–450 (2017)


Chapter 7
Data Monitoring and Management for Machine ToolsThis chapter is structured as follows. After a brief introduction, an overview of the equipment to be monitored and integrated in Twin-Control is presented. The
T. Fuertjes (B)
MARPOSS Monitoring Solutions GmbH, Egestorf, Germany e-mail:© The Author(s) 2019 125 M. Armendia et al. (eds.), Twin-Control,


 |
|
UC10 |
|
|||||||||||
|---|---|---|---|---|---|---|---|---|---|---|---|---|---|---|
|
|
SIEMENS 840D PL | ||||||||||||
| Profibus | ||||||||||||||
| UC5 | UC7 | |||||||||||||
| COMAU URANE 25 V2.0 | UC6 | |||||||||||||
| SIEMENS 840D PL | ||||||||||||||
|
UC9 |
|
||||||||||||
| GMTK Geminis VL | UC11 | Basque AMC Zamudio, Spain | ||||||||||||
| Rexroth MTX13VRS | ||||||||||||||
|
||||||||||||||
|
||||||||||||||
| TEKNIKER Eibar, Spain | ||||||||||||||
|
GEPRO 312 | UC1 |
|
|||||||||||
| FAGOR 8065 M | ||||||||||||||
| Industrial |  |
|
|
|||||||||||
| 2 spindles - 3 axis (XYZ) | ||||||||||||||
7.2 Monitored Equipment
Figure 7.1 presents all the machine use cases monitored in Twin-Control project. As it can be observed, a total of 12 machine tools have been monitored. Each of the industrial validation scenarios includes three machines. For the aerospace val-idation scenario, located at MASA aerospace structural manufacturer installations (Agoncillo, Spain), three GEPRO machines were selected as use cases, named as Use cases 1–3. The machines present a similar architecture, but they differ in the number of axes and spindles. For the automotive validation scenario, located at RENAULT automotive component manufacturer (Cleon, France), three COMAU Urane machines were selected, named as Use cases 4–6.
– Use case 9: EMAG machine, located at the ETA-FACTORY (Darmstadt, Ger- many), to test and validate energy efficiency models.
Finally, three additional machines, located at relevant research locations, have been taken to implement Twin-Control features and present them to the scientific and industrial community:
7.3 Implemented Monitoring Architecture
In each use case, monitoring hardware has been installed. Figure 7.2 presents a diagram showing the generic monitoring architecture used in Twin-Control project. However, depending on use case specifications and requirements, this generic archi-tecture is adapted.
| 128 | Business | T. Fuertjes et al. | |
|---|---|---|---|
| warehouse |
Remote platform
Added Acceleration
Sensor
Analogic signals
Fig. 7.2 Generic monitoring architecture applied in Twin-Control project
ARTIS Online Process Recorder (OPR) is connected to the GEM for data storage purposes (240 GB capacity). It is also capable of monitoring non-real-time data using OPC, as a second data source. In addition, GEM and OPR could exchange real-
| 7 |
|
129 |
|---|
As an example, Table 7.2 presents the non-real-time variables monitored by the OPR devices installed in the industrial validation scenarios.
130 T. Fuertjes et al.
ARTIS True Power (TP) module sends power measurements from installed hall sensors to the GEM. CANopen protocol is used to make sure that the signals could be transferred under real-time conditions. The hall sensors are equipped directly at the main power supply of each machine (Fig. 7.6). Through the measuring of all three phases of the main power supply based on the TP module, it is possible to get the machine true power under real-time conditions.
ARTIS Vibration Measurement (VM) module has been also installed in different use cases. Processes accelerometer measurements real-time (internal sample rate of 25 kHz) and sends indicators (e.g. RMS) to GEM through CANopen protocol. For example, automotive use cases were provided with a vibration monitoring with sample frequencies of 25 kHz. To allow a vibration monitoring with sample rates
| 7 | 131 |
|---|
of 25 kHz, a new firmware for the VM module was developed and installed. This firmware stored the vibration data with a sample frequency of 25 kHz at the OPR. Inside the OPR, an automatic analyzing function was developed, which calculate the
132 |
|---|
ARTIS DDU-4K-Wisy (Fig. 7.7) is a new device from MARPOSS Monitoring Solutions that has been installed in the Starrag EcoSpeed machine, located at the AMRC (Sheffield, UK). It consists in a tool holder with embedded force and tem-perature measurement capabilities that is used for in-process force monitoring. The DDU 4K-Wisy is based on a HSK 32 tool holder which is equipped with eight strain gage rosettes each containing two mutually perpendicular grids. Via this measure-ment configuration four different measuring values are captured: torque, axial force and the axial tool holder deflection in two directions (perpendicular). To acquire temperature-compensated signals, each pair of strain gages is interconnected to four separate Wheatstone bridges. To log the generated data, a wireless transmission on the ISM radio band (around 2,4 GHz) is used along with a corresponding radio receiver which either can be connected to ARTIS monitoring devices via CAN bus or to a standard PC via USB.
7.4 Cloud Data Management
Data transfer from machine to the platform requires some flexibility to match with IT and production constraints. Indeed, in factories, machine tools are connected a production Ethernet which is used to exchange synchronization information between machines, gantry, robots and various management and control systems. Depending on the size and the age of the factory, networks can be close to saturation and a continuous transfer of high sampling rate data could impact the network availability and introduce losses of information packets. In addition, from cyber-security point of view, IT department is often reluctant to “connect” production network to the Internet because bad-intentioned people could get into the network and take control of equipment for instance.
In view of theses constraints, various data transfer architectures have been applied according to use cases. In case of laboratory and pilot machine tools, OPR has a direct connection to the cloud platform. For the industrial use cases, intermediate servers have been used, and these servers are connected to the production network and enable local data storage and edge computing. For the aerospace scenario, data from the OPR is automatically uploaded to the local KASEM®platform inside MASA facilities through MASA network; then this server, also connected to the Internet, manages the data transfer to the cloud as depicted in Fig. 7.8. In this case, local server also acted as a partition between machine network and Internet.
Fig. 7.8 Data exchange configuration for the aerospace validation use case
134 T. Fuertjes et al.
| 7 |
|
135 |
|---|
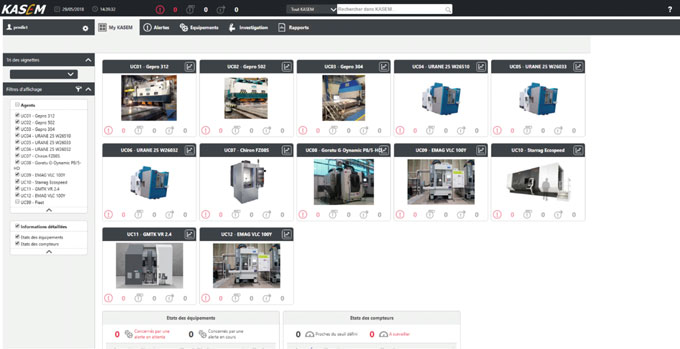
The data monitored at local level is uploaded from ARTIS OPR modules to a cloud platform. The PREDICT’s KASEM®platform has been storing information from most of the use cases during almost two years in Twin-Control project. Hence, the proposed architecture has been validated and has provided an excellent source of real data used as a basis for the rest of developments of Twin-Control.
The capabilities of the installed infrastructure are not limited to data monitoring and storage. In following chapters, other capabilities like advance indicator calcula-tion, fleet analytics and even the possibility to integrate model-based control actions in the machine will be covered.
The images or other third party material in this chapter are included in the chapter’s Creative Commons license, unless indicated otherwise in a credit line to the material. If material is not included in the chapter’s Creative Commons license and your intended use is not permitted by statutory regulation or exceeds the permitted use, you will need to obtain permission directly from the copyright holder.

The behaviour of a machine tool is the set of actions and operations made by the machine sub-systems in conjunction with themselves and the machine environment. The expected behaviour can be defined as the capacity of a machine tool to achieve its objective: to produce parts with specified quality at high production rates [1].
These concepts can be monitored through sensor measurements. The characteris-tics of the sub-systems allow to interpret the expected behaviour from the machine. However, raw data are highly influenced by external and internal conditions. The behaviour of the sub-system can influence the one of another sub-system from the machine tool. By computing contextualized, and comparable over the time, indica-tors, from sensors measurement and machine operating conditions, it is possible to
U. Mutilba
e-mail:E. Guruceta
e-mail:Behaviour indicators extraction of a machine tool can be done continuously by the exploitation of the workpiece program and existing machine sensors, or with specific characterization programs using existing sensors and/or additional sensors. Behaviour continuous monitoring using raw measurements is discussed in Sect. 8.2. The characterization tests of machine tools processed occasionally are discussed in Sect. 8.3. Finally, the conclusions are summarized in Sect. 8.4.
8.2 Extraction from Machining Raw Measurements
| 8 |
|
139 |
|---|
described by the actions of their pumps and tanks where output pressure analysis gives a good representation.
Indicator extraction process from these conditions is detailed in Sect. 8.1.2.
8.2.2 Machine Operating Conditions
140 F. Peysson et al.
TC = Tool Change
M = Move
Fig. 8.2 Machine operating conditions
| 8 |
|
141 |
|---|
Spindle torque
Rather than using the overall dataset to understand the behaviour, indicators based on descriptive statistics are computed to summarize the dataset. The indicators com-monly used to describe a data collection distribution are (Fig. 8.4).
– Thecentral tendencyor centreof thedistributiongivenbythemeanandthemedian.– The dispersion given by the percentiles, extreme values and standard deviation. A percentile is a value below which a given percentage of the data collection falls.
In this section, two examples of indicator extraction are presented. The first one is focused on tool behaviour, based on spindle torque observed in a specific machining step. The second one aims at monitoring axis dynamic behaviour.
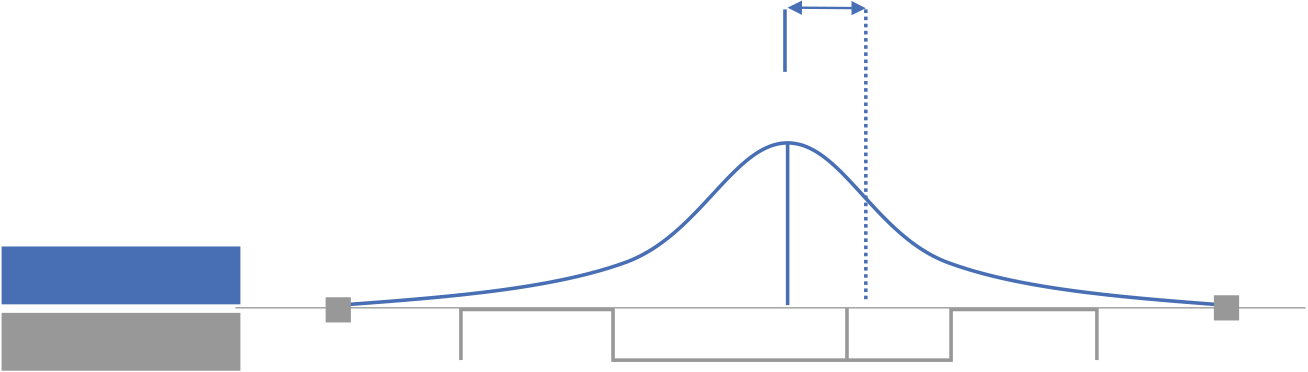
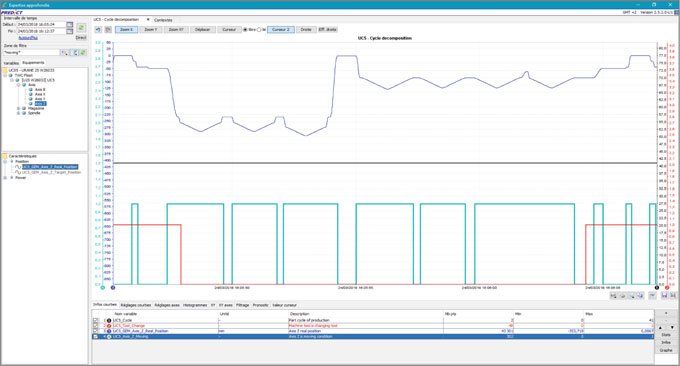


As shown by the Z-axis position, this step consists of successive drilling oper-ations. In Fig. 8.6, the spindle torque associated to this step is represented by the
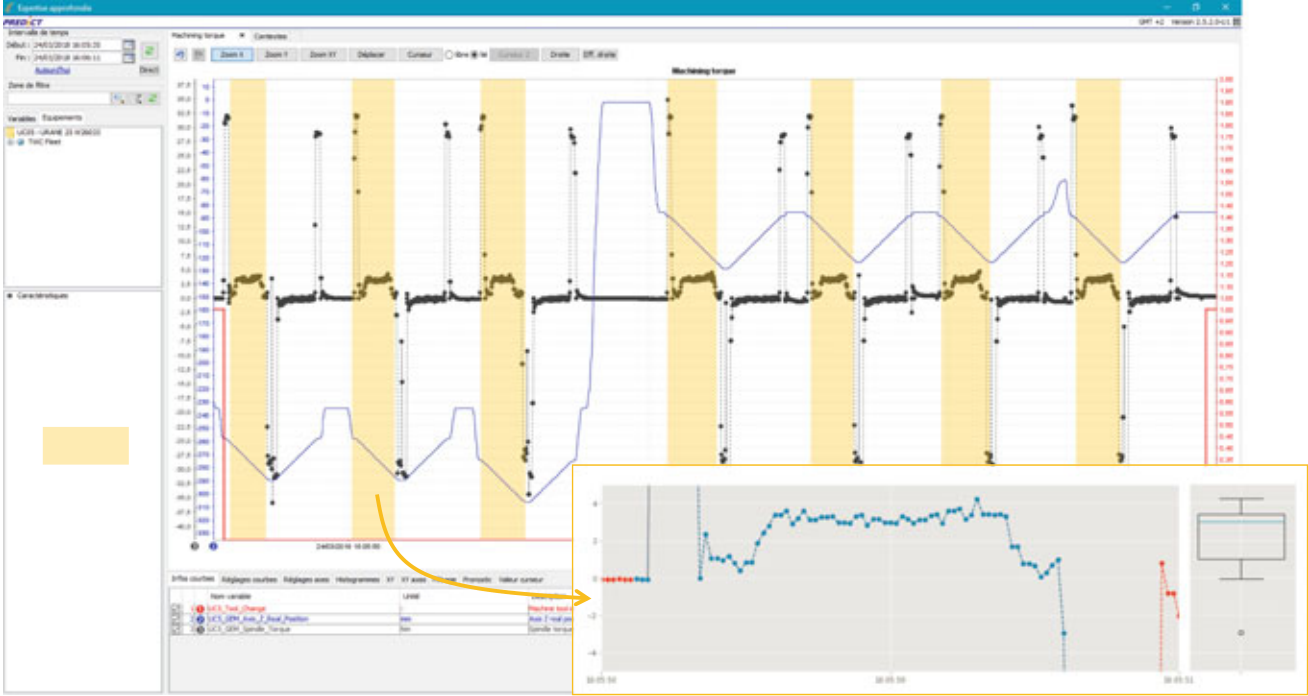
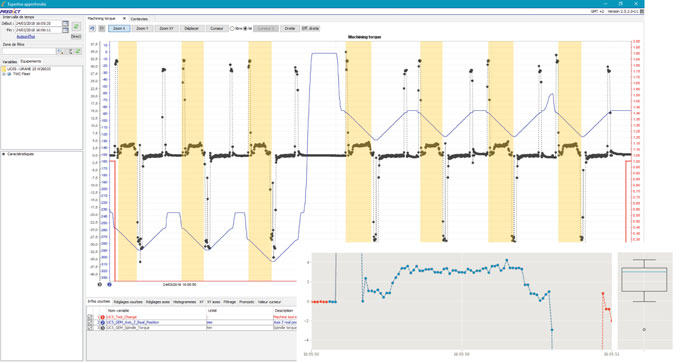
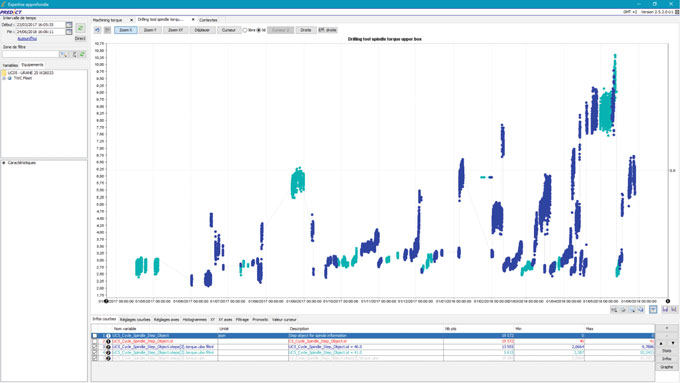


| 8 | 143 |
|---|
Fig. 8.7 Spindle torque drilling upper box indicator for a specific tool
black curve. To capture the tool usage behaviour within this step, the drilling oper-ation should be analysed only when the tool is cutting the workpiece. These phases are marked by the yellow areas.
Thanks to this indicator, it can be observed:
– Tool changes: ruptures are visible each time the tool is replaced.
– Lower whisker characterizes X-axis thrust required to accelerate.– Upper whisker characterizes X-axis thrust required to decelerate.– Mean gives an indicator of axis balance.
In Fig. 8.9, the evolution of X-axis dynamic behaviour is represented, charac-terized by the mean thrust. A specific move for each processed part type has been defined. The exact same conditions could not be found between the two parts types’
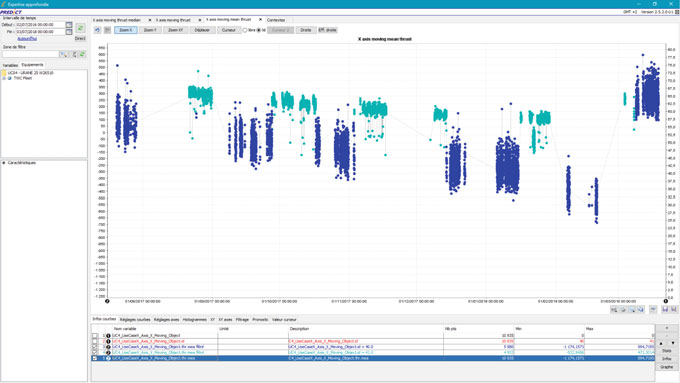
The analysis of indicators obtained from raw measurements during conventional machining operation is sometimes difficult, especially when trying to determine the condition of the machine tool. Perturbations, like the machining process itself, can hide the real performance of the machine tool. In addition, it is sometimes difficult to get repetitive movements from which comparable indicators can be obtained, especially in small batch sectors like aerospace.
In this line, a characterization procedure for machine tools has been defined, validated and implemented in Twin-Control project. The objective is to provide the opportunity to the end-user to perform a very simple and fast characterization of the machine tool, under controlled conditions. This way, a periodic checking is possible, leading to a better track of machine tool condition over time.
| 146 | F. Peysson et al. | |
|---|---|---|
| 8.3.1 |
As a reference, four measurements per year are suggested, one every three months. However, depending on the results of the volumetric performance indicator, archi-tecture of the machine and workshop ambient conditions, the frequency of the tests could be varied and adapted on each case.
Diagonal positioning measurement in medium-large machine tools requires from an interferometry laser-based measuring system with the capacity to do the tracking of a mirror/retroreflector placed on the machine tool spindle. Either laser tracer or laser tracker measures the relative movement/displacement of a retroreflector from the initial point, based on their interferometry laser-based system. Both measuring devices can track a retroreflector placed on the machine tool´s spindle, allowing the measurement of machine tools movement in a fast and easy way, without special set-ups or fixing tools. This is the main advantage compared with common laser interferometry, which requires a tricky set-up process for this kind of measuring procedures where several axes of the machine tool are interpolated to create a special diagonal.
Fig. 8.10 Two opposite diagonal measurements [2]
| (a) | (b) | ||||||||||
|---|---|---|---|---|---|---|---|---|---|---|---|
| 2000 | |||||||||||
| 1000 | 1000 | 2000 | 3000 | 4000 | 5000 | 6000 | 7000 | 8000 | 0 | ||
| 0 | |||||||||||
| 0 |
Figure 8.12 shows the results obtained for the GEPRO 502 machine with the com-plete volumetric characterization and the diagonal measurement. A direct correlation between both measurements exists since the machine tool’s maximum volumetric positioningerrorisbetween250and300µmforbothcases.Whenvalidatingdiagonal measurement against the volumetric mapping of each machine, it can be concluded that positioning error correlates properly between results, but perpendicularity does not. It seems that the model that converts diagonals into positioning and perpendicu-larity errors does not fit to the model of the volumetric error modelling. Anyway, for
148 F. Peysson et al.
The main objective is to carry out a fast and reliable “health check” of the machine geometric performance, verifying whether the relative position/orientation between the machine tool coordinate system and the working volume is within the expected tolerances, using an artefact as a reference for the measurements.
The procedure consists of measuring the centre or position of several features (e.g. spheres) of an artefact located in the working volume with the touch probe and the corresponding software that allows doing the measurement. The proposed measuring process is automatic (using a CNC macro) and suitable to have the chance to export the results from the CNC.
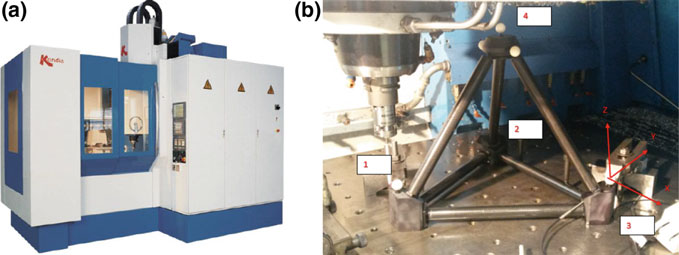
Fig. 8.13 a KONDIA MAXIM machine tool; b artefact mounted in the machine
The objective of this test is to control the dynamics stiffness of the machine tool. A hammer test is proposed to evaluate the dynamic performance of the machine tool [5].
On the one hand, the force sensor at the hammer serves to provide a measurement of the amplitude and frequency content of the energy stimulus that is applied to a test object. On the other hand, accelerometers are used to measure the machine’s structural response due to the hammer force. A single triaxial accelerometers located at the spindle will be used. A multichannel Fast Fourier Transform (FFT) analyser is needed to carry out the signal acquisition, sensor conditioning and FFT processing.
A complete modal analysis has been carried out on the GORATU D-Dynamic machine located in IK4-TEKNIKER. Modal analysis consists of the experimental identification of vibration mode frequencies and the correspondent mode shapes. To do that, the machine is hit by a hammer and the vibrations are measured by accelerometers located in all the structure of the machine as depicted in Fig. 8.15.
Figure 8.16 presents the frequency response of the different points of the machine in X-direction when the disturbance, i.e. hammer force, is also done in X-direction. Two main resonance frequencies are identified, at 82 and 124 Hz. When using a single accelerometer at the tool tip, which is the aim of the proposed test, the frequencies will be accurately identified, since the obtained curve is part of the bunch of curves presented in the previous part. However, the measurement of a single point will not be enough to represent vibration mode shapes, but this is not the aim of the proposed periodic measurement.
| 8 | 151 |
|---|
Fig. 8.16 Frequency response diagram showing vibrations of the different points of the GORATU machine in X-axis when excited in X-axis
8.3.4 Feed Drive and Spindle Auto-Characterization
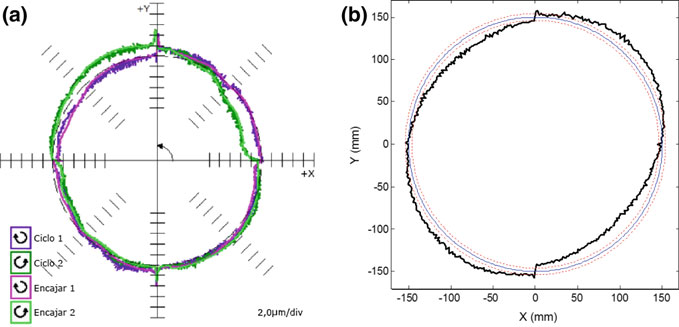
Fig. 8.17 Validation of the circular interpolation test from the feed drive auto-characterization procedure. Results obtained in a circular interpolation of the X- and Y-axes of the GORATU G-Dynamic machine: a results from the report available after the ball-bar test; b results obtained by using internal sensors for measurement
| 8 | 153 |
|---|
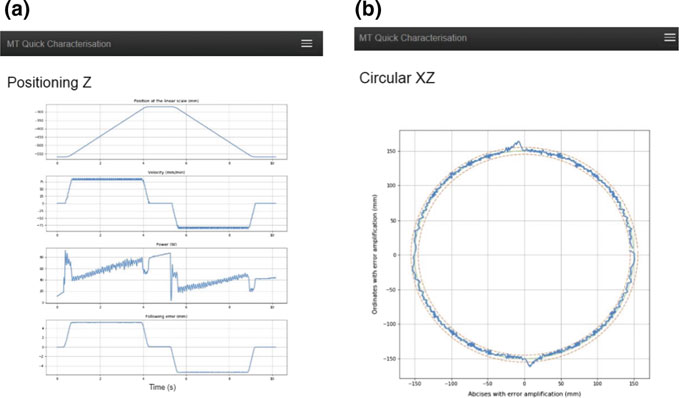
Fig. 8.18 Sample of the machine tool characterization test report generated on KASEM®after the auto-characterization: a linear translation of the Z-axis; b Circular interpolation of X- and Z-axes
The behaviour of a machine tool is observable by computing contextualized infor-mation from sensors measurements. Two indicator extraction methodologies were described in this section. The first one exploits the in-production sensors’ measure-ments to extract statistical features from specific machine operating conditions, and
154 F. Peysson et al.
References
1. Tlusty, J.: Dynamics of high speed machining, ASME J. Eng. Industry 108, 59–67
2. ISO 230-6.: Test code for machine tool—Part 6: setermination of positioning accuracy on body and face diagonals (Diagonal displacement tests) (2002)
3.
4.
5. 10) 6. ˇCep, R., Malotová, S., Kratochvíl, J., Stanˇceková, D., Czán, A., Jakab, T.: Diagnosis of machine tool with using Renishaw ball-bar system. MATEC Web Conf. 157, 01006 (2018)
7. Armendia, M., Euhus, D., Peysson, F.: Twin-control: a new concept towards machine tool health management. In: 3rd European Conference of the Prognostics and Health Management Society.


Chapter 9
Non-intrusive Load Monitoring
on Component Level of a Machine Tool Using a Kalman Filter-Based
Disaggregation ApproachJ. Sossenheimer (B) · T. Weber · D. Flum · N. Panten · E. Abele PTW TU, Darmstadt, Germany
e-mail:T. Weber
e-mail:© The Author(s) 2019 155 M. Armendia et al. (eds.), Twin-Control,
156 J. Sossenheimer et al.
(1) Hardware-based measurements (intrusive) (2) Non-intrusive measurement techniques.
Hardware-based measurements of power and energy at component level require high investments in sensors and the associated devices. Non-intrusive measurement methods such as non-intrusive load monitoring (NILM) or non-intrusive appliance load monitoring (NIALM) [6] can be a cost-effective solution for obtaining detailed energy data using a power disaggregation. The NILM measurement method can detect individual devices within the performance data by analysing voltages and cur-rents from a higher-level single point of measurement. Since the individual devices have different properties for steady-state and transition states in both reactive and active power, these so-called energy signatures can be used to assign the measured power to an individual component. At the point of common coupling (PCC), the loads of the devices are superimposed and then the individual curves are extracted from the aggregated data by pattern detection algorithms. In addition, control data of inferior components can be used to estimate the individual load using system identi-fication approaches [7]. In this way, the Kalman filter-based disaggregation approach presented in this chapter allows a continuous energy monitoring at component level of machine tools with only one sensor needed at the machine tool’s electric PCC.
9.3 Kalman Filter-Based Disaggregation Approach
The goal of the Kalman filter is to determine system states as accurately as possible, which can only be calculated and measured with an uncertainty. The Kalman filter works with a prediction step and a correction step. In the prediction step, the desired states of a system are calculated using a state-space model. In the meantime, the uncertainty of the result is calculated from the initial uncertainty (covariance) and an estimation error representing the inaccuracy of the calculation. In the correction step, the estimated value and the measured value are compared, while both contain an inaccuracy. The estimated value and the uncertainty can be set using R. E. Kalman’s algorithm as shown in [15].
Calculated Power of
the Components, that
are switched ON
Fig. 9.1 Information flow chart of the applied Kalman filter
| 9 |
|
159 |
|---|
increasingly less affected by fluctuations in the measured total power, while dynamic loads continue to allow performance adjustments.
9.4 Implementation and Validation of the Presented NILM Approach
The online monitoring is implemented by integrating the disaggregation algorithm into an existing process and tool monitoring system called Genior Modular of MAR-POSS Monitoring Solutions GmbH. This monitoring system can be supplemented with additional sensors by adding additional transmitters. In this case, a transmitter for measuring the total power consumption of the machine is connected to the Genior Modular via CANopen communication. The integration of embedded software, like in this case the disaggregation algorithm, is realised by an additional OPR device of MARPOSS Monitoring Solutions GmbH. Because an existing data acquisition and analysis architecture can be used, the effort for the user and costs are reduced. In this
• hydraulic pump
• chip conveyor
• cooling lubricant pump
• suction
• electric control cabinet
• combined other consumers.
The hydraulic pump, the suction and the electric control cabinet are classified as a constant consumer, while the cooling lubricant pump is a dynamic consumer. Both consumer types are constantly switched on during machining. The chip conveyor is a constant consumer which is switched on or off sequentially during the manufacturing process. All other dynamic and constant auxiliary units of the machine tool are summarized under combined other consumers. These combined other consumers are attributed with higher measurement uncertainties than normal consumers. In addition, the measurement uncertainty is increased or, respectively, decreased with each switch-on or switch-off process in order to absorb the load peak that occurs.
| 9 |
|
161 |
|---|
The example of the chip conveyor clearly shows how the sensitivity of the algo-rithm decreases over the time in which the component is switched on (second diagram in Fig. 9.2). While the disaggregation is initially falsified by other disturbances dur-ing the first switch-on process, the required power of the chip conveyor is better met during the subsequent switching processes and is ultimately properly trained. The teach-in phase can be better used with sequentially switched consumers, since the individual switching processes are each accompanied by the interference of varying intensity, which is why the actual power requirement is met more accurately.
| 9 |
|
163 |
|---|
9.5 Conclusion and Outlook
The presented cost-effective disaggregation approach to monitor the energy con-sumption at component level is possible through the use of a Kalman filter with the information of the component’s switching states and the overall power consump-tion. The approach was tested on a laboratory machine tool and validated with a
Even if an exact power disaggregation of industrial components is difficult, the presented approach offers a cost-effective and simple possibility to estimate the energy demand on component level. Further investigations are necessary to decrease the influence of the limitations in order to increase the accuracy of the power disag-gregation.
References
8. Comput. 10(1), 28–39 (2011)
9. Iyer, S.R., et al.: Energy disaggregation analysis of a supermarket chain using a facility-model.Energy Build. 97, 65–76 (2015).
10. Sankara, A.: Energy Disaggregat Missouri Uni- versity of Science and Technology, Rolla, Missouri (2015)
11. Zoha, A., et al.: Non-intrusive load monitoring approaches for disaggregated energy sens-
12. industrial application. In: Xuan-Tu, T. (Hg.) International Conference on Advanced Technolo- gies for Communications (ATC), pp. 10–12, Hanoi, Vietnam, pp 23–27 (2012)
13. Gebbe, C., et al.: Estimating machine power consumptions through aggregated measure-


Chapter 10
Utilizing PLC Data for Workpiece Flaw Detection in Machine Tools
Internal machine data such as PLC and bus data can be used not only for process control, as is usually the case, but also for condition and quality monitoring, as well as energy efficiency [1]. In addition, data analysis can prevent high economic losses due
J. Sossenheimer (B) · C. J. H. Bauerdick · M. Helfert · L. Petruschke · E. Abele PTW TU, Darmstadt, Germany
e-mail:© The Author(s) 2019 167 M. Armendia et al. (eds.), Twin-Control,
168 J. Sossenheimer et al.
Furthermore, there are some model-based prediction methods for surface rough-ness in machining processes [13, 14], but there are no known methods for identifying typical workpiece flaws from pre-processing like moulding or forging. Typical flaws of these pre-processes are listed in [15, 16]. Based on previous work, which showed that workpiece flaws can be detected through drive-based PLC data [1], this chapter outlines an automated method for monitoring workpiece quality using machine drive-basedsignalsinmachinetools.Becausetheanalysedsignalsaresensitivetotoolwear, this aspect is examined in the second part of this chapter.
10.2 Automated Quality Monitoring Using Drive-Based Data
| 10 | 169 |
|---|
10.2.1 Information Flow and Evaluation Process
To control the movements of the axis, the actual values of the machine drives are constantly measured at the frequency inverter and transmitted to the PLC via the fast automation bus Sercos. The signal flow and the evaluation workflow are shown in Fig. 10.1.
10.2.2 Sensitivity Analysis and Signal Processing Steps
A sensitivity analysis was carried out to select appropriate drive-based signals for evaluation. Available signals include the current values of position, speed, power, force and momentum of each axis. In addition to the actual position of the spindle, which is needed to locate the flaw on the workpiece, the following five signals form a feature vector that represents the input for the analysis:
| calc.signali � |
|
(10.1) |
|---|
The peaks of the signals caused by the flaws can be easily detected in the cal-culated signal, as depicted in Fig. 10.2. The calculated signal for the five analysed characteristics is plotted over the radius of the workpiece for the facing process of the full cylinder, whose bores have a diameter of 2.0, 1.5 and 1.0 mm, respectively,
Possible workpiece flaws are detected if the calculated signal exceeds the narrow-est tolerance bands. With the corresponding actual position information of the feed and spindle axis, the potential workpiece flaws are localized in the next step. In order to quantify the potential workpiece flaw, a new parameter called intensity of diagno-sis IoD was introduced. The IoD indicates the accuracy of the flaw diagnosis and the distribution of the IoD over the workpiece’s surface can give more detailed insight into the flaw’s size. According to Eq. (10.2), the IoD is the quotient of the number of features F that simultaneously manifest a trespass of the smallest tolerance band and the total number of features Ftot multiplied by the quotient of the number of the largest tolerance band T of all features that was trespassed and the total number of tolerance bands Ttot times one hundred. If the workpiece shows frequent and locally concentrated of measurements with a high IoD,
| IoD �F Ftot | ∗T Ttot |
|
(10.2) |
|---|
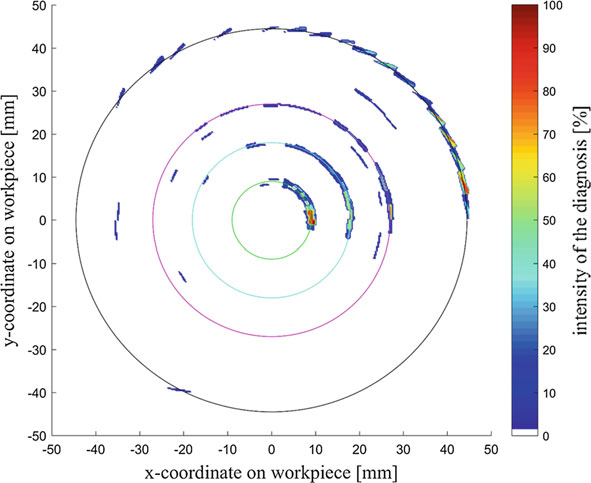
The face scrubbing of the unmachined workpiece is characterized by moderate cutting speeds and feed rates with simultaneously high cutting depths. Therefore, the
| 174 | J. Sossenheimer et al. | ||
|---|---|---|---|
| Fig. 10.4 Close-up view of the intensity of the diagnosis IoD on the virtual image of the workpiece, where the diameter of the boreholes is indicated by | |||
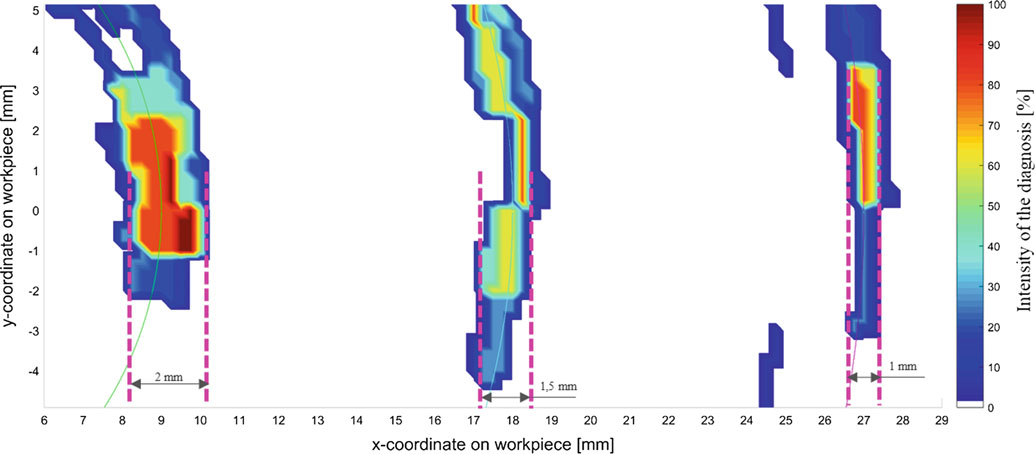
accuracy of the diagnosis proved to be better than with the finishing steps, which use high cutting speeds, low feed rates and very small cutting depths.
Flaws on the side surface of the unmachined part were not detected during the exterior scrubbing, because the flaw’s influence on the signal is negligible compared to that of the initially not perfectly round rotating unmachined part. At each revolution of the workpiece, the signals of the five features show large oscillations due to the fact that the flaw, which is located at a covered distance of 7.7 mm form the exterior scrubbing process, cannot be identified. This is seen in Fig. 10.5, which shows the relation between the actual position and the power of the spindle. The flaw could have been detected in the second turning step if the exterior scrubbing process of the unmachined part was divided into two steps each with half of the current cutting depth.
parameters are selected with regard to the face scrubbing process of the hydraulic control disc in order to examine ten different cutting parameter combinations. Based on the basic process parameters listed in Table 10.1, one parameter is modified within a certain range, and the other two parameters are maintained constant (Table 10.2). Considering the differences between the material of the cylinder and the hydraulic control disc, a cutting depth (ap) of 1.5 mm is used as basis.
As also [18, 19] describe, the main influence on tool wear results from an increas-ing cutting speed. An increase of the feed rate leads to an increase of the surface roughness but has no essential impact on the tool wear, which corresponds with the results of [18, 20]. By increasing the cutting depth neither the surface roughness nor the tool wear is affected significantly, as is also the case with [18, 21]. In accor-dance with [21, 22] an increase in each of the analysed cutting parameters leads to a reduction in specific energy consumption by increasing the material removal rate.
| 10 | 177 |
|---|
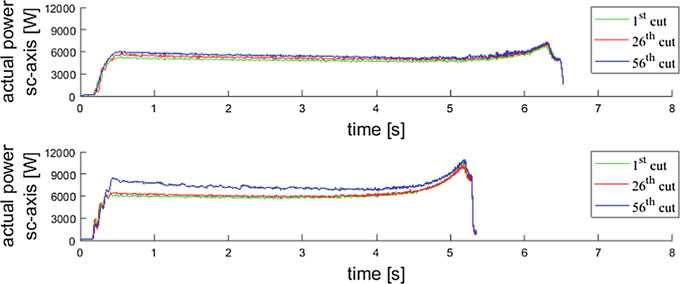
Fig. 10.6 Actual spindle power (sc-axis) with cutting parameter combination A (upper figure) and B (lower figure) according to different numbers of cuts
The data is collected in one measurement and is available both for improving the flaw detection algorithm by automatically adjusting the barriers as tool wear and with it signal noise increases, and for automatic and proactive identification of worn inserts.
10.4 Conclusions
Data. The Data Economy Demands a New Approach to Antitrust Rules. Regulat-
5. Lohsse, S., Schulze, R., Staudenmayer, D.: Trading Data in the Digital Economy Legal Con- cepts and Tools. Nomos/Hart (2017)
| 10 |
|
179 |
|---|
The images or other third party material in this chapter are included in the chapter’s Creative Commons license, unless indicated otherwise in a credit line to the material. If material is not included in the chapter’s Creative Commons license and your intended use is not permitted by statutory regulation or exceeds the permitted use, you will need to obtain permission directly from the copyright holder.

11.1 Introduction
The simulation of machining operations in close interaction with the machine tool dynamic behaviour requires two main modelling components. First, to accurately simulate the dynamics of modern high-speed machine tools, a mechanical model that represents the flexibility of all components and their interactions is needed [1]. To create this mechatronic model of a machine tool (virtual machine tool), 3D MBS and FEA methods are used for mechanical aspects and 1D modelling for the CNC. As described in Chap. 2, an integrated methodology is proposed for the mechani-cal aspects, and it combines MBS capabilities in a nonlinear FEA [2] solver called SAMCEF Mecano [3]. It enables accurate modelling of the machine by considering FEA models of the components connected by a set of flexible kinematical joints. Additional models are implemented to deal with drive-trains and motors dynamics. Furthermore, an integrated cutting force model is used to capture force interac-tions between the tool and the workpiece to fully capture the dynamic behaviour of the machine tool. Within the scope of the Twin-Control project, the VMT concept was used to model two machines, a high-speed four-axes box-in-box machine from Comau and a large three-spindle five-axes machine from Gepro. The two models are shown in Fig. 11.1.

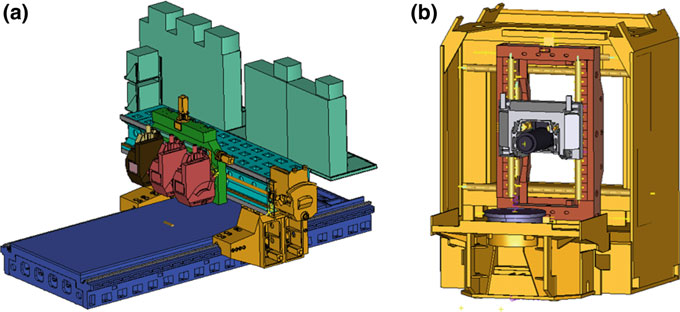
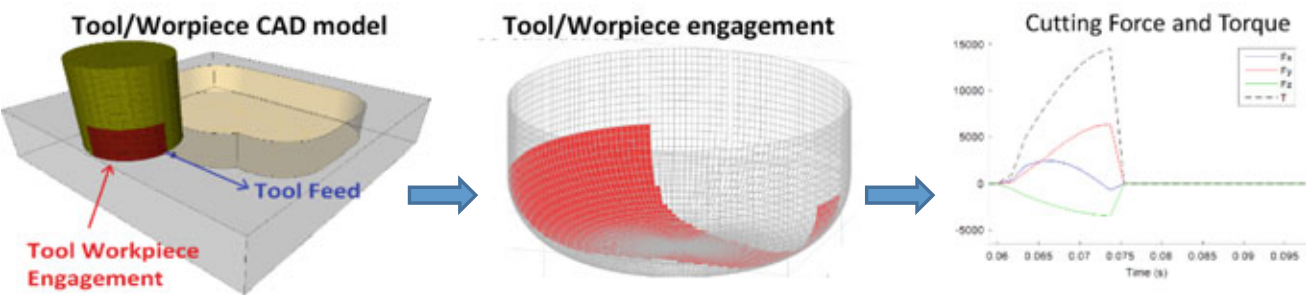
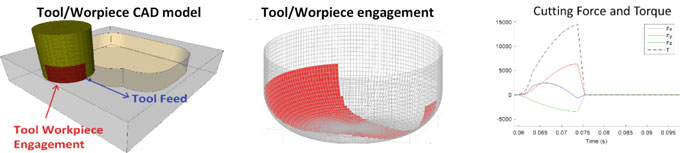
184 F. Cugnon and J.-P. Delsemme
Fig. 11.2 Cutting force estimation approach
The mechanical model of the machine tool is coupled with three additional simula-tion modules (Fig. 11.4). For the CNC modelling, a MATLAB Simulink model that is converted to C-code is used and included in a dynamic library thanks to MATLAB Coder capabilities. As the cutting force module is also based on MATLAB pro-gramming, the same approach of creating a dynamic library from C-code generated by MATLAB Coder is selected. The simulation C++program for tool-workpiece engagement (TWE) computation is also converted to a dynamic library that can be called from C-code functions.
186 F. Cugnon and J.-P. Delsemme
| 11 |
|
187 |
|---|
computed kinematics projected in the workpiece reference frame. According to a user-defined cut length, TWE is updated as soon as (Tc time) the tool as moved of this characteristic length since previous update. For accurate TWE computation, the cut length should be chosen significantly bigger than the spatial discretization used in ModuleWorks software. As TWE computation changes the workpiece geometry when a cut is performed, the corresponding DLL can only be called once during the considered cut. The flow chart of Fig. 11.5 has been implemented to combine this constraint with the need of having a strong coupling between the machine model and the cutting forces.
11.4.1 Simple Machining Process with the High-Speed Box-in-Box Machine
The model of an Urane 25V3 machine from Comau is used to demonstrate that the VMT concept allows simulating a machining process, considering the virtual machine tool in its real conditions, accounting for all interactions between mechani-cal, control and machining [5, 6]. Thanks to the dedicated TOOL element, the inter-action between the tool and the workpiece (rigidly attached to the machine plate—see Fig. 11.6) is defined.
Some simulation results are shown below. Figure 11.7 shows forces generated by the linear motors to realize the manufacturing process. It can be noticed that these forces are mainly caused by both machining and inertia forces. Figure 11.8 shows the position of the tooltip along the three-axes of the machine with three different scales corresponding to the min-max range of each measure, the magnitude of X-axis vibration is no more than a few microns, while Y-axis magnitude is 110 mm.
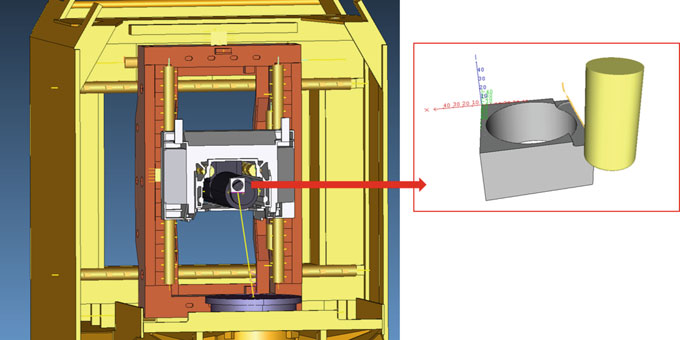
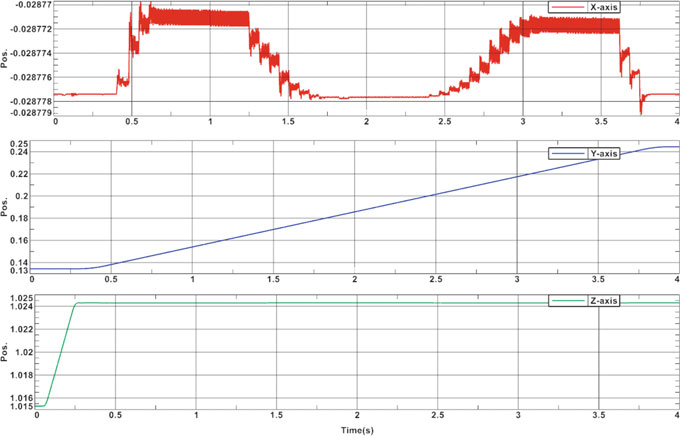
Fig. 11.8 Tool positions calculated in the simulations done in the high-speed box-in-box machine
Finally, some sensitivity analyses highlighted the influence of the manufac-turing conditions on the cutting forces. Figure 11.11 compares the cutting force 3.8 m min−1—blue) and deeper cut (7 mm—green). Shown results are average force along the move direction in 3 different cases: nominal (red), faster move (v �computed as post-processing results from the TOOL element.
11.4.2 Machining Process with Tool Change on a Multi-spindle Machine
| 11 | 191 |
|---|
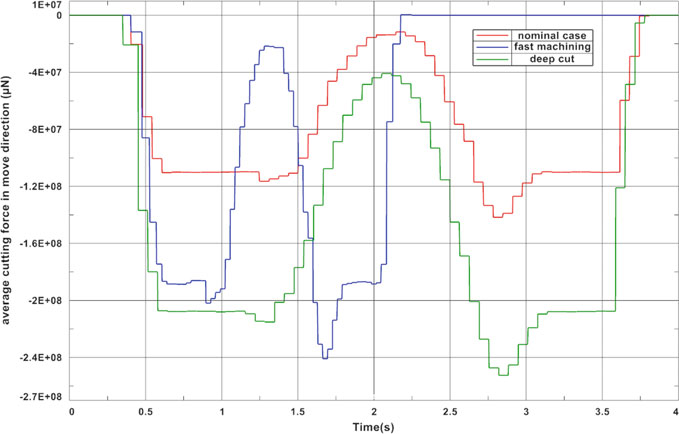
Fig. 11.11 Influence of machining conditions on cutting forces
• Spindle 2 (centre) is equipped by an end-milling tool (Diameter 12 mm–two cut-ters–corner radius 6 mm).
• Z-axis is moved down to have a 4 mm cutting depth.
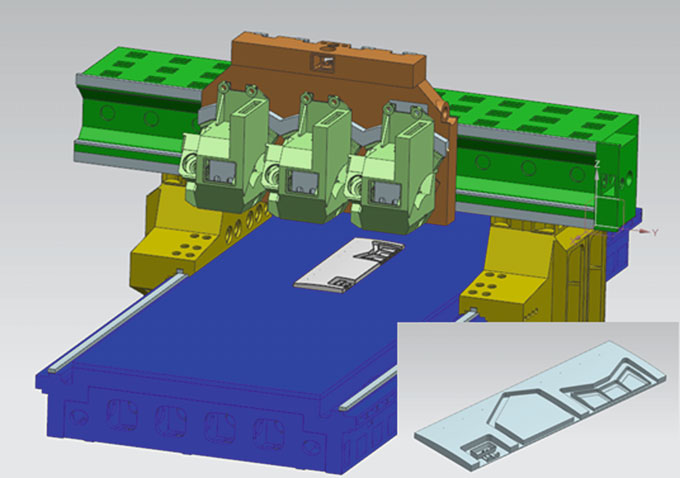
Figure 11.15 shows the evolution of the cutting forces at the tool level (upper graph) during the machining process, and the associated spindle torque (lower graph). Figure 11.16 shows tooltip position, where successive zooms highlight mechanical vibration at both structural natural frequencies of the structure and cutting frequency.
194 F. Cugnon and J.-P. Delsemme
This machining sequence of about 1 min is simulated in about 2 h on a normal lap-top. Even if far away from real time, this is acceptable for this kind of accurate model (142,000 time—steps–4176 degree of freedom) used for designing new machine or preparing machining sequence, but not for on-line monitoring.
| 11 |
|
195 |
|---|
196 F. Cugnon and J.-P. Delsemme
References


Chapter 12
Cyber-Physical System to Improve Machining Process PerformanceIn addition, there is always some margin to improve the performance of a designed process once it is in production, for example, feed rate increase to increase productiv-ity or feed rate reduction when process does not go as expected (e.g. chatter occurs)
M. Armendia (B)
IK4-Tekniker, C/Iñaki Goenaga, 5, 20600 Eibar, Gipuzkoa, Spain e-mail:© The Author(s) 2019 197 M. Armendia et al. (eds.), Twin-Control,
198 M. Armendia et al.
Learning-based process monitoring is a key feature of ARTIS process monitoring systems. The process monitoring is based on process signals of the machine control. Furthermore, the process monitoring could be based on additional sensor signals (e.g. vibration and force). Genior Modular is the main module of ARTIS hardware. In this module, the interface to the machine control as well as the HMI is provided. The process monitoring algorithm and the determination of the limits and parameters are calculated on the Genior Modular device, as well. For the user, the QNX-based Genior Modular provides anintuitiveHMI toconfiguratetheprocess monitoringtask. The system determines all limits and parameters automatically. Additional input keys provide the possibility of making certain adjustments. In detail view display mode, these input keys are immediately visible. In multi-view display mode, it is necessary to first select one of the windows in order to make the keys visible. The user has the possibility to manually adjust the limit, being less or more sensitive to process changes.
For the learning process, some reference processes must be executed in advance. The system calculates automatically how many learn steps must be performed. Apart from that, a manual adjustment of the learning process repetitions is possible.
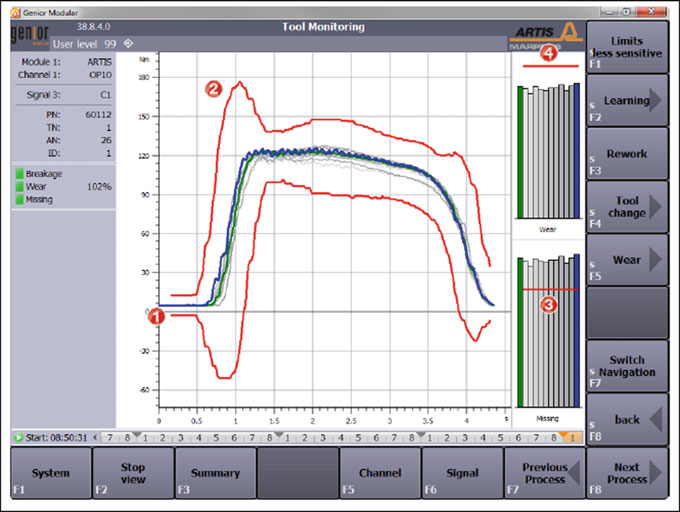
Fig. 12.1 Genior modular visualization for process monitoring
Measured axis positions and spindle speed are used as input of the models which provide spindle torque estimations. These estimations can be compared to spindle torque measurements that are also done by the ARTIS equipment (Fig. 12.2).
200 M. Armendia et al.
The knowledge of machine tool condition is very useful for maintenance activity planning. Early detection of (possible) problems in the machine tool allows more efficient maintenance actions, maximizing machine uptime.
Early detection of future anomalous situations with the machine tool avoids unde-sirable machine tool breakage, and consequent unforeseen production stops.
| 12 | 201 |
|---|
Fig. 12.3 Screenshot showing the Twin-Control process models GUI, fed with real input data coming from the machine. The estimations are directly compared with measurements of the real process, presented in lower right corner
estimate the remaining useful life (RUL) of the critical components of a machine tool by accounting for the real usage (monitored) conditions. The end-of-life models could be integrated at local or fleet level. For Twin-Control, KASEM has been the choice for this implementation. When the RUL estimated by the end-of-life model falls below a predefined limit, KASEM generates a warning towards the planning of a maintenance action (change of bearing or spindle).
As an alternative to the automatic modification of machining conditions, since manufacturers do not want to decrease productivity automatically, a warning showed by the ARTIS HMI or the ARTIS telegram remote control will suggest the operator with some new cutting conditions.
12.4 Energy Monitoring System on Component Level
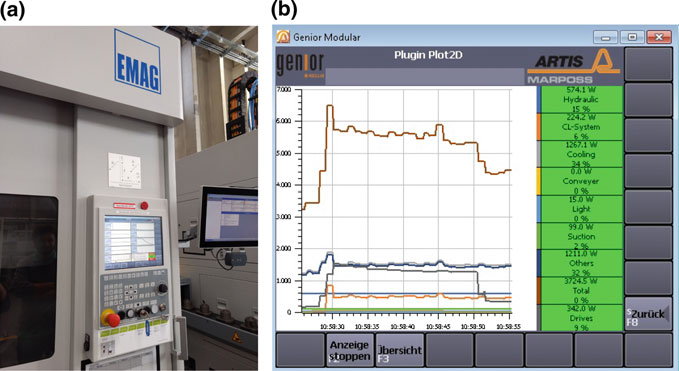
Fig. 12.4 Visualization of the component energy monitoring: a machine HMI; b ARTIS GEM-Visu
With this approach, it is possible to get information about the status of each con-nected device (e.g. serial number, number of alerts, IP address) without a physical connection to it. Furthermore, it is also possible to interact with the GEM device (Fig. 12.5). Based on the configuration of the telegram adapter, monitoring configu-rations could be adapted via smart devices or PCs.
The telegram adapter could be installed in the GEM device or the OPR. Also, it is possible to install the telegram adapter at a plant server or PC, which has a network connection to the monitoring hardware. For connecting the monitoring hardware with a chat group, in the telegram adapter, just the IP address of the target GEM device must be configured.
Adaptive feed rate control has been implemented in the GEPRO 502 machine of MASA. This way, when the spindle is underworking, the feed rate is increased; when the spindle is overworking, the feed rate is reduced. The objective is to maximize
204 M. Armendia et al.
During real machining operations, process visibility is often limited due to small safety windows or high coolant flow. Apart from that, due to undefined position of additional equipment (fixture, toolholder, workpiece, etc.) in the machine tool work-ing volume, collisions are common. Both issues are very critical from the operator’s point of view. To overcome these problems, the availability of a virtual representation of the machine tool, replicating the movements that the real machine is executing, can be very useful.
Material removal simulation is performed within ModuleWorks libraries, for which the proper simulation environment must be established first. The simulation models require the following parameters: the initial geometry of the stock material, geometric definition of the cutting tools, machine tool kinematics and a sequence of the commanded machine axis moves. Once the virtual machining set-up being initial-
| 12 | 205 |
|---|
206 M. Armendia et al.
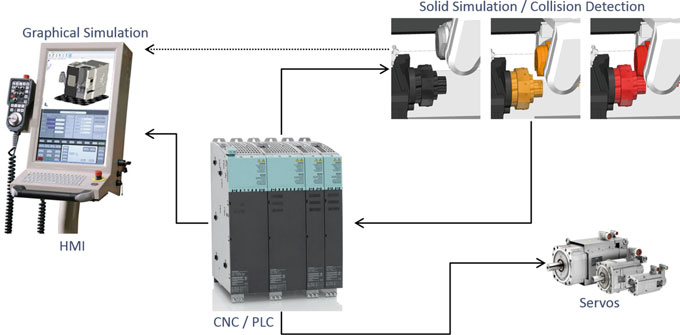
CAS integration has been proved to be an efficient solution to withstand colli-sion risk with different operational modes in machining critical components. Huron, a leading French manufacturer of very high-performance 5-axis machining cen-tres for continuous machining of complex parts, has integrated CAS into Huron’s
high-performance product lines, including KX 50 L, a high-performance double column machining centre, and K3X 8 FIVE, a machine from the range of very high-performance 5-axis bridge-type machining centres.
12.8 Conclusions
References
1. Berglind, L., Plakhotnik, D., Ozturk, E.: Discrete cutting force model for 5-axis milling with arbitrary engagement and feed direction. Procedia CIRP 58, 445–450 (2017)
2.
3.
4. ication of CPS in machine tools. In: Jeschke, S., Brecher, C., Song, H., Rawat, D. (eds.) Industrial Internet of Things. Springer Series in Wireless Technology. Springer, Cham (2017)
Chapter 13
Fleet-Wide Proactive Maintenance of Machine ToolsFlavien Peysson, Christophe Mozzati, David Leon, Quentin Lafuste and Jean-Baptiste Leger
D. Leon
e-mail:Q. Lafuste
e-mail:
Originally referred to a group of ships or aircrafts [1], the term fleet is used in the industrial domain to refer to a set of machines, generally the whole of an owner’s system. Technically, the fleet is considered as set of entities composed of similar sub-systems which behaviours are comparable [2]. From the capacity to process a work-piece being the objective of a machine tool, the objective of a fleet of machine tools is considered as its capacity to process a batch of workpieces. Fleet-wide approach of objectives is then twofold: to provide augmented and synthetized information at a fleet level and to provide higher diagnostics and prognostics capacities.
The condition-based monitoring allows to monitor the global behaviour of the fleet, i.e. its capacity to achieve its objectives, by providing indications of the health state of each sub-system. Monitoring the behaviour at a fleet level aims at inform-ing maintenance operators and managers about the health and availability of each machine, as well as the global fleet by merging and extracting information from indicators.
| 13 |
|
211 |
|---|
isons while not being invasive for users. A knowledge base uniting semantic and systemic approach of the fleet must be considered.
In the process of modelling the fleet level using a semantic approach, each level is defined in a vertical approach while clearing the concepts that allow health status def-initions and horizontal comparison of the different levels of the fleet. First, different levels are identified, from each a set of definitions and concepts arises, as depicted in Fig. 13.1.
Focussing first on the machine tools level, its definition is given by “a machine driven by power that cuts, shapes or finishes metals or other materials” [4]. As a large number of machines and concepts could be included in this definition, this work is focused on the general concepts emerging from modern machines tools powered with electrical power and composed of at least one electro-spindle and at least three axes. At this level, the availability of the machine will be consolidated with information concerning the health status of the sub-systems to describe the general status of the machine [5].
|
Spindle |
|
|---|
|
Motors | Axis |
|
Raw data | |
|---|---|---|---|---|---|
equipment (axis in this example). Four levels to classify the contextual information are discussed in [6] to provide comparison facilities:
• Technical context is the description of a system in terms of technical features. For instance, the three linear axes are composed of linear motor, sliding system, guideline, cooling system associated, etc. Even if the design and dimensions of the component are different, this description allows comparisons of the features of the linear axis to be considered.

| Electrical | Deg. | Output flow | ||
|---|---|---|---|---|
|
||||
|
Electrical | |||
| Mechanical | ||||
| Thermal | ||||
|
Equipment
The semantic definition, while being indispensable to the fleet description, is not sufficient by itself to describe properly the interactions occurring between the sub-systems at different levels, especially for diagnostic purpose. The representation on Fig. 13.2 summarizes the interactions of an equipment with its environment. The input flow coming from other sub-systems can influence the functions associated with the equipment as the output flows depending of the function influence the functions depending on them. A systemic approach describing for each machine, depending on its conception, the functioning and malfunctioning as well as the interactions between the flows is presented below.
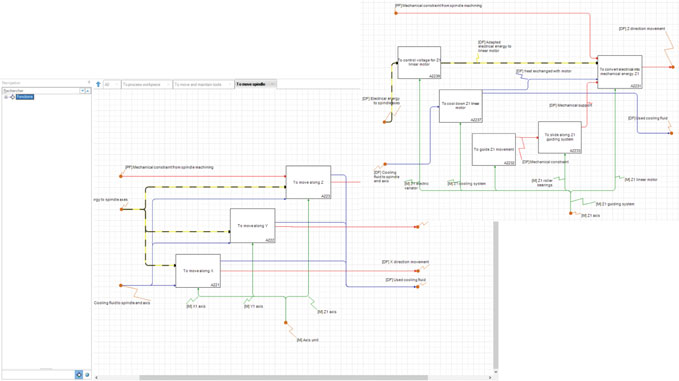
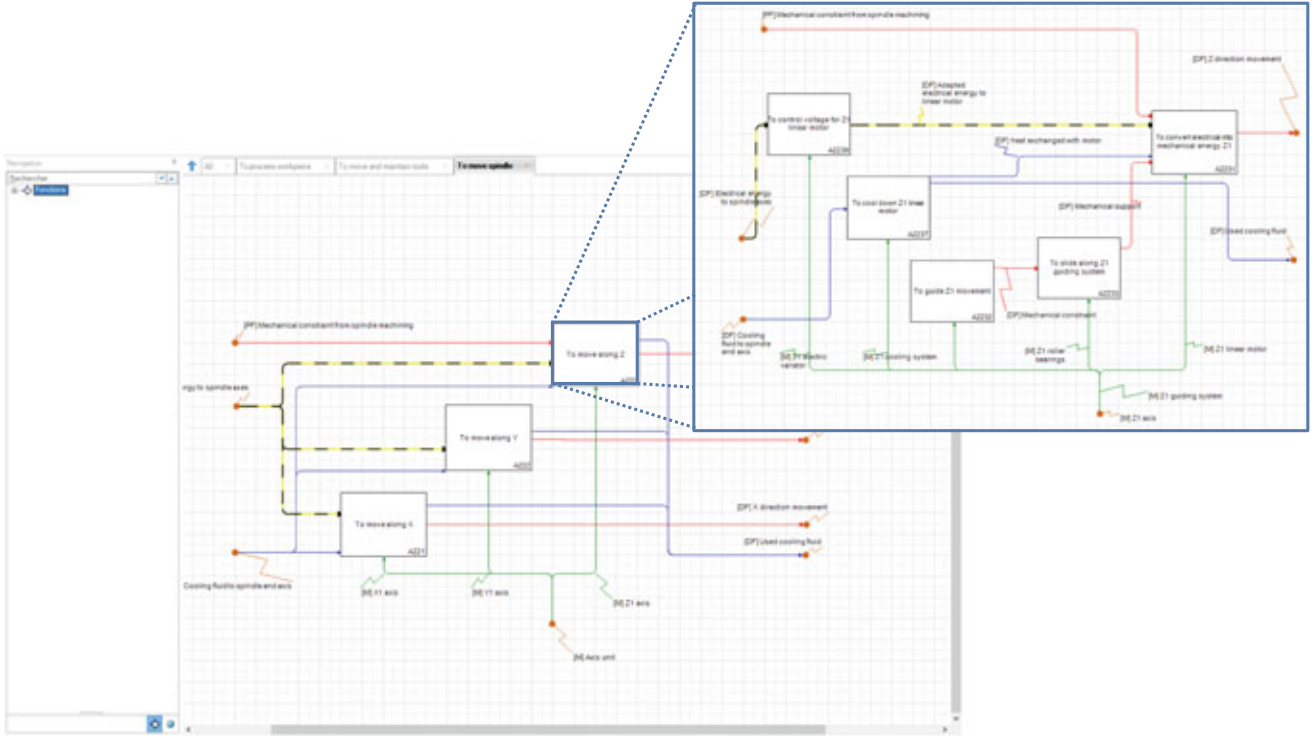
| 13 |
|
215 |
|---|
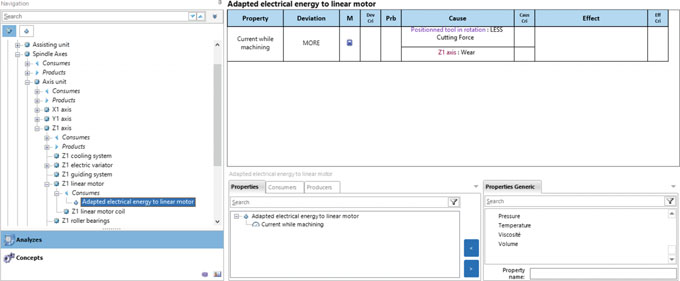
The systemic approach is combined with a semantic approach, both providing tools that help the fleet management purpose [3]. The semantic approach aims at defining the general concepts related to each level of the fleet. The ontology-based definitions
216 F. Peysson et al.
To offer support to maintenance personnel, a set of maintenance-related services must be integrated into a dedicated maintenance platform. KASEM®—Knowledge and Advanced Services for E-maintenance—which is developed, maintained and improved by PREDICT, is a platform that offers such services and is dedicated to proactive and predictive maintenance to help operators and experts to take the right decision at the right time. The efficiency, flexibility and operability of the platform are mainly based on its service-oriented architecture, as depicted in Fig. 13.6.
KASEM®platform integrates mandatory services such as data storage, as well as administration services that regroup all aspects relative to user management (profile definition, user authentication, user rights). In addition, the platform integrates the following services:
3rdparty software
Investigation
System
Knowledge
based
system
ISO 18435 / ISO 15745 - IEC 62264 / IEC 60812 / IEC 61882
• Knowledge sharing gathers all the ways to create and consult system’s documen-tation and information.
In the following, these four main services are discussed.
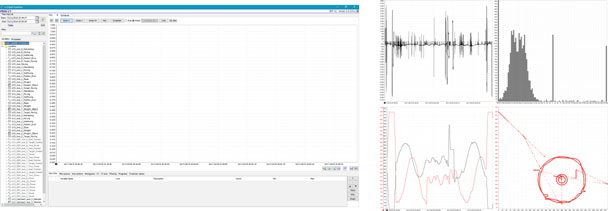
|
F. Peysson et al. |
|---|---|
• Reusable contexts creation. Indeed, the tool allows to save all the loaded variables of a graphical display area and their custom setup into a context that is reuseable. By this way, it is possible to load a memorized context into different periods to compare situations.
• Built-in tools to analyse situations such zooming, filtering or comparing variables. Moreover, user can perform histograms and XY graphs.
Data visualization service is one the most important features for Operation and Maintenance, allowing to create specific static or highly dynamic views per user core business and user level of knowledge about the system. Today, in addition to be user-adaptive, this service must also be device-adaptive to fit all displaying technologies: desktop, laptop, tablet, smartphone and smart watches.
|
|
|
|
|
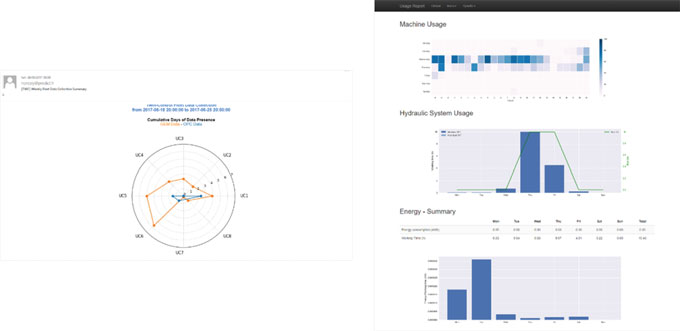
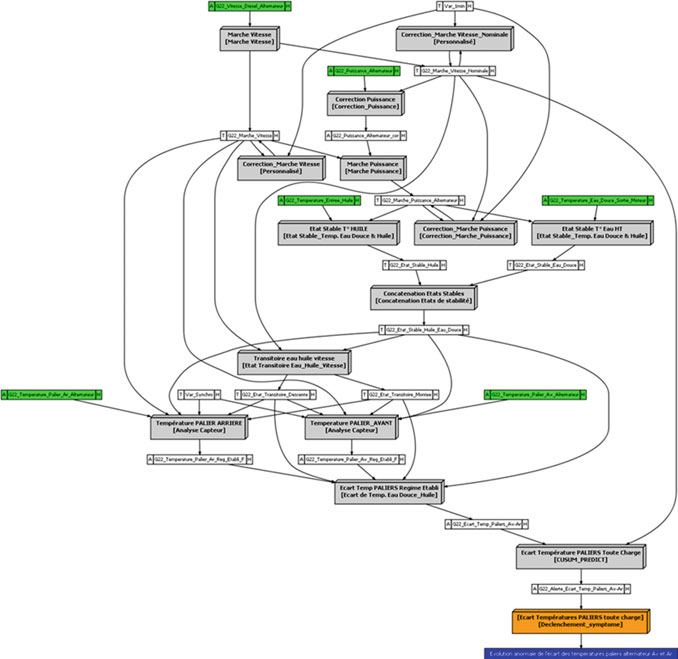
| raw data | ||
| Computed data | ||
| algorithm | ||
| symptom | ||
| event |
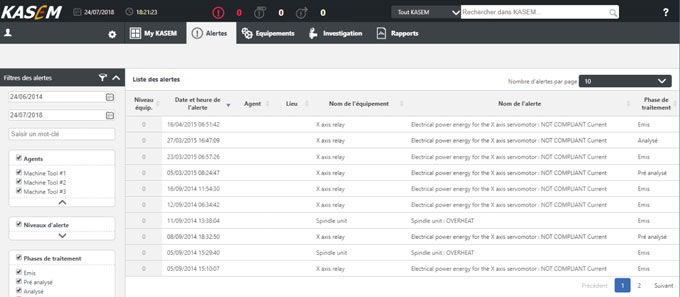
An event occurs when an abnormal behaviour has been detected. Analysis and inves-tigation service is then necessary to explain what the causes are—diagnostic—and the consequences—prognostic—of this event. This analysis and investigation pro-cess is organized in a workflow and results in event analysis and capitalization that improves event feedback.
The KASEM®workflow process is schematized in Fig. 13.11. It consists in a sequence of interactions and actions between the platform, the system and operators.
222 F. Peysson et al.
Emission
| Analysis | Closing |
|
||
|---|---|---|---|---|
| Finalization |
Fig. 13.11 KASEM®event analysis and investigation workflow
13 Fleet-Wide Proactive Maintenance of Machine Tools 223
13.3.4 Knowledge and Information Sharing Service
13.4 Conclusion
This chapter presents advanced services that are required for a fleet-wide proactive maintenance platform to provide the right information at the right time to the right person and to assist this person in decision-making. For this purpose, advanced oper-ation and maintenance services like data visualization service, event management service, analyse and investigation service and knowledge sharing service must be provided. Within Twin-Control project, the platform KASEM®, developed by PRE-DICT, has been deployed to centralize data and knowledge on twelve machine tools and several generic algorithms have been developed to evaluate machine health and generate early detection events to anticipate machine failure.
In: Proceedings of 24th International Congress on Condition Monitoring and Diagnostics Engi- neering Management, Stavanger, Norway, (2011)
4.
5. or Health Indicator Fusion with Multi-Level Industrial Systems, Proceedings of 2012 IEEE Conference on Prognostics and Health Management, Denver, CO, pp 1–7 (2012)
6. Medina-Oliva, G., Voisin, A., Monnin, M., Leger, J.-B.: Predictive diagnosis based on a fleet- wide ontology approach. Journal of Knowledge-Based Systems 68(1), 40–57 (2014)
7. Monnin M., Voisin A., Leger J-B., Iung B.: Fleet-wide health management architecture, Pro- ceedings of Annual Conference of the Prognostics and Health Management Society, Montreal, Quebec, Canada (2011)
8. Peysson, F., Ouladsine, M., Outbib, R., Leger, J.-B., Myx, O., Allemand, C.: A generic prognostic methodology using damage trajectory models. IEEE Trans. Reliab. 58(2), 277–285 (2009) 9. Fernandez, S., Mozzati, C., Arnaz, A.: A Methodology for Fast Deployment of Condition Mon- itoring and Generic Services Platform Technological Design, Proceedings of Annual European Conference of the Prognostics and Health Management Society, Bilbao, SpainOpen Access This chapter is licensed under the terms of the Creative Commons Attribution 4.0 International License (), which permits use, sharing, adaptation, distributions long as you give appropriate credit to the original author(s) and the source, provide a link to the Creative Commons license and indicate if changes were made.
Denys Plakhotnik, Luke Berglind, Marc Stautner, Dirk Euhus, Erdem Ozturk, Tobias Fuertjes and Yavuz Murtezaoglu
14.1 Introduction
L. Berglind · E. Ozturk The Advanced Manufacturing Research Centre (AMRC), Boeing, University of Sheffield, Sheffield, UK
e-mail:E. Ozturk
e-mail:
| 14 |
|
227 |
|---|
reliable prediction of cutting conditions without performing real trials. It is likely that postprocessing and analysis of the data acquired after actual machining will become nearly obsolete after virtual manufacturing paradigm becomes an industry standard. Simulation approaches will avoid performing expensive trials. Creating a strategy that combines measurement and simulation data sources has a high potential.
14.2 3D Volumetric Simulation
There exist several techniques which have been developed to model virtual work-pieces and removing any material that interferes with the geometry of a tool moved along a path (solid modeling [4, 5], Z-map [6], and Dexel approach [7]). In this paper, a discrete modeling method based on tri-Dexel volume representation [8] is used, which is an improved version of the Dexel model. The tri-Dexel model represents a volume as a manifold of evenly distributed linear segments, or Dexels, in three orthogonal directions, as depicted in Fig. 14.2a. In the current paper, geometric soft-ware which applies the tri-Dexel model is used because tri-Dexel model has proved to be an efficient data structure with reliable performance and precision, which is very important for a computation routine running in an iterative loop. The mate-rial removal has been simulated using ModuleWorks engine that calculates discrete intervals intersecting with the swept volume of a moving tool. The start and end points of all subtracted intervals indicate the boundary of the removed volume and hold information about their spatial position and inverted normal vectors of the tool sweep envelop. Dexel spatial positions, surface normal vectors, and signatures of the intersecting tools are sufficient to reconstruct the part surface, as shown in Fig. 14.2b.
To connect the real-world shapes, a virtual representation of the machine and the current shape of the workpiece need to be maintained throughout the entire process. ModuleWorks uses its industry-proven MachSim (the machine and its kinematic) and CutSim (actual shape of the workpiece during the manufacturing process) software to create the 3D representation of the workpiece geometry and machine that can then be integrated into the CNC user interface.
For the Twin-Control project, this methodology has been extended and optimized. It has developed an interface to exchange internal simulation data for processing analytic modules that allow the prediction of process behavior such as stability and cutting forces. To display this information to the user at the machine, a second interface connects this data with the workpiece shape that was calculated in parallel. The other interfaces take real-world measurement data and integrate it into the same representation of the workpiece shape. The virtual system is completed by a system that delivers warnings to users and delivers additional security to the machine. Users can directly correlate data with the current shape of the workpiece. On the machine, this system can stop the process to avoid crashes and other unwanted process errors.
Fig. 14.3 Workflow to combine simulation of measured machine movements and process data
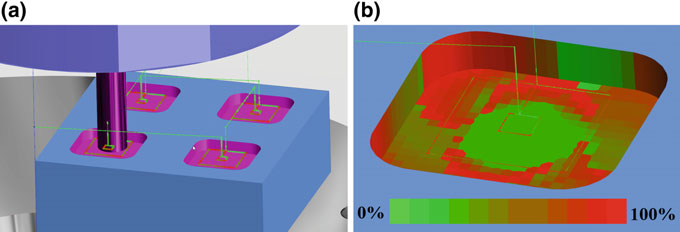
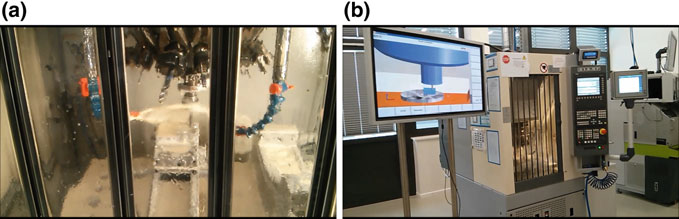
Fig. 14.5 Observation of the milling process on a Chiron machine: a through the machine housing; b on the simulation screen
Besides, there have been developed another several visualization methods that can facilitate to optimize machining operations:
• Visualization of the tool–workpiece engagement. Figure 14.8 shows the contact area between a tool and the workpiece. This functionality is useful to analyze how cutting forces change along a part program.
| 14 | 231 |
|---|
Fig. 14.8 Visualization of the tool-workpiece engagement: a tool-workpiece setup; b engagement area
• Visualization of the cutting marks on the machined surface. Figure 14.9a shows which surface outlook can be expected after grinding. This feature is expected to be necessary for aesthetic applications.
14.5 Conclusions
Integration of the process monitoring data into CAM simulation is a tangible progress in the evolution of the CAx chain. Previously, the analysis of the cutting process measurements could not be performed in the CAM environment. In an extended CAM, immediate access to stored process parameters allows more robust verification and modification of NC programs. Three-dimensional machined surface colored according to the measurement can be analyzed more intuitively than graph plots. Also, it can be detected whether the extreme or unfavorable cutting conditions do really affect the machined surface. In a case of an actual or foreseeable failure, results of cutting force simulation can be exploited for operation re-planning to avoid tool and workpiece damage.
6. Kim, G., Cho, P., Chu, C.: Cutting force prediction of sculptured surface ball-end milling using Z-map. Int. J. Mach. Tools Manuf 40, 277–291 (2000)
7. Boess, V., Ammermann, C., Niederwestberg, D., Denkena, B.: Contact zone analysis based on multidexel workpiece model and detailed tool geometry representation. In: 3rd CIRP Conference on Process Machine Interactions (2012)
8. Benouamer, M.O., Michelucci, D.: Bridging the gap between csg and brep via a triple ray repre- sentation. In: Proceedings of the Fourth ACM Symposium on Solid Modeling and Applications, SMA ’97, ACM, pp. 68–79, New York, NY, USA (1997)Open Access This chapter is licensed under the terms of the Creative Commons Attribution 4.0 International License (), which permits use, sharing, adaptation, distributions long as you give appropriate credit to the original author(s) and the source, provide a link to the Creative Commons license and indicate if changes were made.
Chapter 15
Twin-Control Evaluation in Industrial Environment: Aerospace Use CaseMikel Armendia, Mani Ghassempouri, Guillermo Gil, Carlos Mozas, Jose A. Sanchez, Frédéric Cugnon, Luke Berglind, Flavien Peysson and Tobias Fuertjes
G. Gil · C. Mozas Mecanizaciones Aeronáuticas S. A. (MASA), Agoncillo, Spain e-mail:
C. Mozas
e-mail:T. Fuertjes
MARPOSS Monitoring Solutions GmbH, Egestorf, Germany e-mail:© The Author(s) 2019 237 M. Armendia et al. (eds.), Twin-Control,
The aerospace validation scenario is located at Mecanizaciones Aeronáuticas S.A. (MASA) plant in Agoncillo, near Logroño in Spain. For the evaluation, GEPRO 502, 512 and 304 machine tools are used. The architecture of the three machines is similar, but they differ in the number of axes, dynamic capabilities, spindle type, etc. Even of the three machines have been monitored, the GEPRO 502, depicted in Fig. 15.1, has been used as the main reference to implement Twin-Control features.
For the aerospace use case, a new machining process, illustrated in Fig. 15.2, has been used. This process has been defined for the project and combines features of different test pieces usually applied by MASA for internal validations. The part is a
| 15 | 239 |
|---|
Fig. 15.2 Part used in the aerospace validation use case
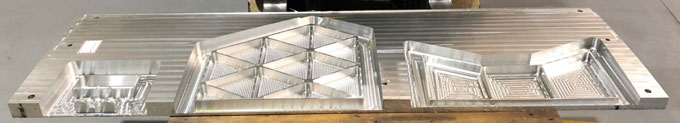
The evaluation strategy will be linked to the different scenarios of use (SOU) defined by the aerospace end-users at the beginning of the project:
240 M. Armendia et al.
15.4.1 Virtual Machine Tool with Integrated Process Models
15.4.1.1 Implementation and Results
Validation consists of simulating four machining sequences as shown in Fig. 15.6: a roughing operation of the external groove (blue path), a roughing operation of one triangular pocket (red path), a finishing operation of the vertex of the pocket (black path) and finishing operation of the walls of the pocket (green path). Position target functions replicated from the ISO code executed in the machine are used to feed the Virtual Machine Tool model.
|
|
|
|
||||
|---|---|---|---|---|---|---|---|
| 0.610865 |
|
|
|||||
|
0.610865 |
|
|||||
|
|
0.610865 | |||||
|
|
0.610865 | |||||
|
|
0.610865 |
|
||||
|
0.610865 |
|
|
||||
| 0.610865 |
|
|
|||||
|
0.610865 |
|
|||||
|
|
0.610865 | |||||
|
|
|
D Tool Diameter [mm]; Rc nose radius of tool [mm]; Beta taper angle of tool [rad]; Lam Helix angle [rad]; Nflut Number of flutes [−]; ToolDir cut rotation direction [−]; Zmax max Z value for virtual tool [mm])
Fig. 15.6 Machining sequences for the validation of machining performance in the aerospace validation scenario
of cut of 5 mm. For each pass, the workpiece STL file generated from the previous one is used, replicating the real machining procedure. In Fig. 15.7, the evolution of the groove machining using the simulation tool is presented graphically.
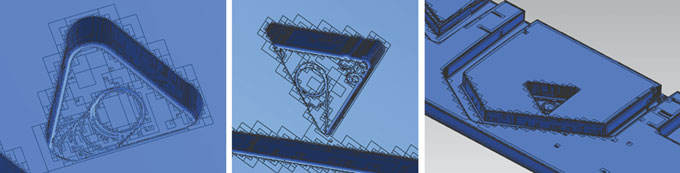
Fig. 15.8 Triangular pocket machining simulation sequence (from left to right): roughing, corner finishing and wall finishing
GEPRO is not a general-purpose machine tool manufacturer. Each GEPRO machine is developed to machine a specific part or part family, always from aerospace sector. In some cases, due to the big size of the machines and the high costs, GEPRO works in the retrofitting of older machines to use the big structural components.
Due to small size of the company and the presented features, GEPRO does not fabricate prototypes for the new machine tool models. Indeed, as each machine is taken as a new development, all GEPRO machines can be taken as prototypes, but they must be completely functional in production.
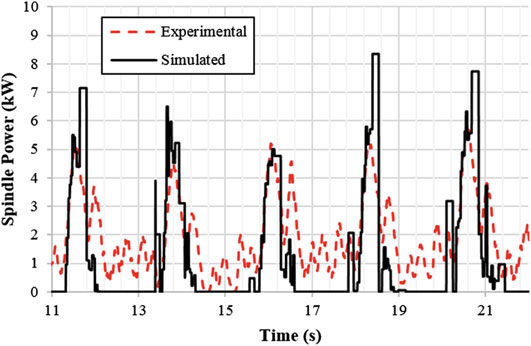
Fig. 15.10 Comparison of the simulation results obtained with the integrated simulation tool and real monitored data for the triangular corner finishing operation
| 15 | 245 |
|---|
Typical Product Development (Current) = 12-15 months
Fig. 15.11 Comparison of the current product development process for GEPRO and the proposed one with the application of Twin-Control
15.5.1.1 Implementation and Results
The same implementation presented in scenario of use 1, machine tool design, is applied in this scenario. Apart from that, for the simulations carried out with the GUI containing the process models, additional hammer tests have been performed at the GEPRO machine to get the FRF of the tooltip with all the used tools Fig. 15.12 shows an example of FRF.
Fig. 15.12 Tool FRFs in the GEPRO 502: a Hammer tests. b Example of FRF for the tool #1 (from Table 15.1)
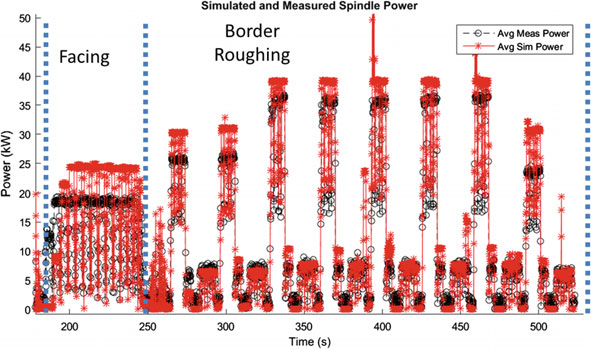
| 15 | 247 |
|---|
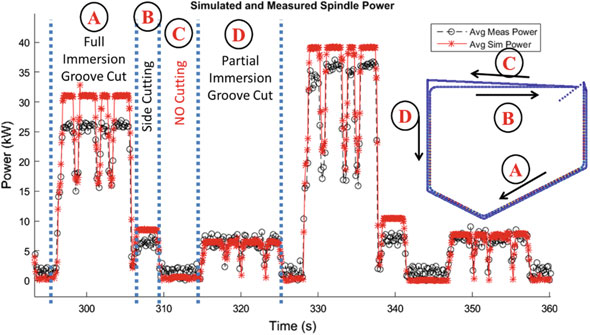
Fig. 15.14 External grooving operation of MASA process: detailed view of the simulated and measured spindle power for a single pass
248 M. Armendia et al.
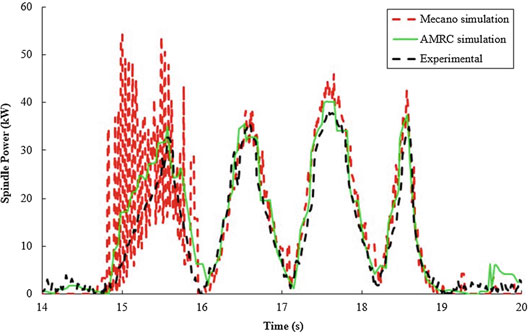
The results from Fig. 15.19, that presents the comparison for the wall finishing operation, indicate that the measurement and simulation results track less accurately when the power or torque magnitudes are small.
The results from this second phase of trials at MASA have shown that the sim-ulations are able to be used to improve new and existing processes. The ability to
| 15 | 249 | ||
|---|---|---|---|
Fig. 15.18 Triangle vertex finishing operation of a pocket 1 (operation 5004), b pocket 2 (operation 5005) and c pocket 3 (operation 5006)
accurately simulate subtle changes to the process allows process planners to first identify potential areas of improvement and then be able to explore the effect each parameter will have on the process outcome. Ultimately, this process can be used to fully test new processes off machine and increase confidence in a process before the first part is produced.
Fig. 15.19 Triangle wall finishing operation of a pocket 2 (operation 5008) and b pocket 3 (oper-ation 5009)
Table 15.3 Average duration of the different stages of the new process design and set-up procedure for MASA (aerospace validation scenario) and the impact expected with the application of Twin-Control features
|
|
||
|
|||
|
|||
|
|
||
|
|||
|
|||
|
|||
|
|||
|
|||
small batches are usually required from customers, and hence, this implementation is performed with a high frequency.
Different simulations will provide the results (function transfers, vibrations …) and information to select the best machine tool configuration. With this, the machine tool selection stage will be reduced by a 25%.
– Process simulation and set-up: With the implementation of Twin-Control sim-ulations, a comparison between a huge range of different tools and machining conditions can be done, allowing an optimization. In addition, MASA will be able to know before the machining in which operations the chattering risk exists, allowing the modification of machining conditions and the selection of the best alternative option. A reduction of process design and set-up time of around 60% is expected.
Apart from this, the operator can usually modify process performance, for exam-ple, by modifying the feed rate when process does not go as expected (e.g. chatter occurs).
The application of Twin-Control in this scenario of use leads to a minimization of the impact of the undesirable events during production.
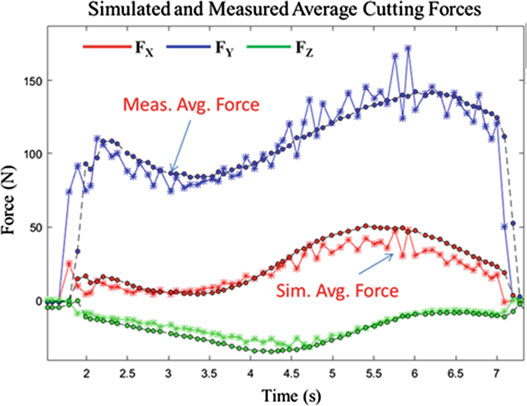
Fig. 15.20 Comparison of simulated and monitored results for the validation operation of the stability roadmap feature of Sect. 2.2 of the book
15.6.1.1.2 NC Simulation
The CNC simulation capabilities of ModuleWorks have been integrated in the ARTIS GEM-Visu HMI during Twin-Control project as depicted in Fig. 15.21. An imple-mentation of the aerospace use case has been done by developing a simplified design of the GEPRO 502 machine. The virtual model has been created starting from STL files provided by GEPRO. By using current axis position data recorded by the OPR of the GEPRO 502 machine, the virtual representation of the machine replicates the movements done by the real machine.
15.6.1.1.3 Adaptive Control
Adaptive feed rate control has been implemented in the GEPRO 502 machine of MASA. This feature consists in the adaptation of feed rate according to spindle con-sumptionandisperformedbytheARTISGeniormodularinstalledinthemachine.By applying this feature, when the spindle is under-working, the feed rate is increased; and, when the spindle is overworking, the feed rate is reduced. The objective is to increase productivity by keeping the maximum material removal rate during all the process. To test this, a scalloped sample part, represented in Fig. 15.22, has been used.
| 15 | 255 |
|---|
Fig. 15.22 Implementation of adaptive feed rate control in MASA use case: a diagram showing the adaptive control strategy on scalloped part: blue line shows the learning stage; red line shows the adapted stage. b Picture showing the real workpiece being machine in MASA case
The differences between the learning stage and the adaptive control stage can be clearly observed in Figs. 15.23a and 15.24a. In the first case, the feed rate reaches values around 4000 mm/min and, in the second case, with the adaptive control active, the feed rate reaches values around 5200 mm/min.
15.6.1.2 Impact
| 256 | (b) | M. Armendia et al. | |
|---|---|---|---|
| X axis feedrate (mm/min) | 4000
|
Spindle S2 torque (%) |
|
| Time (s) | Time (s) | ||
Nowadays, the scrap parts due to tool breakage are totally controlled for alu-minium machining and no scrap parts are produced by this problem. In case of titanium machining, tool breakage is a problem and a cause of scrap part production. The application of Twin-Control simulation-based process monitoring will allow to predict tool breakage in advance and replace the tool in an early stage.
The average tooling cost for MASA is 6 and 30e per machining hour for alu-minium and titanium, respectively. By the application of Twin-Control simulation-basedprocess monitoring, areductionof thetoolingcost of around5–10%is expected intitaniummachining.Inthealuminiummachining,itwon’thavearemarkableeffect.
15.7.1 Fleet Management System
The cloud-based fleet-wide platform developed in Twin-Control project capitalizes all the information on all connected machines to support trend analysis of indicators, which is the first step towards predictive maintenance policy. Sections 3.2 and 4.3 of the Twin-Control book provide more insights into the fleet-wide platform developed in Twin-Control project.
Analysis of power consumption of each Y-axis linear move according to speed and length shows a gap in the indicators from the 2017/06/22 when data trans-fer between machine and fleet platform is restored after few days, as depicted in Fig. 15.25. A maintenance activity report from MASA shows that during the week of the 2017/06/30 a problem with a chip accumulation in the Y-axis occurred, causing several components damage and replacement as shown in Fig. 15.26.
In this scenario, data transfer has been lost just before the drift of power. It can be assumed that the drift will be detected more than 3 days before.
Fig. 15.25 Identification of anomalous performance of the Y-axis of GEPRO 502 machine using power-based indicators

| 15 |
|
259 |
|---|
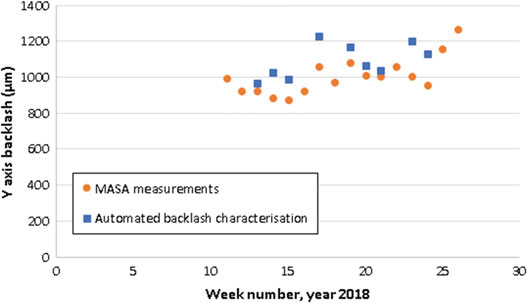
With the application of a predictive maintenance strategy, MASA will be able to minimize the possibilities to suffer the failure. Thank to early detection of a drift in the machine behaviour, maintenance actions can be optimized, minimizing machine downtime. In addition, part of preventive actions could be eliminated, reducing over-all maintenance costs and machine downtime.
Backlash of feed drives is one of the most critical aspects to get scrap parts in MASA. Currently, MASA checks the backlash manually, which is time-consuming. The implementation of MT characterization tests, where backlash is automatically determined makes easier the control of this parameter and minimizes the risk of getting a scrap part due to axis backlash. It is expected a reduction of the 10% in scrap parts due to this implementation.
This chapter presents the implementation and obtained results of the technical devel-opments done in Twin-Control project in the proposed aerospace industrial validation scenario. A specific approach for Twin-Control evaluation is defined, based on differ-ent scenarios of use defined in the project. The results and the impact of Twin-Control features are structured according to these scenarios of use.
Twin-Control shows a set of features that can help aerospace machine tool builders and users to improve their processes. A summary of the impact caused by the appli-cation of Twin-Control is listed next:
– Reduction of machine downtime and maintenance costs thanks to predictive main- tenance approach.
– A reduction of scrap parts of the 10%.
Chapter 16
Twin-Control Evaluation in Industrial Environment: Automotive CaseMikel Armendia, Mani Ghassempouri, Jaouher Selmi, Luke Berglind, Johannes Sossenheimer, Dominik Flum, Flavien Peysson, Tobias Fuertjes and Denys Plakhotnik
J. Selmi
RENAULT SAS, Powertrain Production Engineering Division (DIPM), Guyancourt, France e-mail:L. Berglind
The Advanced Manufacturing Research Centre (AMRC) with Boeing, University of Sheffield, Sheffield, UK
e-mail:D. Plakhotnik
ModuleWorks GmbH, Aachen, Germany
e-mail:© The Author(s) 2019 261 M. Armendia et al. (eds.), Twin-Control,
Section 16.2 of this chapter provides an overview of the automotive validation scenario. In Sect. 16.3, the industrial evaluation approach is presented. Section 16.4 presents the implementation and results obtained with a special attention to the impact caused by these features in the end-users. Finally, the last section covers the conclusions.
16.2 Use Case Description
| 16 |
|
263 |
|---|
Fig. 16.3 General view of
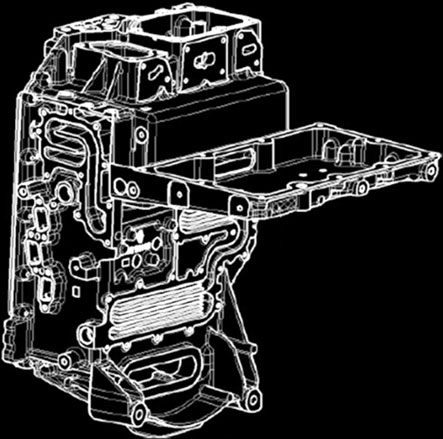
For each scenario of use, results obtained with Twin-Control are presented and the impact on end-users is evaluated.
16.4 Scenario of Use 1: Machine Tool Design
16.4.1 Virtual Machine Tool with Integrated Process Models
16.4.1.1 Implementation and Results
Table 16.1 Characteristics of the tools needed in automotive use case
|
|
|
|||||
|---|---|---|---|---|---|---|---|
|
|
||||||
|
|
|
|||||
|
|
|
|||||
|
|
||||||
|
|
||||||
|
|
|
|
||||
|
|
||||||
|
|
||||||
|
|
|
|
||||
|
|
||||||
|
|
||||||
|
|
|
|
||||
|
|
||||||
|
|
||||||
|
|
|
|||||
|
|
|
|||||
|
|
Rc, Beta and Lam values for these tools are null since they have straight and plane cutting face
16.4.1.2 Impact
| 16 | Twin-Control Evaluation in Industrial Environment … |
|
267 | ||||
|---|---|---|---|---|---|---|---|
|
|||||||
| Product Studies | |||||||
|
|
||||||
| Concept | Concept | Validation | Product |
|
|
|---|---|---|---|---|---|
| Studies | prototype | tests | |||
| Product Studies using | |||||
| TwinControl’s modules | prototype |
|
|||
| Alpha + Beta | |||||
| Expected total development process |
|---|
process. By using the virtual modules and tools developed by Twin-Control project, it could be possible to identify the main problems virtually and to solve and debug them during the study phases; it means that the major part of the product validation and tests could be done virtually, and the final validation could be done by the first prototype, as shown in Fig. 16.6. After internal tests and light modification, this first prototype could be shipped to a customer plant for industrial validation tests. It is expected a reduction of 10% in time and costs in the product development process with the application of Twin-Control.
268 M. Armendia et al.
| 16.4.2 16.4.2.1 |
Energy Efficiency Models Implementation and Results |
|---|
As the Urane 25 V3.0 machines were designed and manufactured about 15 years ago (2003), the components used at these machines (motors, pump, chiller, etc.) are less energy efficient compared to the components which are available on the market in 2018. By applying the offline energy simulation models, which are described in Sect. 2.3, the following measures and design modifications are proposed:
|
|
||
|---|---|---|---|
|
|||
|
|||
|
|
||
|
|||
|
|||
|
|
||
|
|||
• replacing the current electric drives with more efficient IE4 motors• implementing a switch-off mode for the hydraulic system pump• replacing the cooling fluid pump with a better-suited pump
• replacing the current chiller with a more energy-efficient chiller.
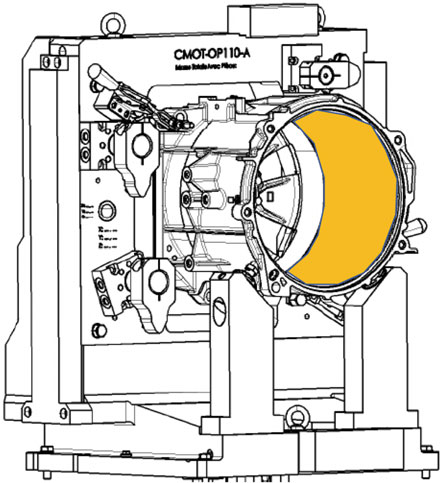
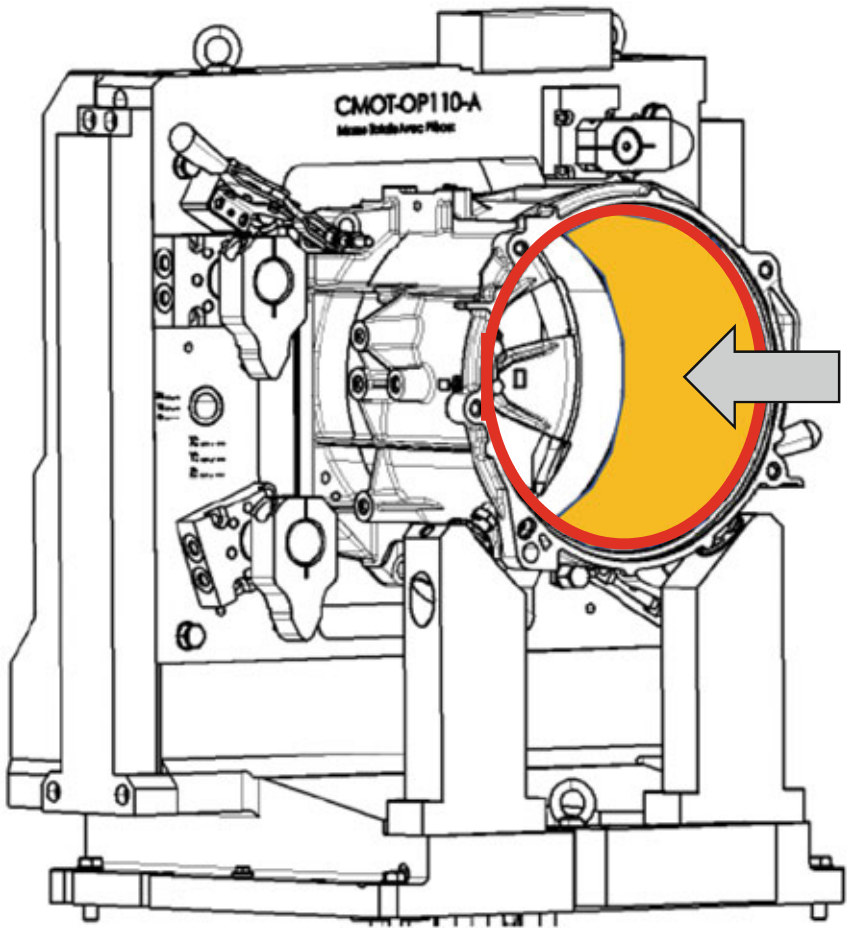
270 M. Armendia et al.
A depiction of the simulation is shown in Fig. 16.8a, where the two-sided boring tool is modelled as a large-diameter drilling tool with two flutes.
One challenge for this simulation is that the original stock geometry is not known with certainty, where the stock ID from the forge set at 253±1 mm is provided. Furthermore, the large size of the tool relative to the part geometry created issues for determining tool workpiece engagement with precision. To account for these issues, the part STL geometry is created with a tapered inner surface, which starts with an ID of 254 mm at the start of the cut, and 242 mm at the end of the cut. Additionally, the tool mesh and the engagement precision are set very fine to capture changes to the TWE due to small changes in the part ID.
simulated torque indicated by the thick dashed line in Fig. 16.8b closely follows the measured torque profile throughout the cut.
Accurate torque predictions from the updated process model give process plan-ners the opportunity to look for issues with a machining operation before a part is produced. Figure 16.8b shows an example of how this can be used to prevent torque overload. The spindle used here has a torque limit of 27 Nm at 5000 RPM. It can be seen from these results that the torque limit is surpassed close to the beginning of the cut. It is known from the machine measurement that the tool feed slows during the operation, and it is also possible the torque overload caused a decrease in the spindle RPM as well. The overall result is an operation which takes longer to complete than planned and which pushes the spindle to its performance limits.
Fig. 16.9 New automotive part with large overhang region which will be simulated for both face and side milling
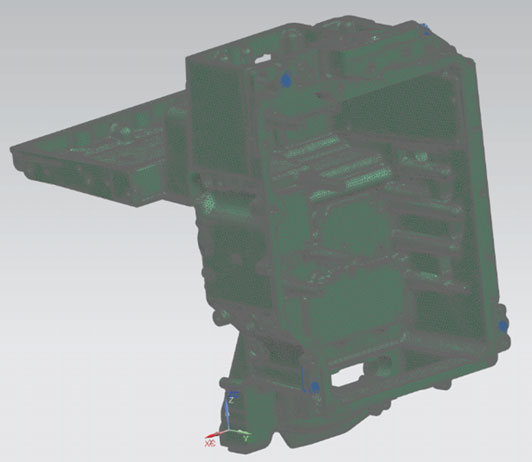
| 16 | 273 |
|---|
The resulting stability roadmaps for each simulation are shown in Fig. 16.11b. It is clear from the stability roadmap results that the two operations, while removing the same amount of material, differ greatly in terms of chatter risk. From the FRF data, the part is significantly more flexible in the Z-directions, and this flexibility increases likelihood of chatter for side milling, where radial forces act primarily in
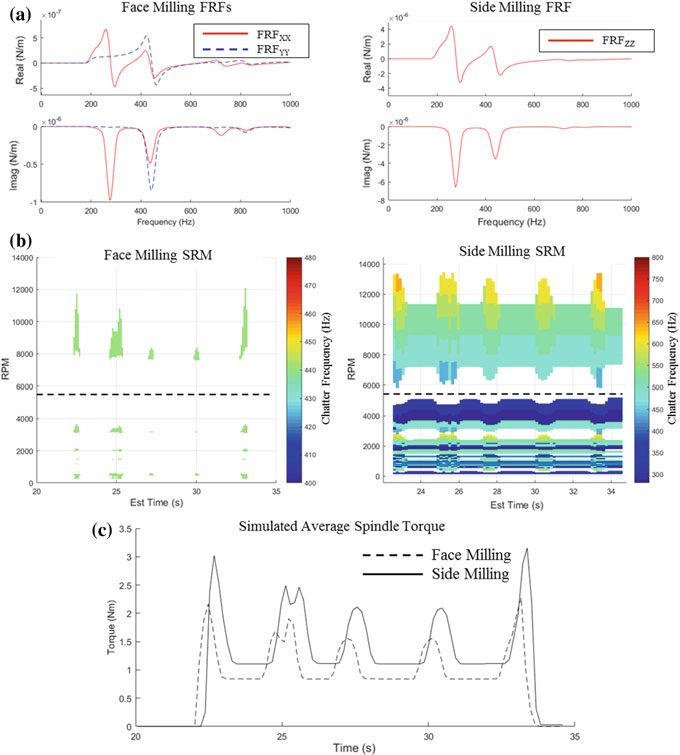
From the simulation results in Fig. 16.11, the facing operation is better suited to this application. While it is predicted that no chatter will occur at 5500 RPM for the side milling case, the conditions are close to the stability boundaries, and there is still a potential of chatter. The facing operation shows a larger separation between the stability boundaries, especially at 5500 RPM. Furthermore, the predicted spindle torque load is approximately 20% lower throughout the facing operation. As a result, face milling at 5500 RPM is recommended for this application with the current tool and part material. Note that these results and recommendations serve as a starting point for the process design based on the available information. At a later stage in development, the simulations should be updated with new data, such as actual part FRF measurements, to further improve the process design.
16.5.1.2 Impact
Table 16.4 Average duration of the different stages of the new process design and set-up procedure for RENAULT and the impact expected with the application of Twin-Control features
| Duration (week(s)) |
Expected duration with Twin-Control (week(s)) | ||
|---|---|---|---|
|
|
||
|
|
||
|
|
||
|
|
||
|
|
||
|
|
||
|
|
||
|
|
||
|
|
||
|
|
||
|
|||
The application of Twin-Control at machine operator level leads to a minimiza-tion of the impact of the undesirable events during production and to optimize productivity.
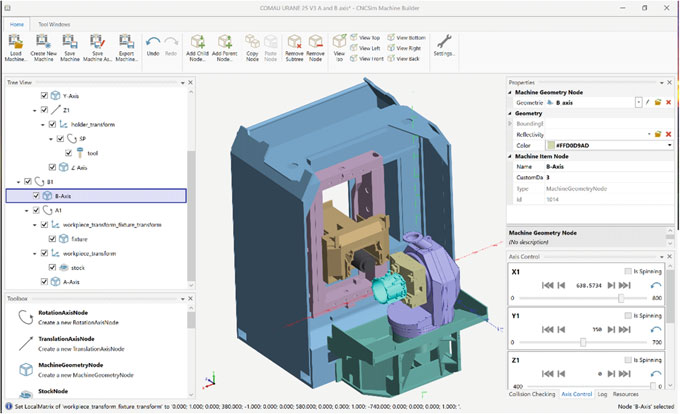
Fig. 16.12 Screenshot of the MachineBuilder application showing COMAU Urane 25 model
In addition to kinematics and geometry of the machine model, different collision-checking options may be applied. This way, the machine model elements to be consideredforpotentialcollisionsaredefined.Forinstance,acollisioncheckbetween machine tool elements or between cutting tools and machine elements can be done, as shown in Fig. 16.13. It is also possible to specify any custom rules for machine elements defined in the kinematic tree.
| Fig. 16.13 Collision-checking options for CAS |
|---|
278 M. Armendia et al.
operation is set up or changes in fixtures/tooling applied. Often such seemingly small changes are overlooked and executed on a machine without proper verification. CAS system can serve as the last guard to protect the equipment. If a collision is detected, the machining process is stopped before an actual collision occurs to prevent expensive machine damage and downtime. The end-users may assure that the human-factor or inefficient verification software will cause production losses.
Fig. 16.15 Overview of the switching states of the auxiliary units of the COMAU Urane 25 V3.0 machine
|
|
||||
|---|---|---|---|---|---|
|
|
||||
|
|
||||
|
|
||||
|
|
||||
|
|
||||
| Electric control cabinet |
|
|
|||
|
|
280 M. Armendia et al.
gram, the nominal power of the fan is 620 kW, which confirms the approximation of the fan’s actual power consumption. Decisive information to map the load peaks of the hydraulic pump (second diagram in Fig. 16.16) or the HP-coolant pump (third diagram in Fig. 16.16) of the COMAU machine is missing. Significantly, more pre-cise results could be achieved if the corresponding signals were integrated into the disaggregation model. Furthermore, the consequently falsified disaggregation, which is distributed to all other components, would be lower. Therefore, the accuracy of the disaggregation of the other components could also be increased. The disaggregation results of the cooling fluid pump (first diagram in Fig. 16.16), the cooling mod-ule’s fan and the cooling module’s compressor approximate the measured power consumption relatively well.
• Production mode
• Operational mode
• Stand-by mode
• Switched-off mode.
Whenimplementingademand-orientedcontroloftheauxiliaryunits,thetechnical restrictions and start-up times must be respected. The proposed operation modes consider the existent restrictions and switch off the modules only when it is safe for the components and the machine. In production mode, after 1 min of inactivity, the drives, the hydraulic system pump and the HP-coolant pump are switched off to operational mode. The breaks of the drives are of course activated during this time. After 10 min of inactivity, the machine is switched to stand-by mode, which means
Table 16.6 Implementation of a demand-oriented control for the COMAU Urane 25 V3.0 machine
|
||||
|---|---|---|---|---|
| Production mode | ||||
| Main connection |
|
|
||
|
|
|||
|
|
|||
|
||||
| HP-coolant pump |
|
|||
|
|
|||
| Other consumers |
|
|
||
The cycle time of the validation part selected for Twin-Control is 7.4 min and rep-resents the typical process carried out by RENAULT. Due to the high level of opti-mization at process design stage due to its impact in the large batch, there is no big expectation from the application of adaptive feed rate control and its impact in the cycle time.
RENAULT can produce up to 7000 parts per month at Cleon plant, with a very small rate of scrap part production (average of 25 scraps per month). This fact, together with the limited cost of each scrap part (for the validation part it is around
Fig. 16.18 Frequency of machine idle time for the period from 1 to 15 of April 2018
119 e), highlights the great automatization and process control of RENAULT and the limited impact of Twin-Control feature application.
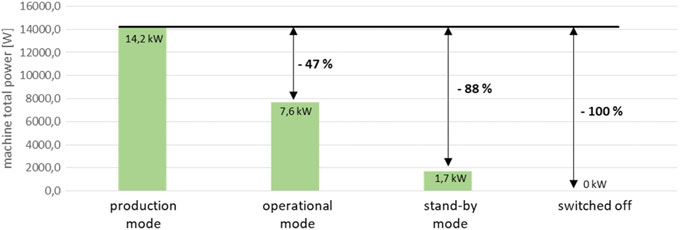
Fig. 16.19 Energy savings potential of demand-oriented control of the COMAU Urane 25 V3.0 machine tool
Although that systematic preventive maintenance reduces, the number of unex-pected failures not all is avoided. On the remaining failures, a small percentage is not predictable, but most of them can be anticipated by analysing behaviour drifts of the machine tools.
16 Twin-Control Evaluation in Industrial Environment … 285
16.7.1.1 Implementation and Results
Within the project, the cloud platform for machine tools is hosted on a dedicated serverandavailableat.RENAULTmachine’sfleet,used for the evaluation of omposed of three machines. For this industrial use case, fleet-wide platform receives and analyses data in batch flow.
286 M. Armendia et al.
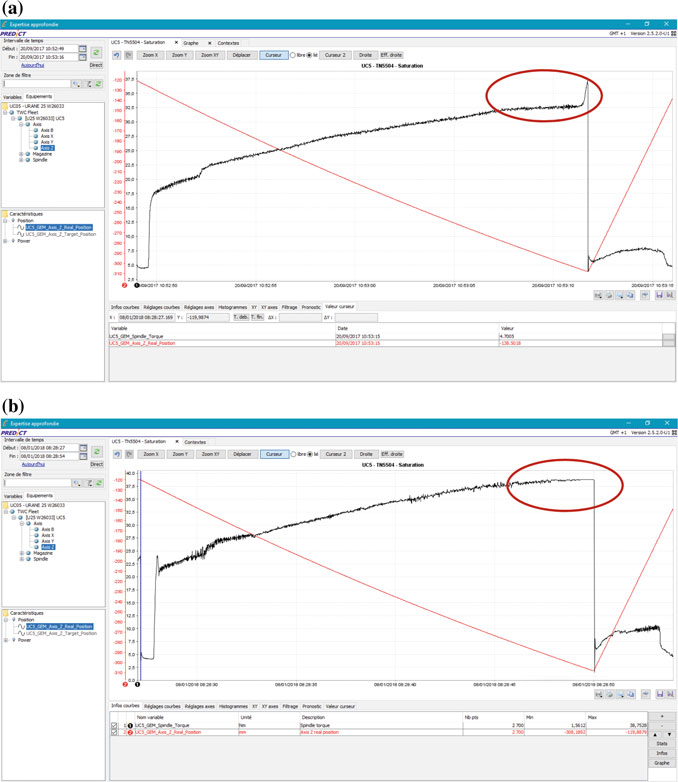
| 16 |
|
287 |
|---|
Fault
Fig. 16.22 Extract from RENAULT CMMS, Spindle speed fault on 2018/01/10 (in French)
Figure 16.24 shows an example of the tool wear estimation for tool 5208 based on spindle torque measurement. The accelerated tool wear zone can be clearly identified in both operations made with this tool for each workpiece. Accelerated wear zone is detected around 130 parts before is changed. As shown in Fig. 16.25, tool is replaced by RENAULT based on “frequency”, i.e. maximum parts produced counter is reached, and not for accelerated wear. Machining with tools in the accelerated wear zone increases risks of both tool breakage and quality problems on the workpiece.
OP120 3010.7
≈ 130 parts
Streaks were detected on one workpiece during quality control and caused by a problem on a valve in antivibration system as shown the extract of the CMMS in Fig. 16.28.
16.7.1.3 Impact
1 day
Streak detection
by Renault
In case of linear motor failure, used in COMAU machines, the replace of the motor takes around 20 h for two experimented maintenance technicians. It means that, in case of motor failure, it is necessary to call off-duty people which adds extra costs to the intervention and increases machine downtime. In this scenario, the knowledge of the risk of failure several days in advance will avoid, at least, these additional costs and, also, unplanned machine stops. In case of RENAULT, each of these types of maintenance activities causes a reduction in production of more than 170 parts.
In case of spindle failure or drift, early detections reduce the overall production costs. Indeed, any abnormal behaviour on the spindle can decrease workpieces qual-
| 16 | 291 |
|---|
RENAULT makes quality monitoring using QDAS quality management system (). There is currently no interaction between the e manufacturing processes.
Due to short cycle times in automotive use case, it is not possible to measure the 100% of the machined parts. Normally, one part is measured by working turn (every 8 h). If incorrect parts are machined between measurements, they are not detected.
For each part, all physical process parameters, which are monitored, are retrieved and identified through the part number. The same part number is used to identify the quality measurement file (dfq extension) from QDAS. ARTIS has developed a converter to get process data in QDAS format. This allows the integration in the same environment (Fig. 16.30).
292 M. Armendia et al.
16.8.1.2 Impact
Once the system is implemented and a learning stage is completed, it should allow detecting all bad quality parts from process monitoring data (faster response time).
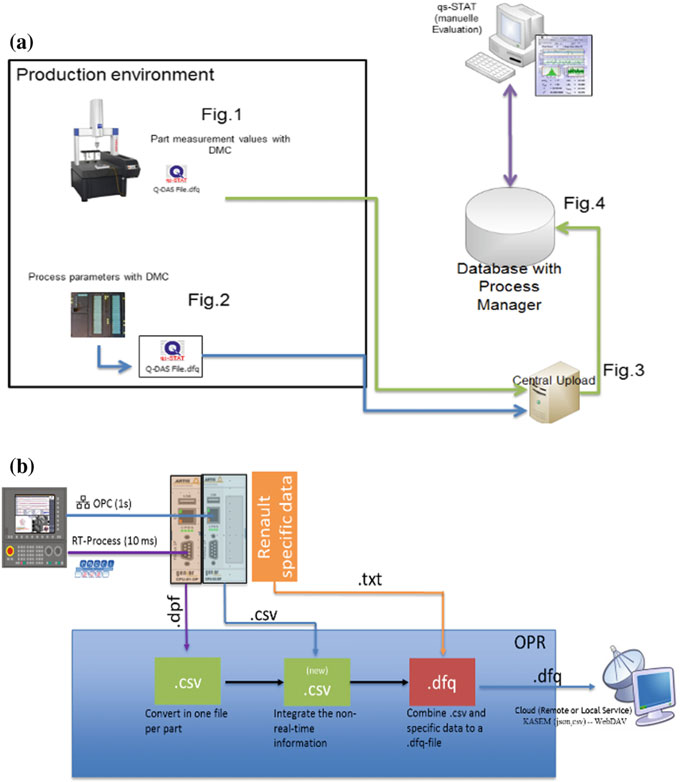
– Reduction of energy consumption (35%) of a machine in production by analysing the energy consumption by components.
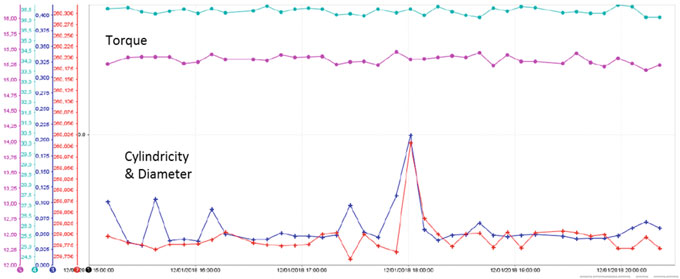


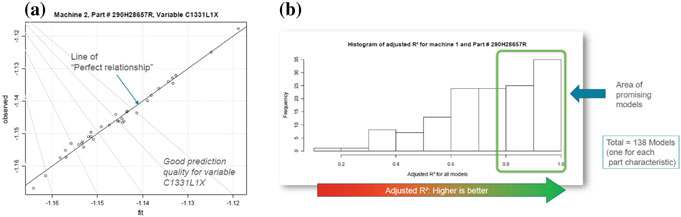


– Detect quality deviations, minimize scrap parts and reduce part measurement load by integrating quality and process data.
Open Access This chapter is licensed under the terms of the Creative Commons Attribution 4.0 International License (), which permits use, sharing, adaptation, distributionas long as you give appropriate credit to the original author(s) and the source, provide a link to the Creative Commons license and indicate if changes were made.
Each development of the project has been validated at research level, showing promising results. However, the aim of Twin-Control, from its gestation, was to provide industrial sense to all this new ICT tools, and hence, a complete industrial validation and evaluation approach has been designed and executed, based in two scenarios from two of the most critical manufacturing sectors in Europe: automotive and aerospace. Twin-Control features have been implemented, validated and evaluated (analysing its impact) in each of the proposed scenarios. The results have been very positive and the impact or potential impact, in case of further utilization of the tools, is very high at all levels: machine tool design, process design, main-tenance, process control and quality control.
Developments of the project have been grouped according to their application field and possibilities for joint exploitation:
• Towards application of proactive maintenance, two main issues need to be overcome in the future. First one is the reluctance of machine end-users to share data with third parties. Platform developers and Operations and Maintenance (O&M) providers need to work together to present data monitoring and ana-lytics as a safe and very profitable service for them. Second one is the need of knowledge about the analysed systems before applying a real proactive strategy.
In this line, customer must be aware of the need to implement monitoring and data management systems a long time before being able to predict failures.