
Explores nosql databases read and write operations
Scenario
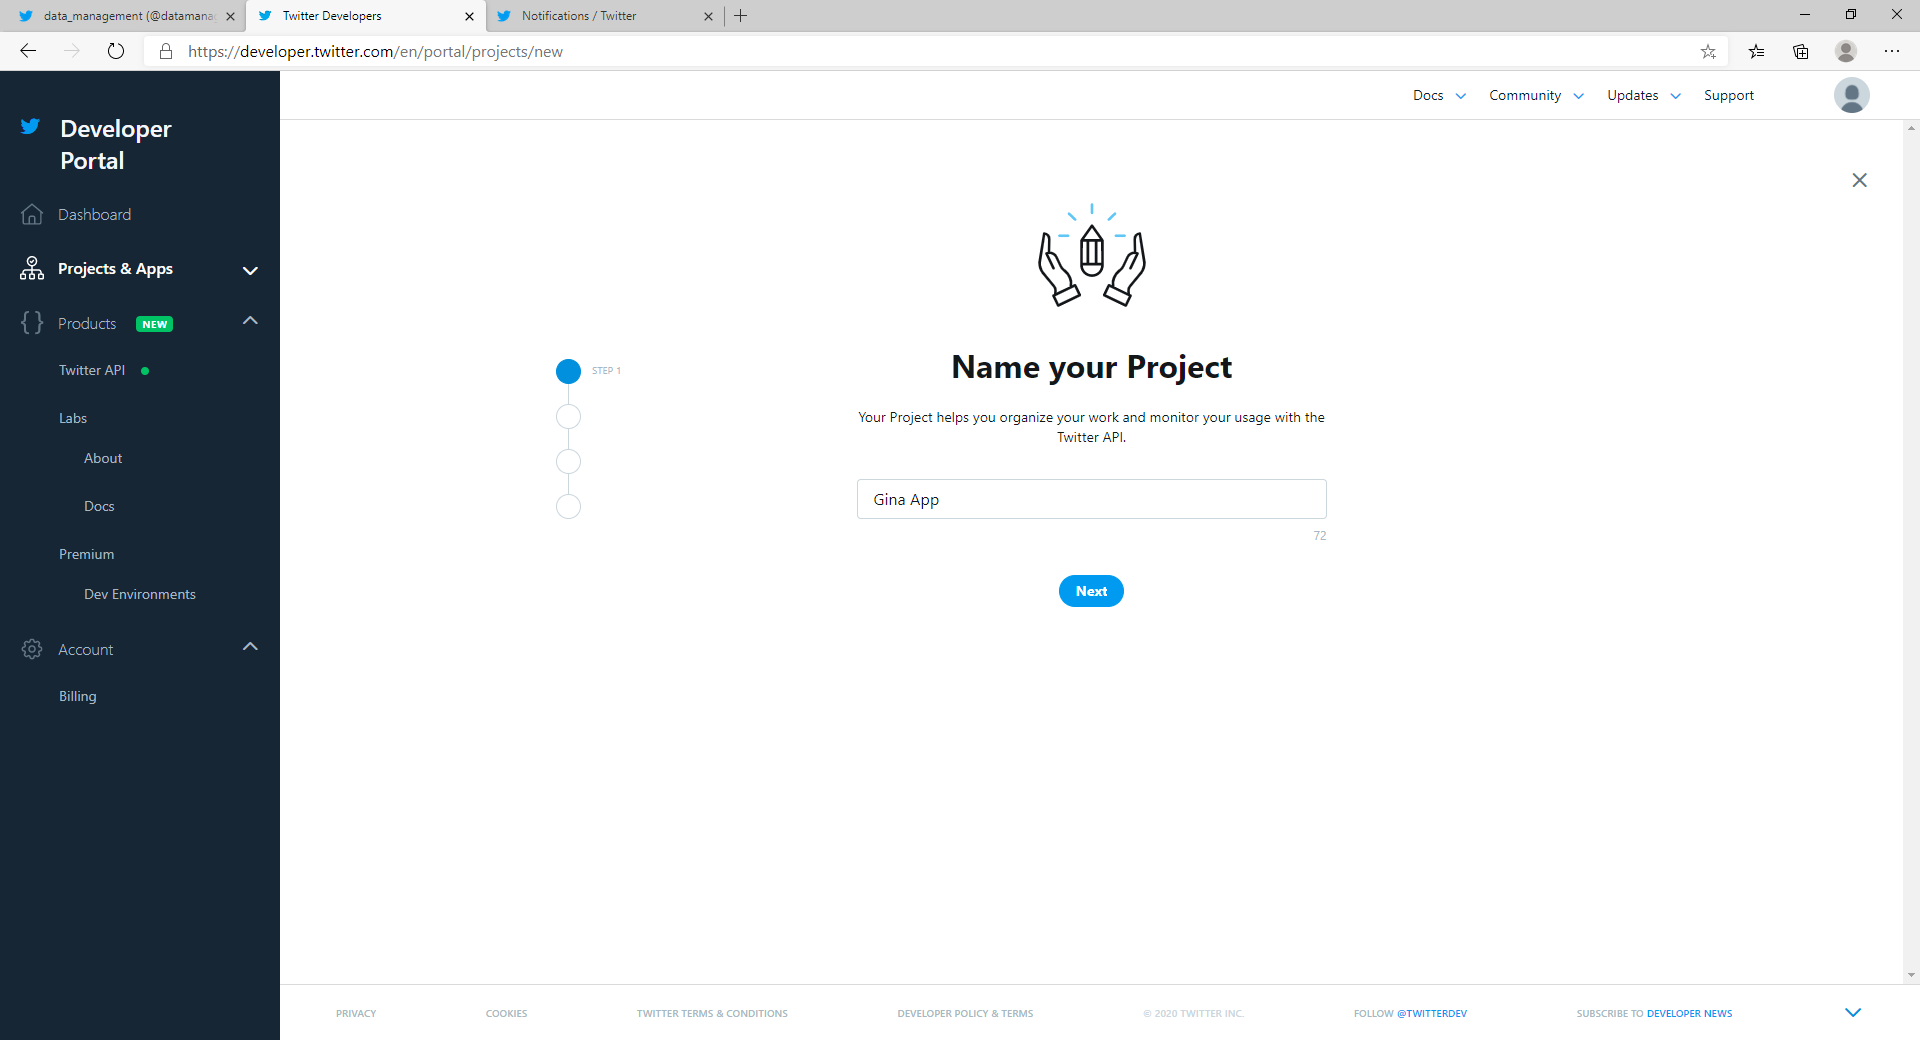
For the final project you will use the Twitter API to download tweets and store them in a MongoDB database. You will develop reports on these tweets and then create an interactive map showing statistics about the tweets.
Final Project: Data Analytics With Twitter
Objectives
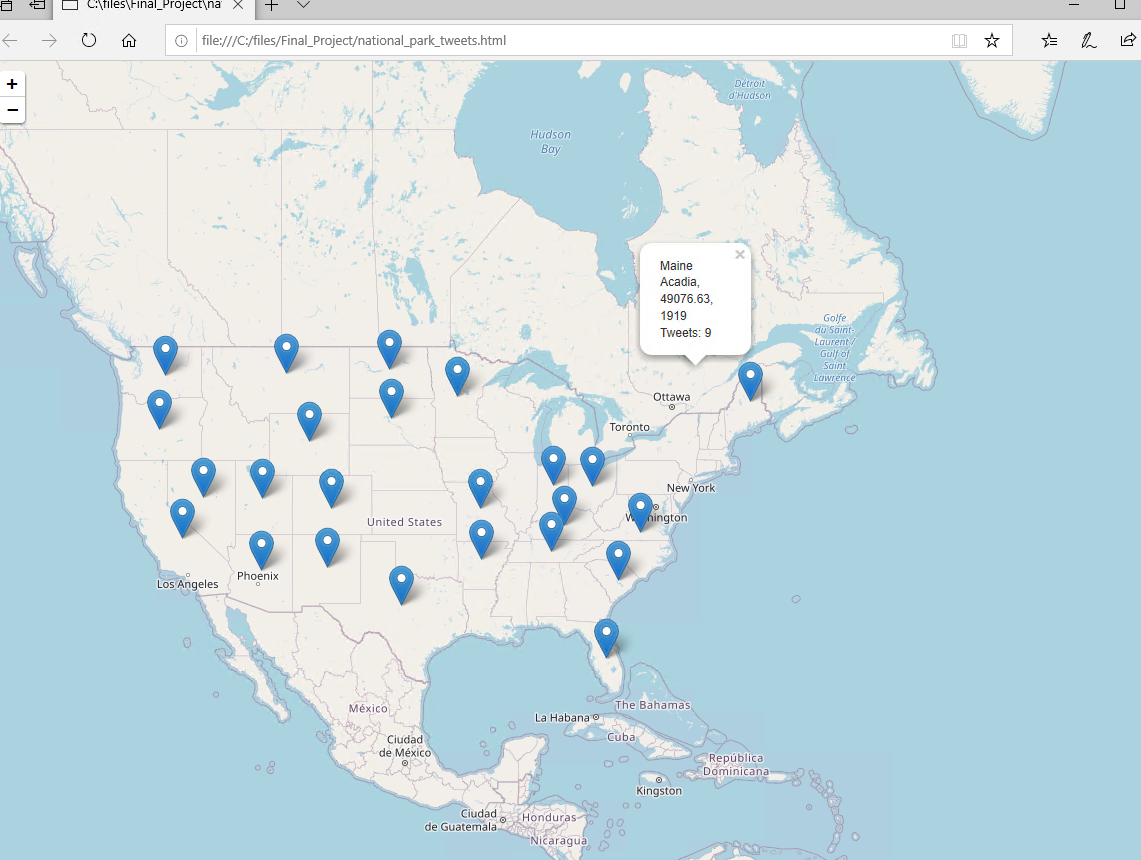
Create an interactive map based on the Twitter data
Twitter and Python
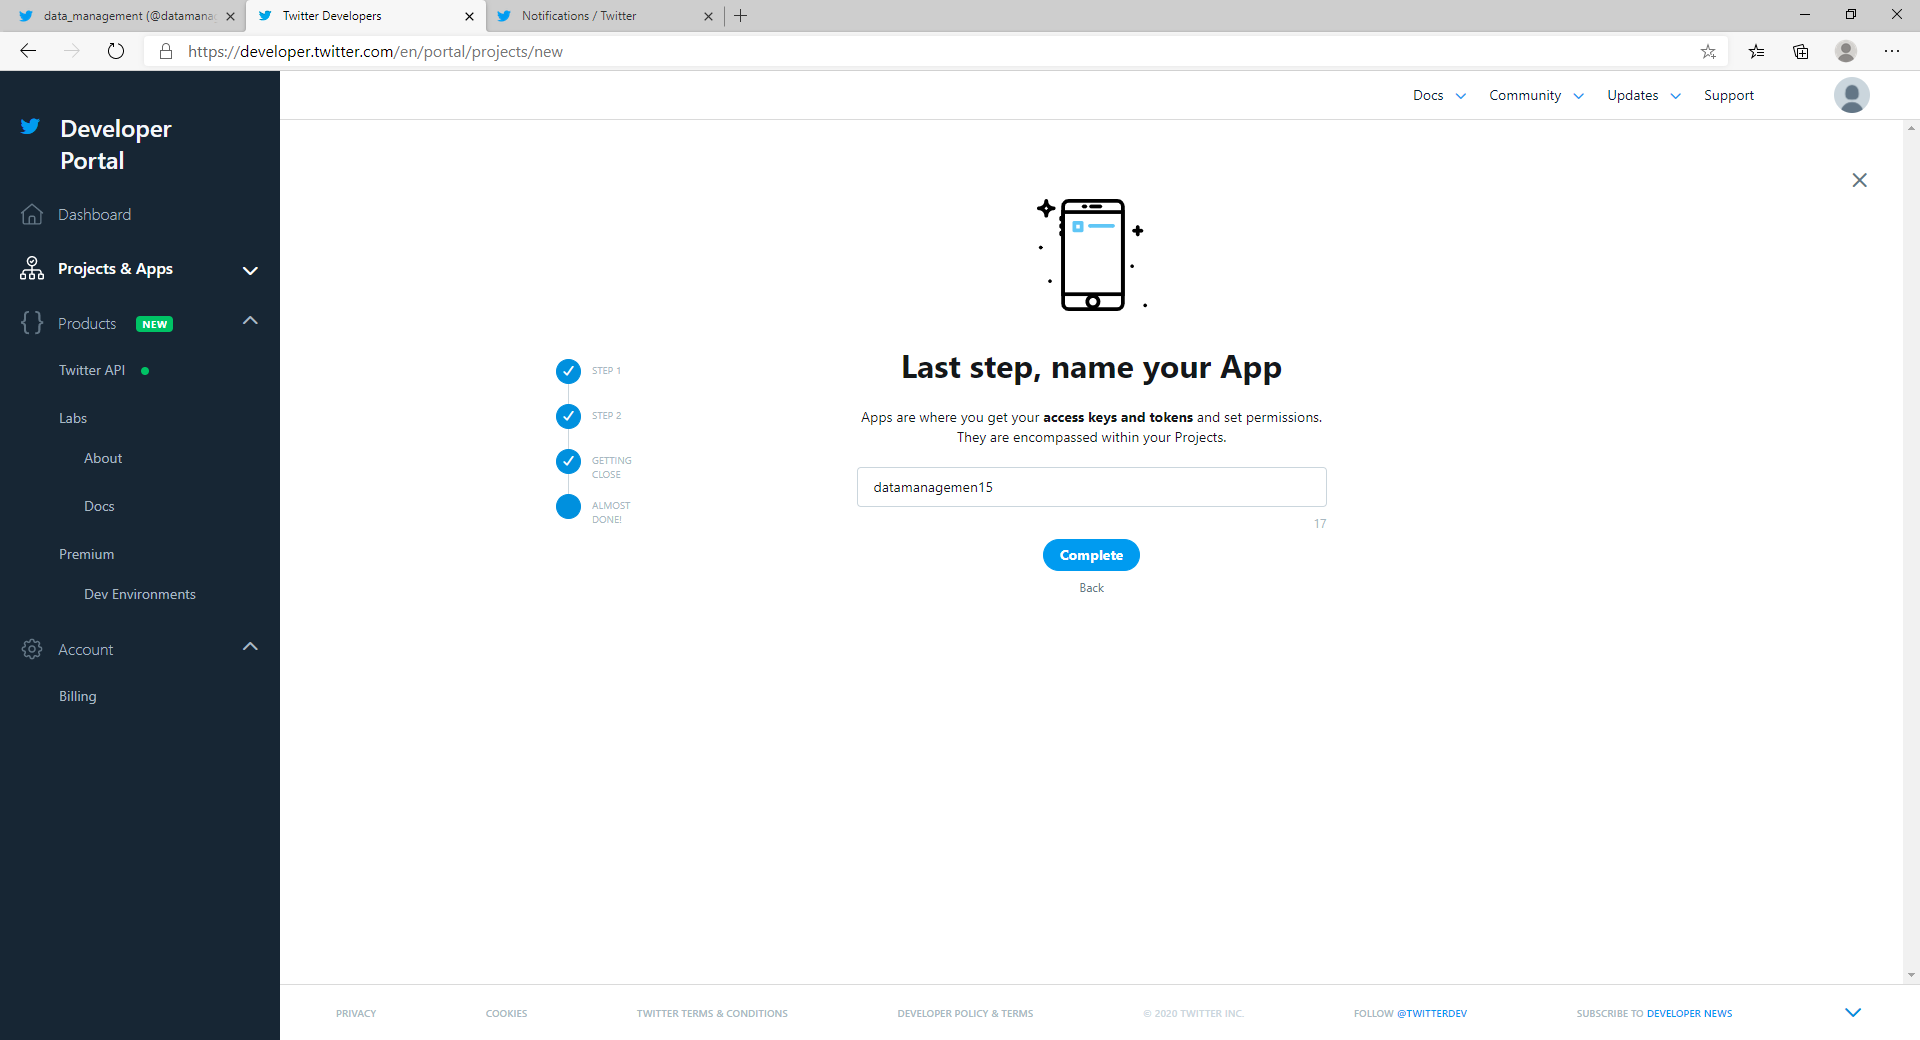
Twitter was developed in 2006 as an application for users to write small messages for followers to read. It has developed into one of the most popular social media applications available today. Twitter is used by many companies for data mining purposes. They provide access to their cloud-based web service. You will need an authentication API key that we will obtain using the developer account you created in an earlier step in the project. You can use this developer account to do your own data mining for future projects.
In the next slide, what best describes you – choose Student.
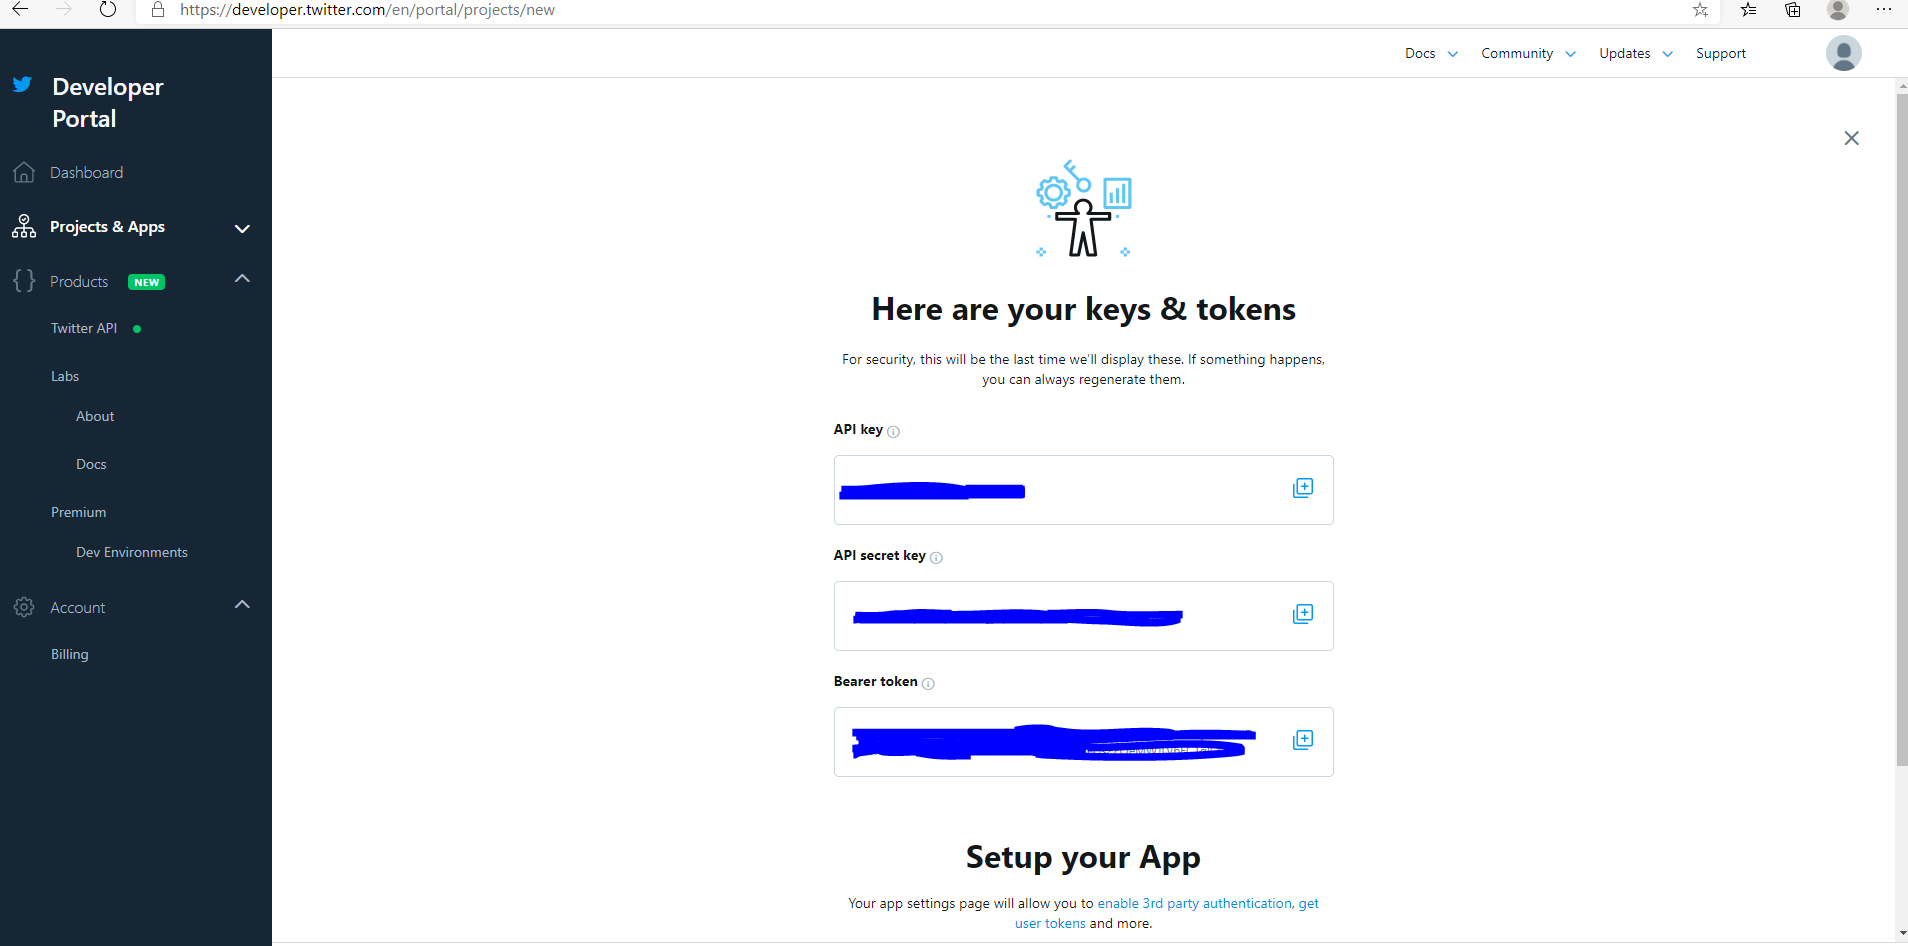
You will need all four of these keys to authenticate to the Twitter API.
Open the Azure Lab environment. In the C: drive, there is a folder called Files. In Files, you will find Final_Project. In this folder are several Python programs. We will use these in the final project. If you want to do the final project on your own computer, then finalprojectstart.py, finalprojectMapStart.py, finalproject_keys.py, finalproject_statecodes.py, and TweetStream.py are available for download.
access_token_secret = ''
mapquest_key = 'gkQWpPFx9HpjPvCjEhr52sWi8Mzz2QWa'
Open Spyder again and finalprojectstart.py. Most of the code is written for you, but you will need to add your own code. First let’s discuss the purpose of this code. This Python program will connect to twitter using the API keys you provided. The program will read in a csv file into a pandas data frame, connect to MongoDB, connect to the Twitter API, then read the tweets (in json format) into the MongoDB Project database and the twitter_feed collection.
The CSV file will contain the Twitter handle, Twitter id, and state data. You can feel free to use any Twitter accounts you want. The example is national parks and the nationalparks.csv file contains this information. As long as you have those three fields, you can use any account you want. You may want to create your program with museums, NFL teams, NBA teams, MLB teams, hockey teams, state governments, and so forth—any Twitter accounts you want. Use the handle to search for the twitterID and put it in the same format as nationalparks.csv.
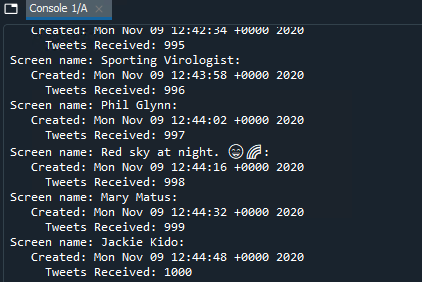
Once the program is finished and you see the prompt, the data is now populated in MongoDB.
MongoDB Reports
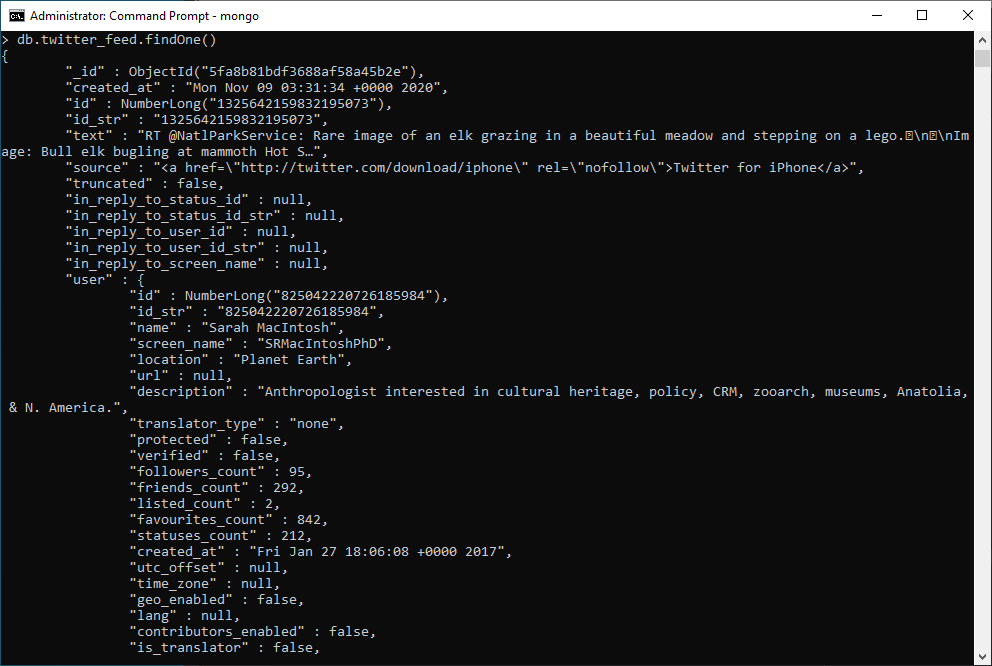
It’s important to know the content of the JSON documents.
You will be creating at least five queries in MongoDB as social media analytics on the Twitter data. The first four queries are guided below and the fifth query can be any query you choose. The video will show examples on how to write these queries. In order to speed up querying, we will create an index on every key in the twitter_feed collection. To do this, use the command (note the $** simply means create an index on all fields and subfields in a document).
Query 4: Let’s analyze the text of the tweet. Depending on your example Twitter feed, there are a variety of keywords you may want to search for. If you are looking at sports Twitter feeds, you may want to look at injury reports or trading. If you are looking at government, you may want to review legislation. For museums, you may be concerned about open admission. For this example we will search for texts containing the word picture.
Query 5: Develop your own query.
Interactive Map
You will need to create the mongo_client and set the database to Project.
Next, create two lists: one named tweets and one named park_locations.
Deliverable
Create a report about your data mining with Twitter. The report should have the following sections.
Reports Query 1–5: Show the purpose of the query, the code you used to run it, the result, and your analysis. Your analysis can be a simple explanation of what you see or feel free to extrapolate on your result.
Visualization: Include the html map with your final project deliverable. Explain how it visually illustrates the data from the database.
| Criteria | Ratings | Pts | ||||
|---|---|---|---|---|---|---|
| This criterion is linked to a Learning Outcome. Analyze a complex computing problem and retrieve, organize, and manipulate data. | 10.0 pts | 8.0 pts | 6.0 pts | 4.0 pts | 0.0 pts | |
| Report includes data section. Twitter handles used for project explained as well as the fields in the csv file listed. | Report includes data section. Twitter handles used for project explained; no fields in the csv file listed. | Report includes data section. Twitter handles used for project not explained. | Report includes data section and does not mention Twitter handles. | No data section was created. | ||
| This criterion is linked to a Learning Outcome. Design, implement, and evaluate a computing solution and analyze data, test hypotheses. | 90.0 pts | 72.0 pts | 54.0 pts | 36.0 pts | 0.0 pts | |
| Project was built using principles of technology with no errors. The following were included: 1. Developer Twitter account created 2. Python code created to pull data from Twitter 3. Queries were created in MongoDB 4. Python code created to develop html map 5. Html map developed based on Twitter feeds | Project was built using principles of technology with minimal errors. 1. Developer Twitter account created 2. Python code created to pull data from Twitter 3. Queries were created in MongoDB 4. Python code created to develop html map 5. Html map developed based on Twitter feeds | Project was built using principles of technology with occasional errors. 3 of 5 present 1. Developer Twitter account created 2. Python code created to pull data from twitter 3. Queries were created in MongoDB 4. Python code created to develop html map 5. Html map developed based on twitter feeds | Project was built using principles of technology with frequent errors.2 of 5 present 1. Developer twitter account created 2. Python code created to pull data from Twitter 3. Queries were created in MongoDB 4. Python code created to develop html map 5. Html map developed based on Twitter feeds | No (0%) project was built using principles of technology | ||
| This criterion is linked to a Learning Outcome. Communicate effectively in written, oral, and graphical forms, and apply graphical presentation and visual representation techniques. | 30.0 pts | 24.0 pts | 18.0 pts | 12.0 pts | 0.0 pts | |
Professional report missing one of the following: Introduction, Software, Data, Creating the Database, Reports, Visualization, Conclusions and Skills Obtained sections. Map visualization with markers clearly present |
No report created | |||||
| This criterion is linked to a Learning Outcome. Make informed judgements in computing. | 25.0 pts | 20.0 pts | 15.0 pts | 10.0 pts | 0.0 pts | |
Clear explanations in report about: 1. Purpose of the project 2. Why Twitter data is best for a NoSQL database 3. Analysis of queries |
Missing explanation about two of the following: 1. Purpose of the project 2. Why Twitter data is best for a NoSQL database 3. Analysis of queries |
No question was analyzed. | ||||
| This criterion is linked to a Learning Outcome. Function effectively as a member of a team. | 10.0 pts | 8.0 pts | 6.0 pts | 4.0 pts | 0.0 pts | |
| Project submitted on time. No grammar or spelling errors. Professional design. | Project submitted on time. Some grammar or spelling errors. Professional design. | Project submitted on time. Several grammar or spelling errors. | Project not submitted on time. | No paper was created. | ||
| This criterion is linked to a Learning Outcome. Support delivery, use, and management of systems in software development. | 10.0 pts | 8.0 pts | 6.0 pts | 4.0 pts | 0.0 pts | |
| Software section of report listed all software used in the project. | Software section of report listed some software used in the project. | Software section of report missing several software applications used in the project. | Software section of report listed none of the software used in the project. | No software section was present. | ||