
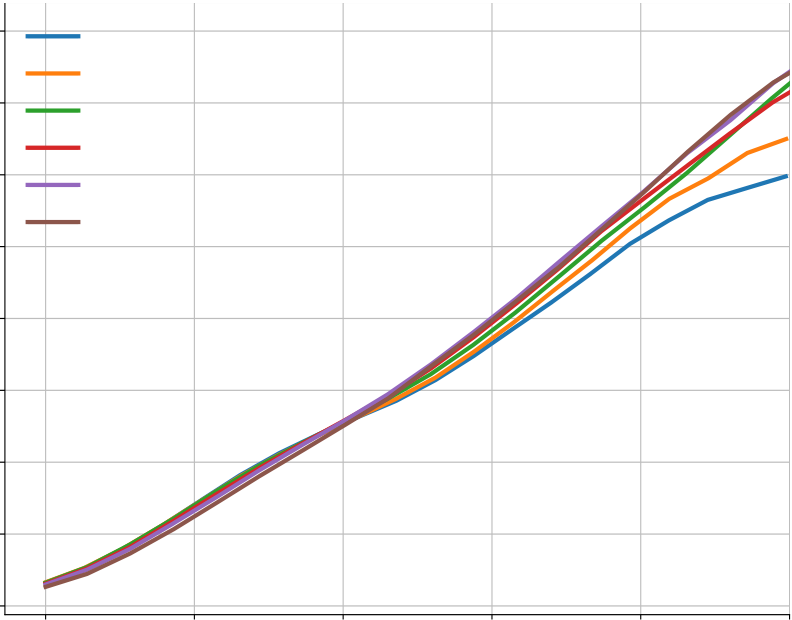
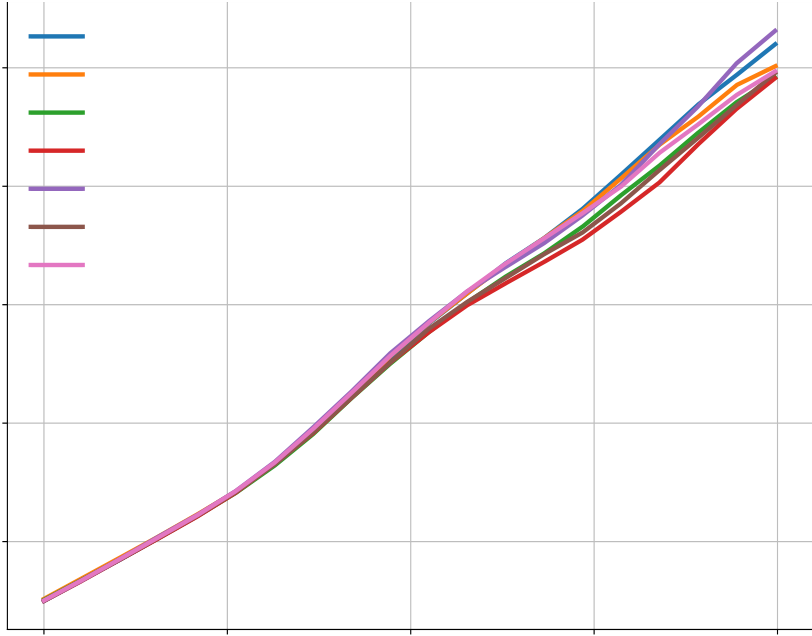
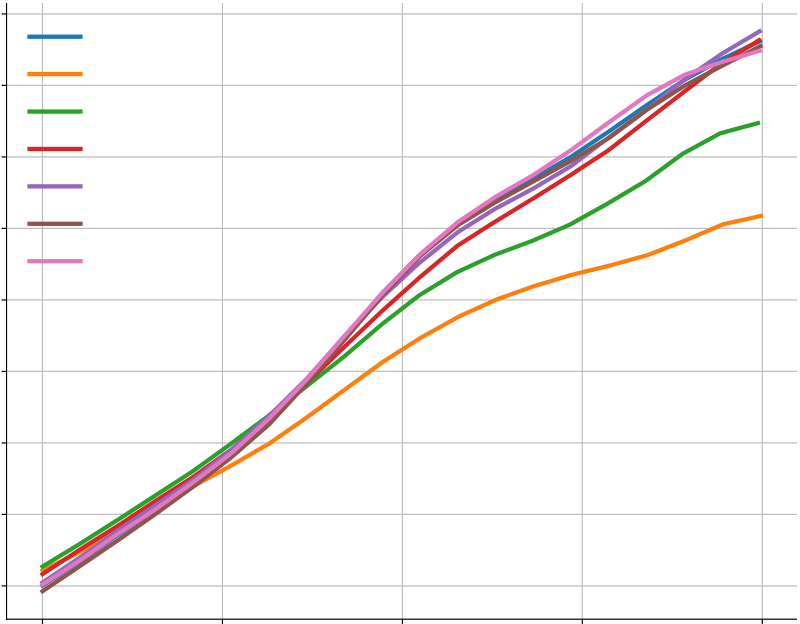
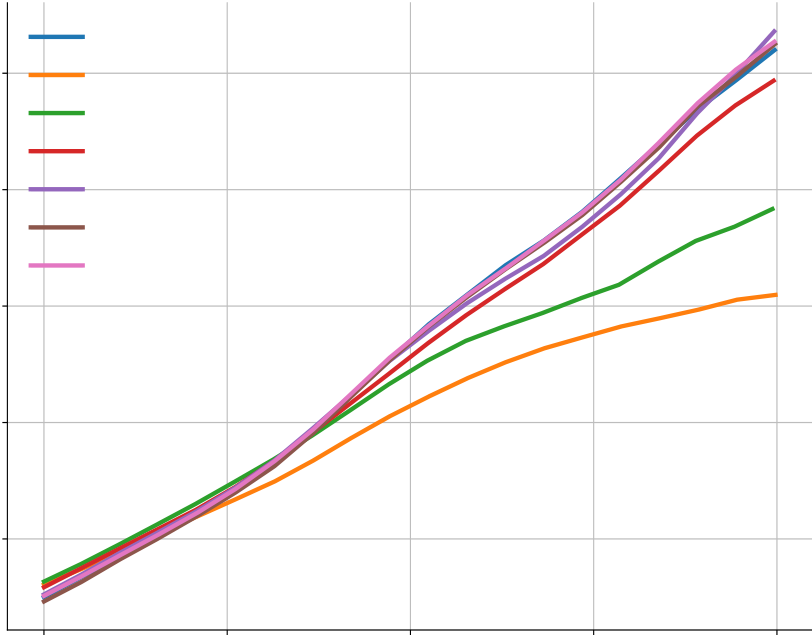
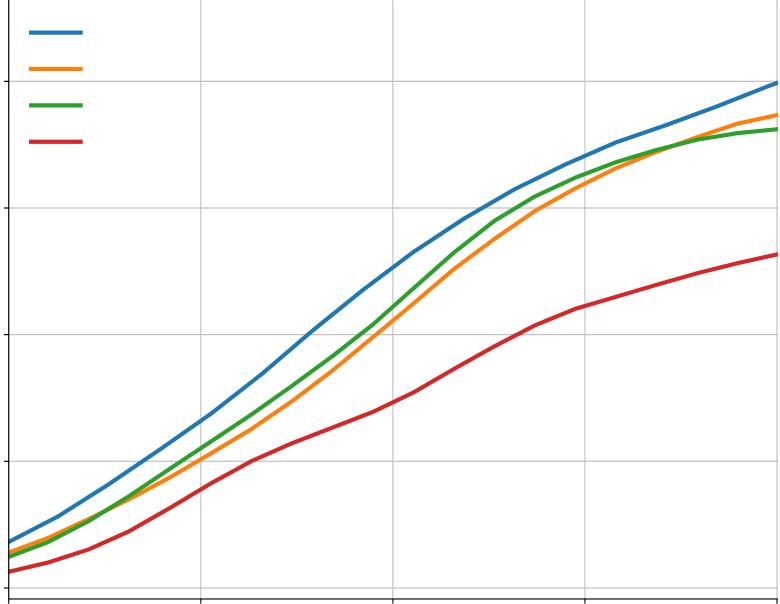
Figure c-e shows the results for top-k sampling and nucleus sampling
| 1 |
|
2 | 5.4 | Results on APPS . . . . . . . . . . | 19 | |
|---|---|---|---|---|---|---|
| 2 |
|
6 |
|
|||
| 3 | ||||||
| 4 | 7 |
|
||||
|
|
|||||
| 5 | 8 | |||||
|
||||||
| 9 | 31 | |||||
| 38 | ||||||
Corresponding author(s): yujiali@deepmind.com, davidhchoi@deepmind.com© 2022 DeepMind. All rights reserved
Competition-Level Code Generation with AlphaCode
Competitive programming problems represent a significant step forward in all these aspects. Solving such problems requires understanding complex natural language descriptions, reasoning about previously unseen problems, mastering a wide range of algorithms and data structures, and precisely implementing solutions that can span hundreds of lines. Solutions are evaluated by executing them on an exhaustive suite of unknown tests, checking for correct behaviour on edge cases as well as execution speed. The fact that the test cases used for evaluation are hidden is an important part of the challenge. These complex problems are newly created for each competition, with the understanding that competitors can draw on solutions to previous contests (either implicitly, by remembering old problems, or explicitly, by searching for them). Moreover, competitive programming is very popular; events like the International Collegiate Programming Competition (ICPC, 2021) and the International Olympiad in Informatics (IOI, 2021) are widely recognized as some of the most prestigious competitions in computer science, drawing hundreds of thousands of participants from around the world. Using problems that humans find challenging from such battle-tested competitions ensures robustness against shortcuts and provides a meaningful benchmark for many aspects of intelligence.
Early work using program synthesis for competitive programming has shown that large transformer models can achieve low single-digit solve rates (Chen et al., 2021; Hendrycks et al., 2021), but could not yet reliably generate solutions for the vast majority of problems. Furthermore, as we show in Section 3.2.1, the lack of sufficient test cases in existing competitive programming datasets makes
1591 1613 1617 1619 1622
1608 1615 1618 1620 1623
AlphaCode80%
rating %competitors
60%
AlphaCode ranked in the top 54.3% among contest participants averaged over 10 contests, and Figure 1 | AlphaCode’s ranking on 10 Codeforces contests and estimated rating (right is better).
achieved an estimated average rating of 1238. (a) shows the ranking of participants (x-axis) and their ratings (y-axis), as well as AlphaCode’s ranking for each of the 10 contests. (b) shows the estimated rating of AlphaCode among users who have participated in at least 1 contest in the last 6 months. AlphaCode’s estimated rating is in the top 28% among these users.
1 .
2
3 metrics because top competitors compete more regularly than others. Thus, the pool of competitors which perform better than AlphaCode is more homogeneous, resulting in a better Elo than average ranking.
2.1. Competitive programming
Programming competitions first began in the 1970s and have since grown in popularity to include hundreds of thousands of participants worldwide. The annual International Collegiate Programming Contest attracts almost 60,000 students from over 3,000 universities (ICPC Factsheet, 2020), and
|
|---|
The exact format of a programming competition varies between contests, but in general individuals or teams of competitors are given between 5 and 10 problem descriptions (Figure 2), and approximately 3 hours to write programs (Figure 3) to correctly solve as many problems as possible. The program submissions are sent to a server which automatically evaluates them on an exhaustive set of hidden tests (Figure A1). Competitors are told whether or not their submission passed all tests, though not necessarily the exact cause of a failure. There are penalties based on the number of incorrect submissions per problem and the amount of time it took to solve each problem (ICPC Rules, 2021). Submissions can be written in a variety of programming languages, among which C++and Python are currently the most popular. Problems are often given ratings to indicate difficulty, and more difficult problems are worth more points.
There are three steps involved in solving a problem. First, participants must read and understand a natural language description spanning multiple paragraphs that contains: narrative background typically unrelated to the problem, a description of the desired solution that the competitors need to understand and parse carefully, a specification of the input and output format, and one or more example input/output pairs (that we call “example tests”).
Competition-Level Code Generation with AlphaCode
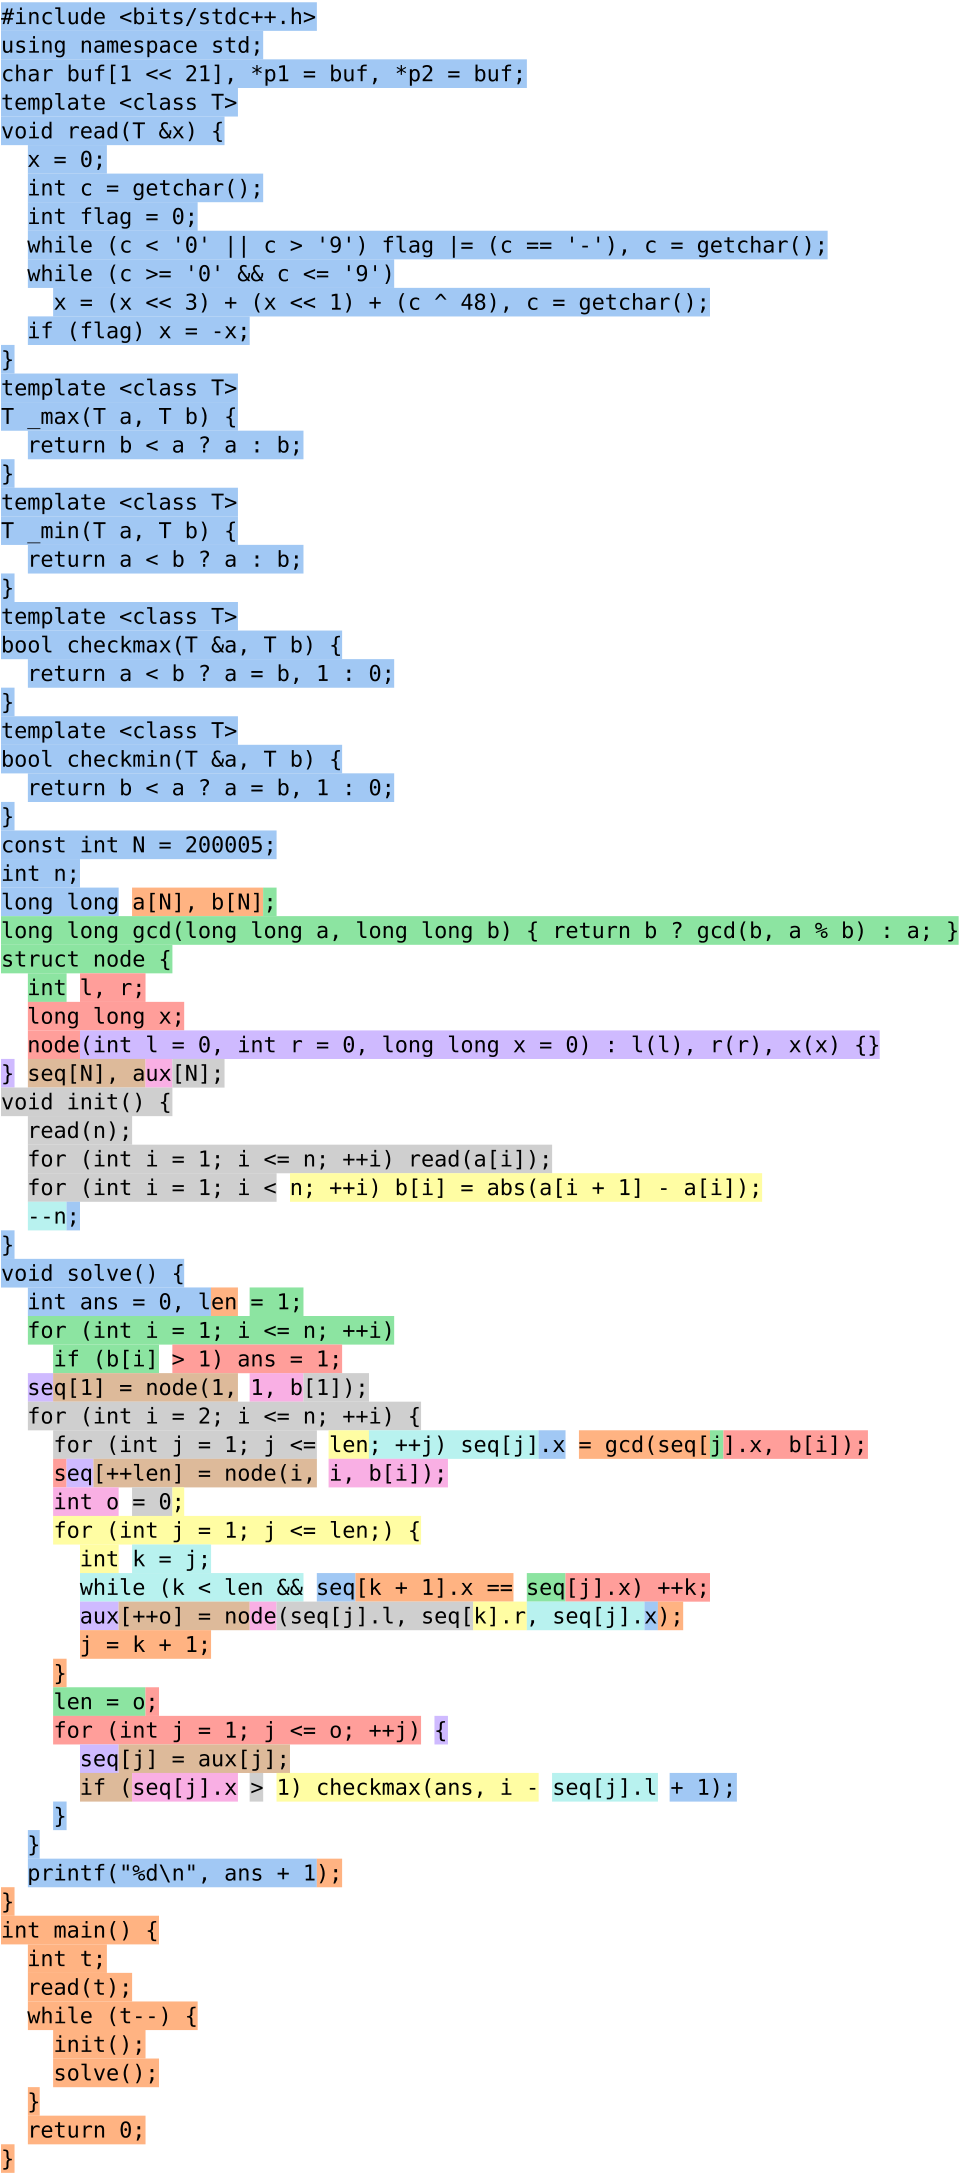
constraints (harder problems can sometimes only be solved in faster languages such as C++), subtle edge cases can be difficult to account for, and the solution itself can be over a hundred lines of precise code. Participants are given small example test cases to run against, and often debug, fix, and rerun their candidate submission many times before attempting an official submission against the hidden tests cases. An example correct solution generated by AlphaCode for the problem in Figure 2 is given in Figure 3, and extensive results and analysis can be found in Section 5 and 6.
The setting we use to model programming competitions is 10@푘 – 10 submissions per problem from 푘 samples. We also use 푝푎푠푠@푘 (solve rate with 푘 samples), to be consistent with Chen et al. (2021), which assumes all samples can be submitted for evaluation. 푝푎푠푠@푘 = 푘@푘, and is an upper bound metric for using 푘 samples. We show solve rate with respect to different 푘 values as good results at low sample budgets do not necessarily correlate with good performance at high sample budgets.
3. Datasets
Competition-Level Code Generation with AlphaCode
Lua, PHP, Python, Ruby, Rust, Scala, and TypeScript. Following previous work (Chen et al., 2021), we filtered out all files larger than 1MB or with lines longer than 1000 characters, to exclude automatically generated code. We also removed duplicates of the same file, ignoring whitespace in comparisons. After filtering, our final pre-training dataset contains a total of 715.1 GB of code. The dataset composition across languages can be found in the appendix (Table A1).
The correctness of a program is checked by executing it on the test cases and comparing the program output with the expected correct output. More details about this correctness checking process are documented in Appendix A.2.
3.2.1. False positives and additional generated tests
solutions that do not fulfill time and memory constraints are marked correct (e.g. a solution that is of the wrong complexity class).
Competition-Level Code Generation with AlphaCode
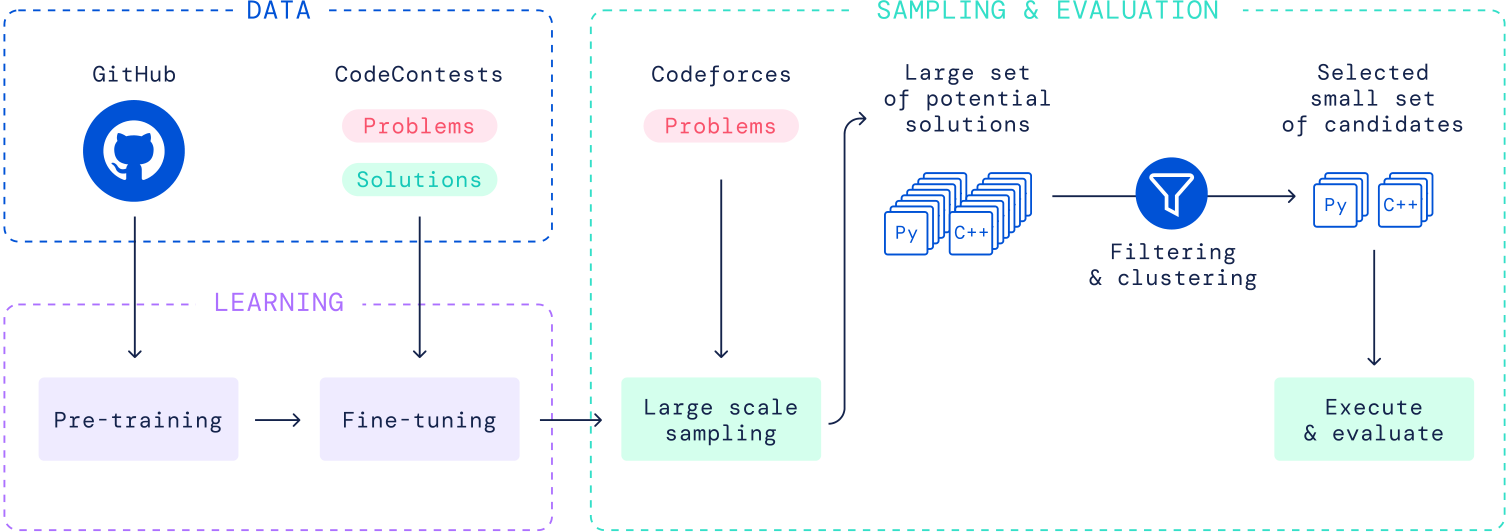
Our system, AlphaCode, is meant to address all these challenges. A high-level view of our approach can be seen in Figure 4. The main process is to:
1. Pre-train a transformer-based language model on GitHub code with standard language modelling objectives. This model can reasonably represent the space of human coding, which greatly reduces the problem search space.
4.1. Model architecture
The competitive programming code generation problem can be viewed as a sequence-to-sequence (Sutskever et al., 2014) translation task: given a problem description 푋 in natural language (e.g. Figure 2), produce a corresponding solution 푌 in a programming language (e.g. Figure 3). This naturally motivates the choice of an encoder-decoder transformer architecture (Vaswani et al., 2017) for AlphaCode, which models 푝(푌|푋). The architecture takes as input to the encoder the problem
| 푑푚표푑푒푙 |
|
Batch | Training Steps | ||||||
|---|---|---|---|---|---|---|---|---|---|
|
|||||||||
|
1 1 1 4 16 |
|
354B 590B 826B 1250B 967B |
||||||
description 푋 as a flat sequence of characters (including metadata, tokenized), and samples 푌 autoregressively from the decoder one token at a time until an end of code token is produced, d and run (see Appendix F for example 푋, 푌 pairs, and for an interactive model visualisation).
Compared to decoder-only architectures commonly used for language modeling and generation, an encoder-decoder architecture allows a bidirectional description representation (tokens at the beginning of the description can attend to tokens at the end) and the extra flexibility to untie the encoder structure from the decoder. Because problem descriptions are on average twice as long as their corresponding human solutions, we use an asymmetric architecture with 1536 tokens for the encoder but only 768 tokens for the decoder. We further found that using a shallow encoder and a deep decoder significantly improves the efficiency of training without hurting problem solve rate. The exact architectures for our models are listed in Table 3. The 9B and 41B models were trained using model parallelism, with 1 key and value head per shard. We built our model using JAX (Bradbury et al., 2018) and Haiku (Hennigan et al., 2020), and trained them on TPUv4 accelerators using bfloat16 precision.
Our base 1B parameter model was trained for 106steps with a batch size of 256. Following Kaplan
10
We trained all models using the AdamW variant (Loshchilov and Hutter, 2017) of the Adam opti-miser (Kingma and Ba, 2014) with 훽1 = 0.9, 훽2 = 0.999 for {300M, 1B, 3B} models, and 훽2 = 0.95 for {9B, 41B} models. We used a weight decay of 0.1 to enhance regularization. We trained the models with an initial learning rate of 10−4, which was then cosine decayed to 10−5at the end of pre-training. We linearly warmed-up the learning rate from 10−9to 10−4over the first 1, 000 training steps, and clipped the global gradient norm to stay below 1.0.
4.3. Fine-tuning
Competition-Level Code Generation with AlphaCode
task during training such that the last layer token representations before projecting to logits are also used in a small Transformer to classify whether the submission is correct. Value prediction was not used during sampling.
importance weight use the tempered distribution.
4.4. Large scale sampling
12
Competition-Level Code Generation with AlphaCode
Filtering using example tests can still leave thousands of candidate programs per problem. Randomly picking from this pool wastes the limited submission budget on programs that are syntactically different but semantically equivalent. Semantically equivalent programs could be detected if we had additional test inputs, by executing all remaining programs on these inputs and grouping programs that produce the same outputs together into clusters. We could then avoid repeatedly picking from the same clusters.
We trained a separate test input generation model, using the same architecture as our main models, and initialised from the same GitHub pre-trained checkpoint. This model was trained to predict test inputs from problem descriptions, using example, hidden, and generated test inputs as training data. After training, this model was used to create new test inputs for unseen problems. Note that although these created test inputs are not guaranteed to be valid, especially when problems have complex constraints, imperfect and even invalid test inputs can still be useful for grouping sampled programs.
13
Competition-Level Code Generation with AlphaCode
| 1608 | 1613 | 1615 | 1617 | 1618 | 1619 | 1620 | 1622 | 1623 | |||
|---|---|---|---|---|---|---|---|---|---|---|---|
| 1591 | |||||||||||
|
|
|
|
||||||||
| Table 4 | Estimated percent ranking of our system in 10 Codeforces competitions (lower is better). For each contest, we show ranking using simulated time and incorrect submission penalties (Estimated), as well as the best and worst possible rankings using minimum and maximum possible time penalties as estimates, averaged over 3 evaluations. Percents are how many users performed better than AlphaCode. Our system achieved an overall ranking of top 54.3% averaged across the 10 contests. | |||||||||||
Evaluating on actual programming competitions checks program correctness more thoroughly, com-pared to evaluating on our dataset which has known weaknesses including false positives, accepting algorithmically inefficient solutions, and handling problems with multiple acceptable outputs. Ad-ditionally, evaluating in the real setting allows us to benchmark against the best performers on this task: human competitors.
We evaluated our best system on all Codeforces competitions from 2021/12/01 to 2021/12/28 with more than 5,000 participants per contest, a total of 10 competitions. The system was an ensemble of 41B and 9B models with clustering, which performed best on our validation set but turned out to be slightly worse than using the 41B model alone with clustering (see Appendix C.1 for more on ensembling). For each contest, we simulated running AlphaCode live, generating samples for each problem, filtering with example tests, and then clustering to get candidate submissions. We submitted these selected candidates to the Codeforces platform,6and computed AlphaCode’s placement in each contest. After the first run, we repeated this procedure two more times to measure variance and performance with more than 10 submissions. Sources of variance include problem distribution, model training, sampling, filtering, and clustering. See Appendix D for the exact evaluation procedure, and Table A5 and Table A6 for full results.
14
Competition-Level Code Generation with AlphaCode
Table 5 | Solve rates of our best systems on the validation set and test set.
The results are shown in Table 5. With up to a million samples per problem, we can solve 34.2% of problems in our validation set; and with one hundred thousand samples, we solve 31.8% of problems in our validation set, and 29.6% of problems in our test set. Because of the temporal split, no problem in either set was seen by our model. Given the difficulty of these problems (since they are problems given to the self-selected group of those who try competitive programming), this is a substantial proportion of the dataset.
Differences in solve rates between the validation and test sets are caused by variation in problem distributions (as the test set and validation set were collected in temporally disjoint periods), as well as some overfitting. However, the difference in performance between the two sets remains limited. The 41B consistently outperforms the 9B model, and clustering consistently provides an improvement.
Competition-Level Code Generation with AlphaCode
| 0.30 | 0.4 | ||
|---|---|---|---|
| 0.25 | 0.3 | ||
| 0.20 | |||
0.10
0.05 0.1
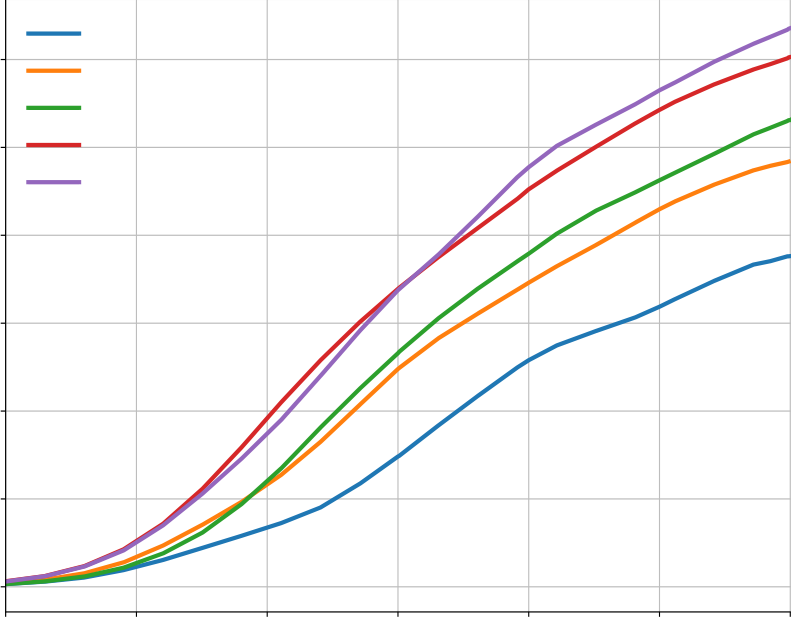
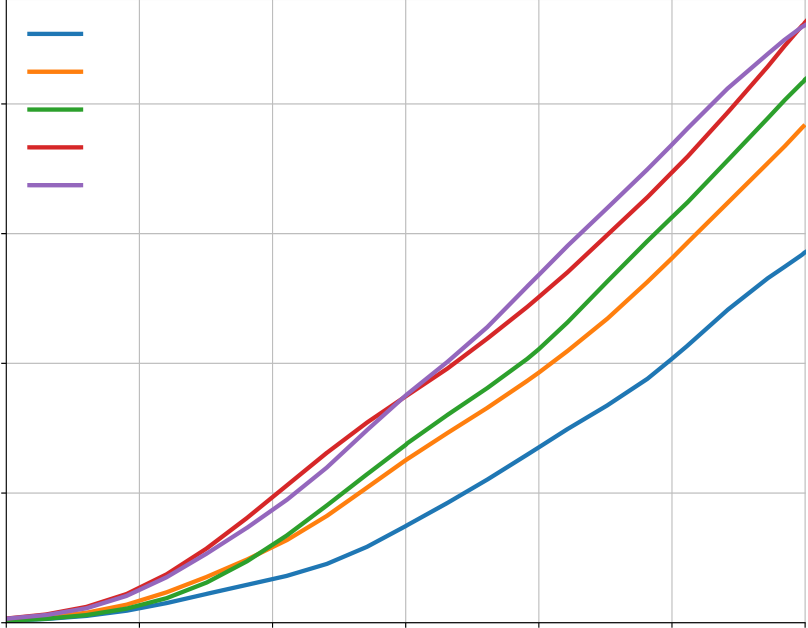
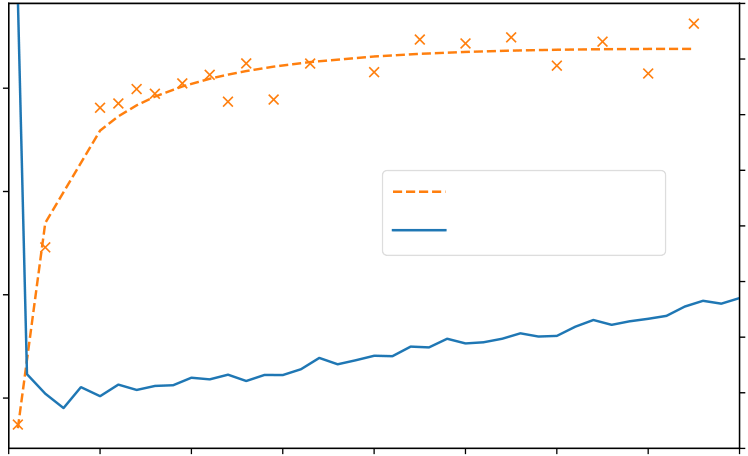
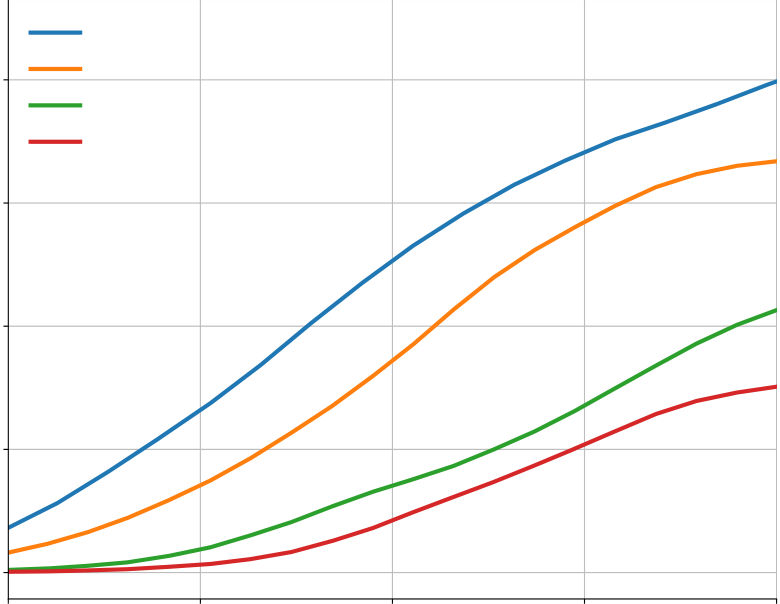
with the number of samples, although this tapers off slightly in the 10@k setting. The better, larger Figure 6 | Solve rate scaling vs. number of samples. The solve rate scales approximately log-linearly
scale models have higher scaling slopes in this log-linear plot.
10 samples can be submitted, scaling up the total number of samples leads to massive improvements
in model solve rate.
about this problem domain and our models:
Competition-Level Code Generation with AlphaCode
| 0.30 |
|
0.30 | |
|---|---|---|---|
| 0.25 | 0.25 | ||
| 0.20 | |||
| 0.15 | |||
| 0.10 | |||
| 0.10 | 0.05 |
Table 6 shows that our encoder-decoder model with multi-query attention significantly improves the sampling speed while keeping the sample quality at the same level as the more expensive alternatives.
17
| Pre-training dataset | 10@1K |
|
|
|---|---|---|---|
| No pre-training GitHub (Python only) MassiveText GitHub (all languages) |
5.3.4. Model enhancements
As discussed in Section 4, we adopted training and model enhancements which significantly improved the solve rate relative to the standard encoder-decoder transformer setup. Table 8 presents the results of a build-up ablation of the enhancements we added to AlphaCode, starting from the base setting with no enhancements (beyond the multi-query attention change discussed in Section 5.3.2). We added one new setting at a time, with the final setting that corresponds to AlphaCode reported at the bottom of the table. Each additional setting improves performance and combining the 5 enhancements together increases the 10@100k solve rate from 15.2% to 24.1%, although the contribution depends on the number of samples.
| samples pass example tests % Problems with ≥ 1 | Average 푝pass example tests on solved problems | |||
|---|---|---|---|---|
| Model | Average 푝pass example tests on all problems | |||
|
|
|||
Filtering using example tests. Table 9 shows the percentage of model samples that pass example tests and the percentage of problems where at least one sample passes example tests. Note that these percentages are calculated based on the full set of samples, without first filtering out programs that have syntax errors (see Section 6.2 for more on syntactic correctness of the samples). Overall less than 1% of samples from our models pass example tests, though the percentage varies greatly across problems, which means that filtering using example tests removes more than 99% of the model samples. On problems where our models do find a correct solution, the fraction of samples that pass example tests roughly doubles but still remains at a low level. The non-uniform distribution of 푝pass example tests across problems is highlighted more in Appendix C.3.
Another observation from Table 9 is that larger and better quality models produce samples more likely to pass example tests, and pass example tests for significantly more problems. With 106 samples, our largest 41B models can generate solutions that pass example tests for over 90% of problems, a remarkable success as finding programs that satisfy I/O example constraints remains a very challenging problem.
19
Solve rate
0.20
0.15
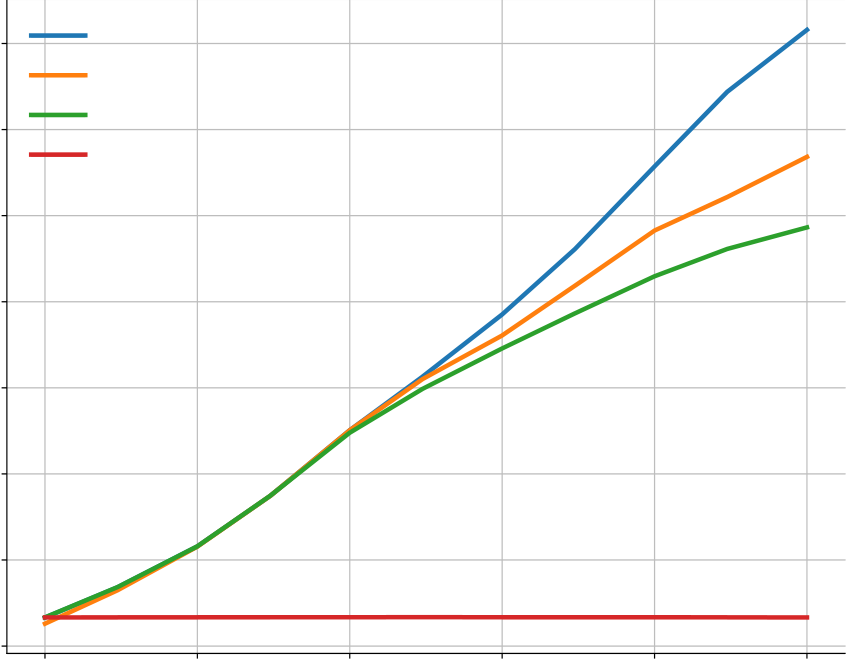
Figure 8 | Comparison of different sample selection methods. We show random selection (“10@k no filtering”), filtering using example tests (“10@k with filtering”), clustering after filtering (“10@k with filtering + clustering”), and perfect sample selection (“pass@k”).
method. We therefore followed the settings we used for pre-training on GitHub, and fine-tuned our pre-trained models on the APPS training set without using clustering, tags, ratings, value conditioning, or prediction, and with sampling temperature 0.25 and nucleus sampling. Other settings were the same as our main models.
20
Competition-Level Code Generation with AlphaCode
| Filtered From (푘) | Attempts (푛) | Introductory n@k | Competition n@k | ||||
|---|---|---|---|---|---|---|---|
| Interview n@k | |||||||
|
|
||||||
|
|
||||||
|
|
||||||
| N/A | 1000 | 17.67% | 5.24% | ||||
|
|
||||||
| Table 10 | n@k results on APPS. If there is no filtering, then 푛 = 푘 and the metric is pass@k. Finetuned GPT-Neo numbers reported from Hendrycks et al. (2021), Codex numbers from Chen et al. (2021). We used a time limit of 3 seconds per test to match Codex 12B, and report average numbers over 3 different fine-tuning runs for AlphaCode. | |||||||
Based on the results in Appendix B.3, simply copying full solutions from the training set is not sufficient to solve any problems in the unseen validation set. However, it might be possible to solve problems by duplicating large or critical parts of previous solutions, if problems are sufficiently similar to previous ones. To investigate this, we found the longest common substrings between correct validation problem solutions generated by the model and the entire training dataset (GitHub + CodeContests, ignoring whitespace), and compared the distribution of the lengths of these matches to human solutions. Figure 9 contains these results, using 50 C++and 50 Python solutions from a selection of 16 validation problems that had that many solutions.
The figure shows that model and human solutions share substrings with the training data at similar rates, although the average longest common substring is slightly higher for model solutions, and human solutions have a heavier tail. The common substrings between model solutions and training data mostly contained boilerplate code for reading and parsing the input data format, rather than key logic for solving problems (for example, a FastIO Python class has length 805 and appears in 1.66% of all human Python solutions). AlphaCode thus does not seem to solve problems by copying long blocks of code.
We measured the proportion of samples from the model that are syntactically correct (i.e. compile for C++, and do not generate a SyntaxError for Python) for each language and model size. As shown in Table A7, our models tend to produce mostly syntactically correct programs for Python, and C++ syntax is harder to master than Python.
We further analysed the amount of dead code (i.e. lines of code that have no impact on program behaviour) in our solutions. Such code is present in our training data; for example competitors will sometimes copy-paste unused imports or functions. High amounts of dead code could indicate the model has a poor understanding of what it is generating. Figure 11 shows the results of applying a standard code formatter and Python’s Abstract Syntax Tree (ast) module on correct Python human and model solutions to remove unused imports, functions and classes. AlphaCode generates approximately the same amount of dead code as humans.


|
|---|
23
700 best fit slope 0.62 700 best fit slope 0.67
Normalized solution length
Normalized sample length
600 600100 100
0 0
Appendix E.2 contains the solve rate of our models in different problem difficulty rating buckets.
Unsurprisingly our models have significantly higher overall solve rates for easier problems, and lower
to respond appropriately to important changes in the problem description and makes use of extra
information available in it. This indicates that, for example, the system does not ignore most of the
model solves it at a much higher rate. (b) shows that the solve rate goes down dramatically when
given related but different problems, and is not very affected by different ways of describing the same
quality increases, indicating that better models are more capable of paying attention to subtle but
important description changes. Finally, (f) shows that the model relies on different sections of the
increase sample diversity. This includes tags (e.g. whether the problem is of type “binary search” or
“brute force”), ratings (how difficult the problem is), programming language, and whether or not the
% correct
10@1024
| Original | 13.5% | |||
|---|---|---|---|---|
|
||||
|
||||
| 11.3% | ||||
|
|
|||
| Figure A10 7 synonyms substituted | 12.5% | |||
| Table 12 | Summary of solve rates in response to description changes. Solve rate deteriorates consistently when removing or obscuring information in the description, demonstrating that the model relies on this information. All solve rates are for the 1B model; the model was not retrained for description changes. Some of the studies were done on the full validation set, while others were done on selected subsets. (a) and (b) use the percentage of correct samples on selected problems, and (c-h) use 10@1024 solve rates. | ||||
this conditioning metadata, and what are the best settings to generate this metadata with at test time when they are not available. We find that the model is indeed conditioned on this metadata; providing different tags changes what algorithms the model generates. We also find that we should sample randomly for tags and ratings, and condition on the solution being CORRECT. Here we present an analysis of tag conditioning, and additional results on ratings and correctness conditioning are included in Appendix E.4.
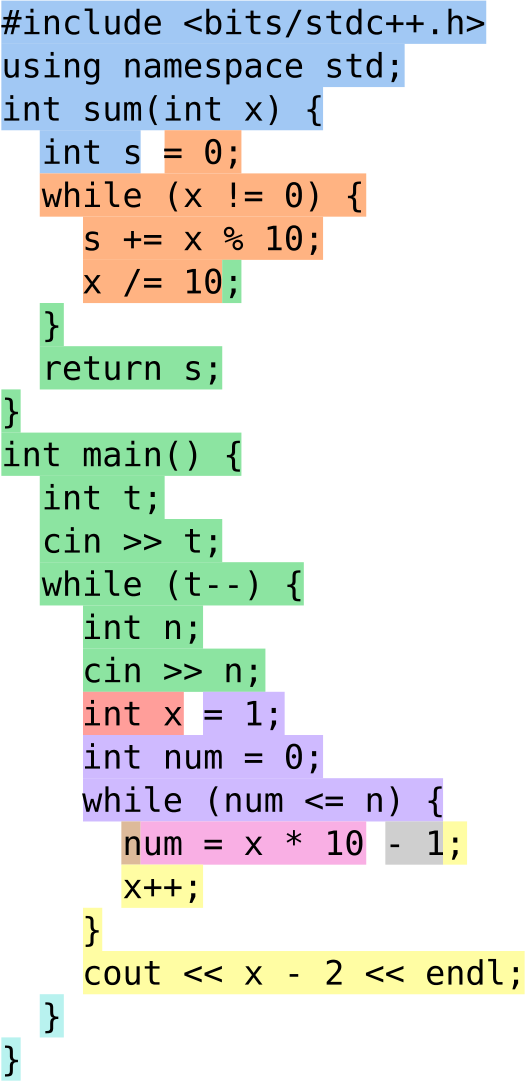
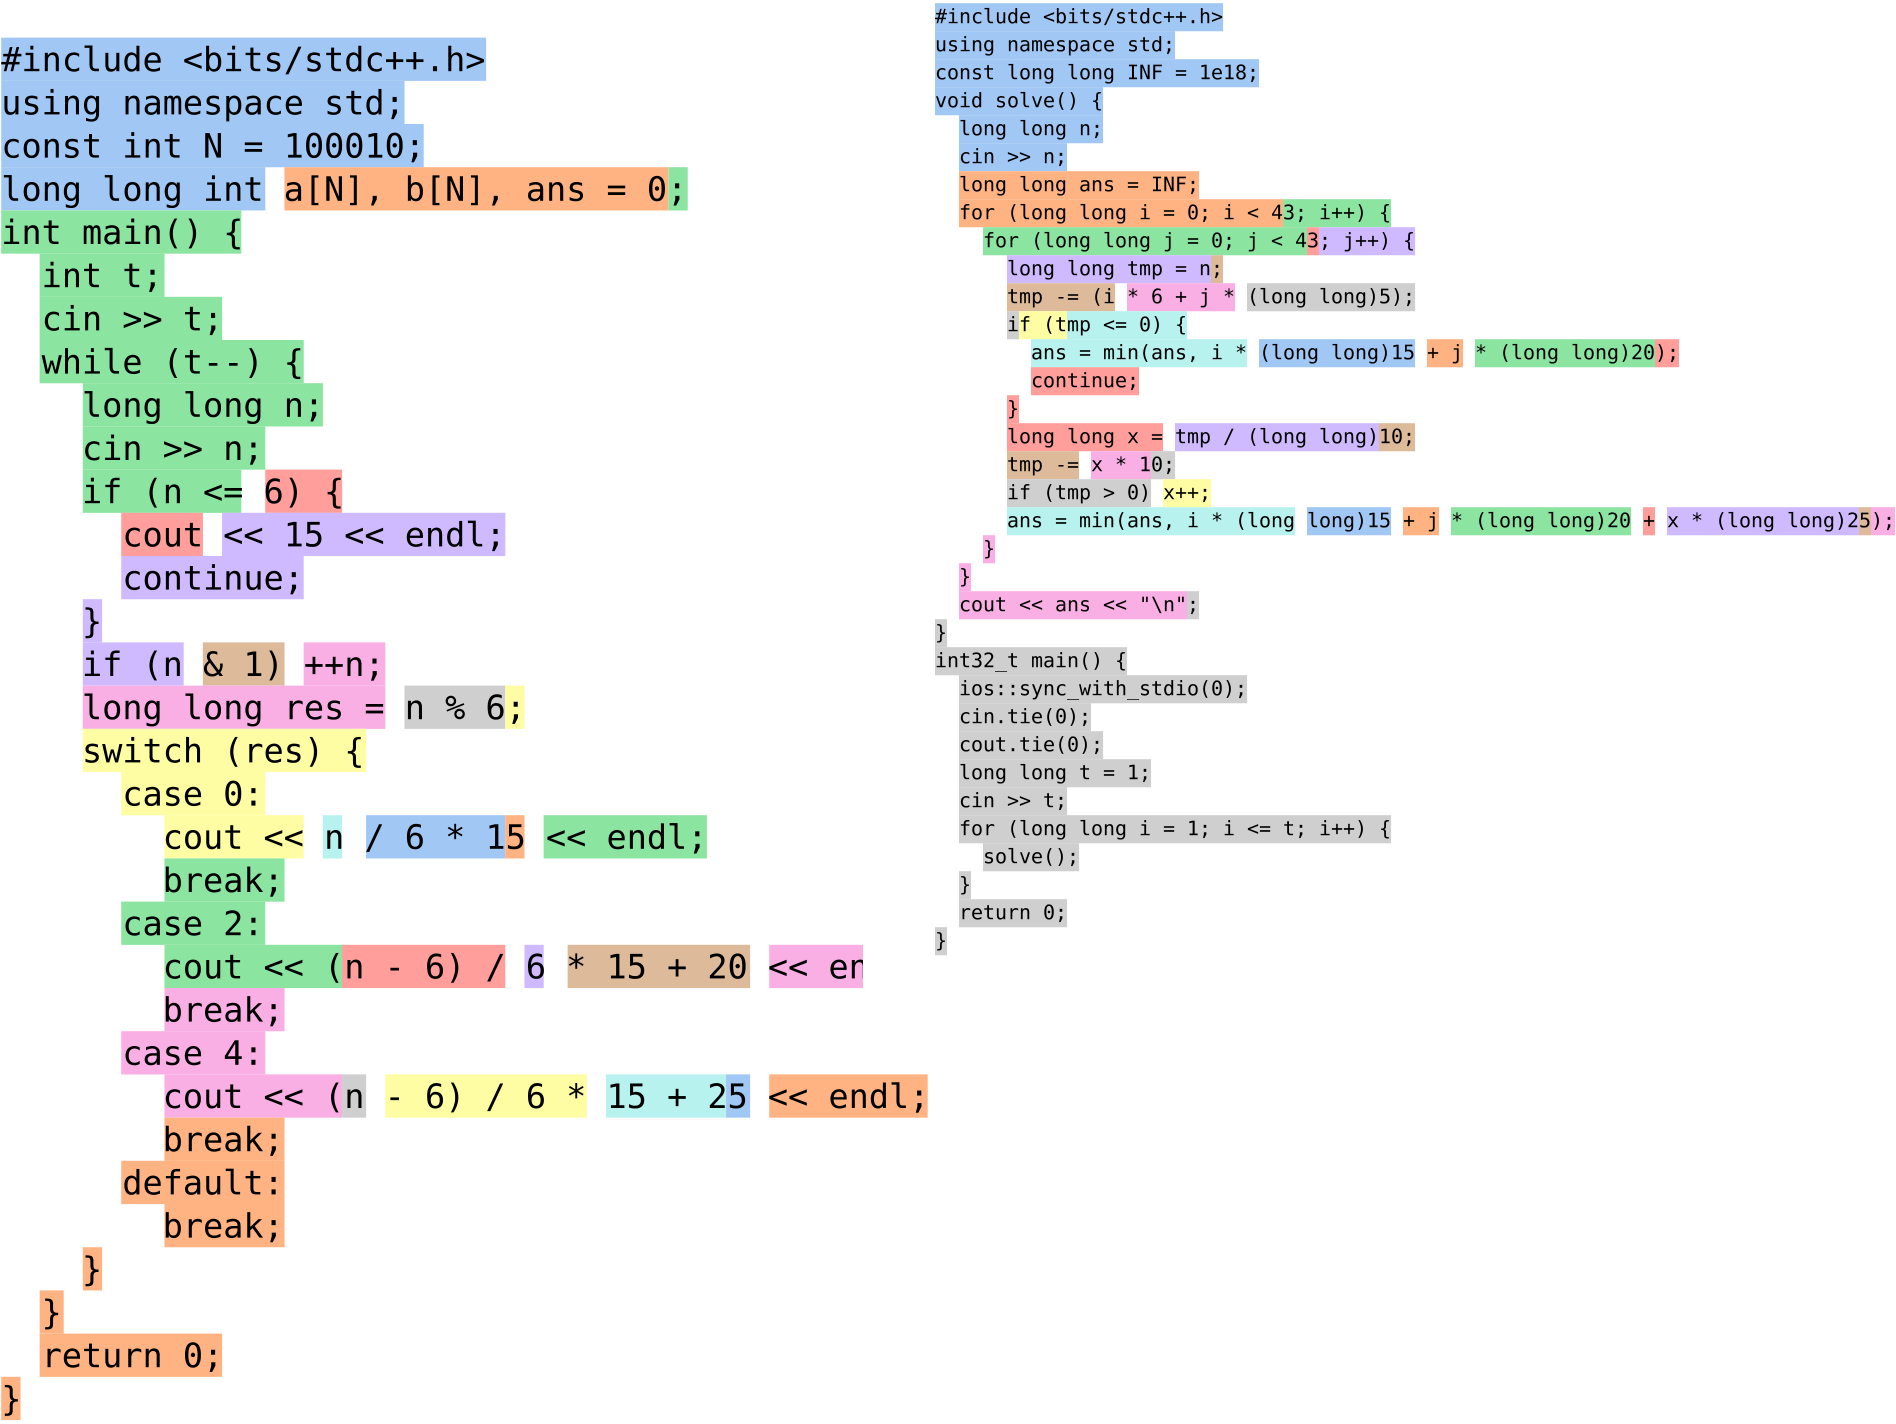
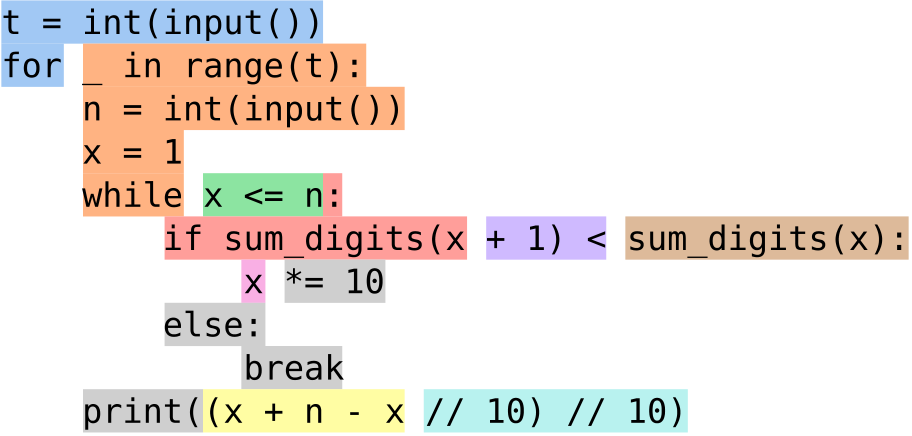
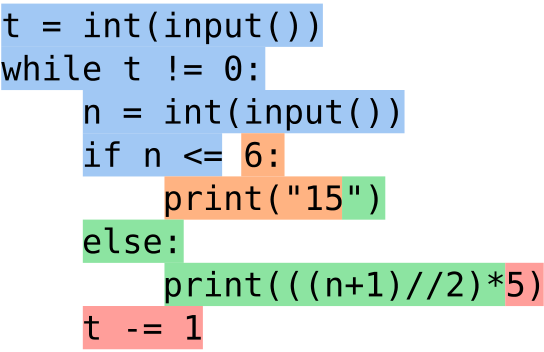
We examined the model’s tag conditioning behavior on an example problem in our validation set: Codeforces problem 1549A, Gregor and Cryptography (Figure A8). In this problem, we are given a prime number, 푃, and need to find two integers, 푎 and 푏, such that 푃 mod 푎 = 푃 mod 푏 and 2 ≤ 푎 < 푏 ≤ 푃. It’s tempting to solve this via brute-force, but there is a simple number theory solution: 푃 must be odd, so 푃 mod 2 and 푃 mod (푃 − 1) both equal 1.
t = int(input ())
for _ in range(t):
p = int(input ())
simply outputs the answer with no loop structure. This pattern continued in the following 2048 samples. The model solved the problem three times more often with the “number theory” tag (29 instead of 9 solutions), and output a perfect 푂(1) time complexity solution four times more often (12 instead of 3 solutions).
There are two possible ways that tag conditioning can improve the model solve rate: random tags may increases sample diversity or sampling correct tags may provides a useful hint. To distinguish between them, we compared solve rates when sampling a set of random tags for each sample (default), when providing the true problem tags, and when sampling a set of random tags for each problem (and reusing it for all samples for the same problem). The results are shown in Table 13. Providing the true tags for a problem is impossible at test time, but is better than providing a fixed set of random tags. However, the best results come from sampling with random tags per sample, showing that the extra diversity of samples is important to increasing the solve rate.
26
Validation loss
8% Solve rate (fit) 0.54
Solve rate
Validation loss 0.527% 0.50
Figure 13 | Validation loss and solve rate (10@1024) by finetuning steps. Validation loss starts to increase early in finetuning, indicating overfitting, while solve rate keeps improving.
7. Related work
27
Competition-Level Code Generation with AlphaCode
7.3. Scaling sampling
Similar to our sampling and filtering, though on a much smaller scale, Chen et al. (2021), Austin et al. (2021), and Cobbe et al. (2021) found that repeated sampling on the same problem significantly increases the probability of finding a correct solution. Cobbe et al. (2021) further introduced a way of selecting a small number of final submissions from multiple samples by majority voting. They also demonstrate verifiers (value functions) used to judge the correctness of model samples as a way of reranking samples.
whether code matches rather than whether a program is correct (syntactically different programs can be functionally identical), so as models have improved to be capable of fully solving programming problems, evaluation processes that execute programs and measure functional correctness (Chen et al., 2021; Hendrycks et al., 2021) have become more popular. However both Chen et al. (2021) and Hendrycks et al. (2021) are somewhat limited as benchmarks because we have found that it is common for incorrect programs to be marked correct due to limited test coverage (Table 2).
7.5. Competitive programming
Although there are few direct applications of this work outside of competitive programming, improving human readable code generation opens the door to many future applications with large real-world impact. All these applications require varying amounts of future work.
Automating code generation could make existing programmers more productive, with potential applications ranging from suggesting extended code completions to optimizing blocks of code. Further in the future, advanced code generation models could let developers operate at a higher level of abstraction that elides details, much in the same way that modern software engineers typically no longer write in assembly.
However, code generation tools could also be used by bad actors. Better tools may make it easier to create new versions of malware, thus helping them avoid detection by security software (which often rely on databases of file fingerprints). Tools that improve the productivity of developers would also improve the productivity of developers writing malicious code (Chen et al., 2021; Weidinger et al., 2021). Alternatively, competitive programming code generation models in particular could give users unfair advantages in programming competitions or technical interviews.
8.2. Potential risks and benefits
Bias can also lead to low quality code that perpetuates bugs or the use of outdated APIs,9resulting in performance and security issues. This could decrease uptake of new libraries or programming languages.
|
|---|
Competition-Level Code Generation with AlphaCode
However, one comparative advantage of code generation models is that once a program is synthesized it can generally be executed cheaply by any computer, unlike neural network models that typically need to be run on accelerators. Therefore code generation models can potentially be scaled to many applications more easily.
In this work, we present AlphaCode, a system applied to code generation for competitive programming that can generate novel solutions to unseen programming problems. Evaluated on Codeforces, AlphaCode performs roughly at the level of the median competitor. We find that massively scaling up sampling and then filtering and clustering samples to a small set, together with new sampling-efficient transformer architectures to support large scale sampling, are essential to achieving good performance. Our clean dataset and robust evaluation procedure also contributed significantly to guiding our research progress. We also show through detailed analysis that there is no evidence that AlphaCode copies important parts of previous solutions or exploits weaknesses in the problem structure. This indicates that our model indeed is able to solve problems it has never seen before, even though those problems require significant reasoning. Finally, we present the results of various model probings, and discuss broader impact and hazards of such code generation models.
Acknowledgements
Agustin Dal Lago worked on development of the dataset, evaluation, and general infrastructure. Cyprien de Masson d’Autume worked on model development and analysis.
Daniel J. Mankowitz worked on clustering.
James Keeling worked on code execution and evaluation, sampling infrastructure and scaling, clustering, and paper writing.
James Molloy worked on improving the efficiency of our models on accelerators.
Peter Choy worked on model development, sampling, and copying analysis.
Rémi Leblond worked on model development, optimisation, improved training losses, model analysis, sampling efficiency and scaling, and paper writing.
11Work conducted at DeepMind, now at OpenAI.
12Work conducted during a DeepMind internship, UC Berkeley affiliation.
The datasets used in the experiments have been made available for download on .
References
M. Balog, A. L. Gaunt, M. Brockschmidt, S. Nowozin, and D. Tarlow. DeepCoder: Learning to write programs. arXiv preprint arXiv:1611.01989, 2016.
S. Borgeaud, A. Mensch, J. Hoffmann, T. Cai, E. Rutherford, K. Millican, G. van den Driessche, J.-B. Lespiau, B. Damoc, A. Clark, D. de Las Casas, A. Guy, J. Menick, R. Ring, T. Hennigan, S. Huang, L. Maggiore, C. Jones, A. Cassirer, A. Brock, M. Paganini, G. Irving, O. Vinyals, S. Osindero, K. Si-monyan, J. W. Rae, E. Elsen, and L. Sifre. Improving language models by retrieving from trillions of tokens, 2021.
N. Carlini, F. Tramer, E. Wallace, M. Jagielski, A. Herbert-Voss, K. Lee, A. Roberts, T. Brown, D. Song, U. Erlingsson, et al. Extracting training data from large language models. In 30th USENIX Security Symposium (USENIX Security 21), pages 2633–2650, 2021.
M. Chen, J. Tworek, H. Jun, Q. Yuan, H. P. d. O. Pinto, J. Kaplan, H. Edwards, Y. Burda, N. Joseph, G. Brockman, et al. Evaluating large language models trained on code. arXiv preprint arXiv:2107.03374, 2021.
2020.
K. Cobbe, V. Kosaraju, M. Bavarian, J. Hilton, R. Nakano, C. Hesse, and J. Schulman. Training verifiers
learning under noisy I/O. In International conference on machine learning, pages 990–998. PMLR,
2017.
A. Ebtekar. How to interpret contest ratings. ,
2021. Accessed: 2021-12-04.
ook hacker cup.
, 2021. Accessed: 2021-12-
on Empirical Methods in Natural Language Processing: Findings, pages 1536–1547, 2020.
J. Ganitkevitch, B. Van Durme, and C. Callison-Burch. PPDB: The paraphrase database. In Proceedings
ode Jam. Google Code Jam.
, 2021. Accessed: 2021-12-09.
34
Competition-Level Code Generation with AlphaCode
A. Holtzman, J. Buys, L. Du, M. Forbes, and Y. Choi. The curious case of neural text degeneration. In Proceedings of the 7푡ℎInternational Conference on Learning Representations (ICLR), 2019.
U. Hölzle.
IOI. International olympiad in informatics. , 2021. Accessed: 2021-12-04.
N. P. Jouppi, D. H. Yoon, M. Ashcraft, M. Gottscho, T. B. Jablin, G. Kurian, J. Laudon, S. Li, P. Ma, X. Ma, et al. Ten lessons from three generations shaped Google’s TPUv4i. In 2021 ACM/IEEE 48th Annual International Symposium on Computer Architecture (ISCA), pages 1–14. IEEE, 2021.
I. Loshchilov and F. Hutter. Decoupled weight decay regularization. arXiv preprint arXiv:1711.05101, 2017.
Z. Manna and R. J. Waldinger. Toward automatic program synthesis.mar 1971. ISSN 0001-0782. doi: 10.1145/362566.362568. URL .
V. Murali, L. Qi, S. Chaudhuri, and C. Jermaine. Neural sketch learning for conditional program generation. arXiv preprint arXiv:1703.05698, 2017.
Y. Nandwani, D. Jindal, Mausam, and P. Singla. Neural learning of one-of-many solutions for combi-natorial problems in structured output spaces. In International Conference on Learning Representations, 2021.
A. Radford, J. Wu, R. Child, D. Luan, D. Amodei, I. Sutskever, et al. Language models are unsupervised multitask learners. OpenAI blog, 1(8):9, 2019.
J. W. Rae, S. Borgeaud, T. Cai, K. Millican, J. Hoffmann, F. Song, J. Aslanides, S. Henderson, R. Ring, S. Young, et al. Scaling language models: Methods, analysis & insights from training Gopher. arXiv preprint arXiv:2112.11446, 2021.
|
One write-head is all you need. |
|---|
36
Competition-Level Code Generation with AlphaCode
O. Vinyals, I. Babuschkin, W. M. Czarnecki, M. Mathieu, A. Dudzik, J. Chung, D. H. Choi, R. Powell, T. Ewalds, P. Georgiev, et al. Grandmaster level in StarCraft II using multi-agent reinforcement learning. Nature, 575(7782):350–354, 2019.
L. Weidinger, J. Mellor, M. Rauh, C. Griffin, J. Uesato, P. Huang, M. Cheng, M. Glaese, B. Balle, A. Kasirzadeh, Z. Kenton, S. Brown, W. Hawkins, T. Stepleton, C. Biles, A. Birhane, J. Haas, L. Rimell, L. A. Hendricks, W. S. Isaac, S. Legassick, G. Irving, and m language models. CoRR, abs/2112.04359, 2021. URL .
10. Appendix
|
|
||
|---|---|---|---|
|
|
||
|
|||
| E |
|
||
| F | |||
A.1. Hidden tests
Competitive programming problems typically contains example tests in the problem statement, and also hidden tests not visible to the competitors that are used for evaluation. Figure A1 contains a hidden test case for the example problem in Figure 2.
Competition-Level Code Generation with AlphaCode Input Output
10
paxghjnihn
hn
hdmevxvn
n
azdfhfxem
xem
eowhldode
dode
wlclsnht
ct
bpflheocamv
v
flejfh
hixqqbnikthccagc
dugt
eebmbpykcsmi
oivgrzwppny
zhfyiuu
ebkqjcbcwviqkojnzyruwygtbvwws bofzr
Because these constraints are difficult to extract from the problem, our judging code takes a permissive view of formatting. Floating point numbers are considered equivalent if their difference is less than 10−5, string comparison is case insensitive, and whitespace differences are ignored. This does not exactly match formats given by problems, but we found these issues are not too significant. When verifying dataset false positive rates, we did not find any problems that were incorrectly marked correct because of this issue.
We determined which problems have multiple correct outputs heuristically using human solutions; if any test case had at least 5 distinct outputs from human-written correct solutions, or 2 outputs produced by multiple human solutions, we assumed it had multiple outputs. About 1/4 of our validation set problems are multiple output problems by this criteria. These problems are judged using the same permissive formatting and against a single correct output, where the correct output is chosen to be what the majority of human solutions output. Because we assume a single correct output, our judging can underestimate the actual model performance. An alternative is to accept any output that a human solution outputs, which decreases the false negative rate in judging, but we found that this leads to significantly increased false positives.
A.3. Evaluation metrics
As described in Section 2.2, we use the 푛@푘 solve rate to evaluate model performance, which measures the fraction of problems a model can solve when allowed to generate 푘 samples but only submit 푛 of them for evaluation.
To compute 푛@푘 from a single model we:
• draw a set of 퐾 ≥ 푘 samples.• draw 푆 sub-samples of size 푘 from the full set of 퐾 samples without replacement.• calculate solve rates with 푛 submissions for each sub-sample.
• report the average solve rate across all of these sub-samples.
We perform this re-sampling and estimation process many times, and report the 95% confidence interval as the 2.5%-ile and 97.5%-ile from the resulting set of estimates.
B. Datasets
40
Competition-Level Code Generation with AlphaCode
3. Cleaned C++submissions to compile with our compiler and sandboxes, for example by adding int in front of main() where it was missing. We further formatted C++code using clang-format, replaced all the includes with #include <bits/stdc++.h>, and expanded all other prepro-cessor directives and typedefs,13which also made the code shorter. Note that this cleaning step did not work for a portion of our dataset; when the cleaning failed we simply keep the solution as is.
4. Executed all Python and C++solutions on all the test cases, and removed in order:
13#defines and typedefs are widely used by competitive programmers to introduce idiosyncratic abbreviations for common constructs, e.g. #define rep(i,n) for(int i=0;i<n;i++) or typedef vector<pair<ll,ll» vpll;.
41
| Files (Millions) | Bytes (GB) | ||
|---|---|---|---|
| Language | |||
|
|
||
| Total | 86.31 | 715.1 | |
| Appendix Table A1 | Composition of our GitHub pre-training dataset. Python 2 and 3 are distin-guished by whether the code can be successfully parsed using Python 3’s parser. | |||
C.1. Ensembling
Ensembling is another approach we tried to more effectively search in the program space. To ensemble a set of models, we pool their samples together before running filtering and clustering. Since different models can have different strengths and weaknesses, ensembling them can increase the diversity of the samples. However, it is also possible to hurt the performance of good models by ensembling them with significantly worse ones, because this wastes the sample budget. Finding the right composition for the ensembling therefore is important for performance improvement.
0.05
0.05
Sample budget
(b) Strong components better than ensemble
|
|||||||
|---|---|---|---|---|---|---|---|
|
|||||||
|
|
||||||
| 17.2% 19.5% |
|
|
15.8% 15.6% | ||||
C.2. Metadata conditioning
When conditioning on metadata, the chosen metadata values are added as a prefix to the natural language prompt, as shown in Figure 5 and Figure F.
C.3. Additional results for filtering and clustering
|
||
|---|---|---|
|
||
44
Competition-Level Code Generation with AlphaCode
| 푘 = 1 | pass@푘 푘 = 10 | |||
|---|---|---|---|---|
| 0.75% 4.79% 6.41% 11.62% |
1.88% 7.47% 11.27% 15.74% |
2.97% 16.30% 21.37% 27.74% |
||
| TabNine | 2.58% | |||
|
2.00% 3.21% 5.06% 8.22% 13.17% 16.22% |
3.62% 7.10% 8.80% 12.81% 20.37% 25.70% |
8.58% 12.89% 15.55% 22.40% 36.27% 40.95% |
|
|
||||
C.4. HumanEval comparison
To ensure that our baseline decoder-only models are as comparable as possible with Codex, we evaluated our models on the HumanEval benchmark from Chen et al. (2021). From Table A3 we can see that our pretrained decoder-only baseline models obtain HumanEval solve rates which are within about 1-3% of the comparable Codex model for most settings, and significantly better than GPT-Neo and GPT-J at all comparable settings. The HumanEval results for all of our encoder-decoder models (including the final AlphaCode model) are significantly worse than the decoder-only models, so we do not report them here. We believe this performance difference stems from the fact that encoder-decoder models are well aligned with the competition programming setting where we have a dataset with clear inputs (programming contest problem descriptions) and outputs (solution code), as well as example tests for effective filtering. Therefore the encoder-decoder models can both learn effectively and sample efficiently. However, encoder-decoders are not well aligned with the HumanEval setting where the only training data is GitHub code which cannot easily be split into meaningful inputs and outputs. As a result, the fact that decoder-only models compute loss on all tokens (rather than only one-third of tokens) enables them to learn more efficiently in the HumanEval setting.
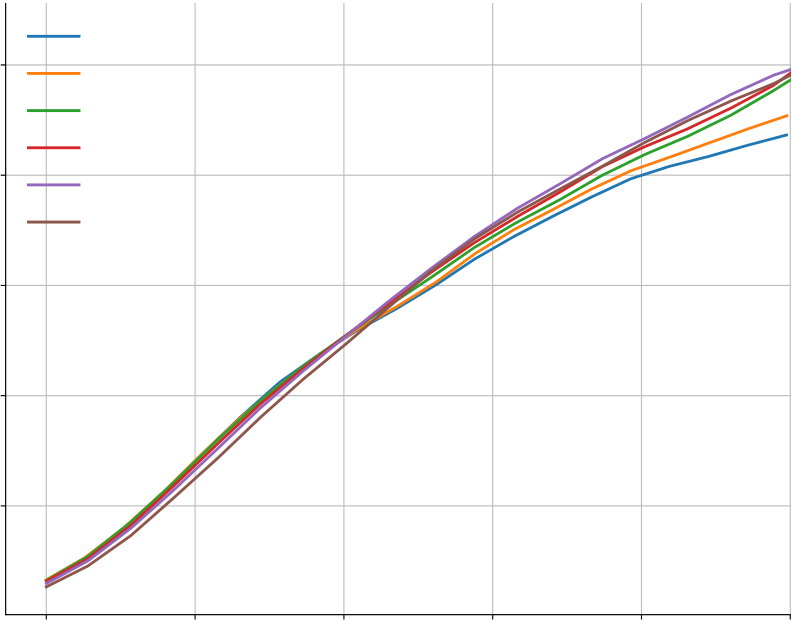
As we generate a large amount (≥ 1M) of samples for each problem, the exact settings to use for sampling can potentially have a large impact on the model performance.
In Figure A5(a-b), we show that sampling temperature does have an impact on the solve rate, but the temperature of 푇 = 0.25 works well across a wide range of sample budgets. Figure A5(c-e) shows the results for top-k sampling and nucleus sampling. Both of them turn out to be not better than the simple sampling with temperature.
46
| 0.25 | 0.40 | ||
|---|---|---|---|
| 0.35 | |||
| 0.20 | |||
| 0.30 | |||
0.10 |
| 0.225 | 101 | Sample budget
|
105 | 0.25 | 101 | 105 | |
|---|---|---|---|---|---|---|---|
|
|||||||
| 0.200 | |||||||
| 0.175 |
|
||||||
| 0.075 | |||||||
| 0.050 | 0.05 |
47
| 0.20 | 0.20 | ||||||
|---|---|---|---|---|---|---|---|
0.15 0.10 |
|||||||
| 0.00 |
Sample budget |
105 |
|
105 | |||
| 101 | |||||||
Appendix Figure A6 | Dataset scaling. Increasing either the number of problems (a) or solutions (b) in the finetuning dataset improves solve rate of an early 1B parameter model, although increasing the |
|||||||
|
|||||||
|
|||||||
| Appendix Table A4 | Codeforces submission points. Each row specifies the conditions for when submissions happen, and the number of submissions at that point. | |||||||
For each contest, we simulated running live with 3750 TPUv4 and 3750 TPUv4i (Jouppi et al., 2021) chips for the duration of the contest. These devices continuously draw samples, using a pool of workers to evaluate samples against example tests. Because clustering runs best when there are enough samples that pass example tests, we cannot continuously submit submissions. Instead, for each problem in the contest we clustered and submitted up to a total of 10 samples at three points (Table A4), where the point was either based on the fraction of the time remaining in the competition or based on the relative number of samples that pass example tests available compared to the default number. When computing these points, all contests were assumed to be two hours for simplicity even though some were slightly longer. Clustering and a specified number of submissions were done when either of these conditions were reached. The time of correct submission was then the time in the contest that corresponds to when the condition for each row was reached, plus 120 seconds for clustering. Because submissions were submitted in order, we also know the number of incorrect submissions. Additionally, we did not submit solutions to Codeforces that were obviously incorrect (by quick manual inspection) and instead automatically counted them as incorrect, though note that this can only decrease model performance.
48
D.3. Results
After submissions we computed our score on each contest (including penalties) using the contests’scoring system, and found where the model would have placed on the contests’ official scoreboards. Per-problem contest results can be found in Table A5. Overall contest results can be found in Table A6. In the second and third evaluations, we submitted more than 10 submissions per problem. We found that there were some problems we only solved with many samples.
Table A7 shows the percentage of syntactically correct samples from the models. That is, samples that compile for C++, and samples that do not generate a SyntaxError for Python.
E.2. Solve rate for different problem difficulty ratings
|
|
|||||
|---|---|---|---|---|---|---|
ratings, and the performance quickly degrades when the problem difficulty increases. High solve rates at high difficulty buckets are caused by our slow positive rate being quite high (46% as reported in Section 3.2.1), and by the buckets being quite small.
E.3. Sensitivity to the problem descriptions
51
Competition-Level Code Generation with AlphaCode
| #Probs. 9B 41B |
29 60.5% 62.4% |
|
|
|||||
| #Probs. 9B 41B |
37 64.7% 69.5% |
|
|
|||||
| Appendix Table A8 | 10@100k Solve rates of our models in different difficulty buckets. Also shown is the number of problems in each difficulty bucket. | ||||||||
key observation to solve this problem is to note that the optimal solution is achieved when every element is bitwise ANDed with every other element. We can therefore simplify this problem by changing the description part of the problem statement to a single sentence:
Given a sequence of integers, compute the bitwise AND of all of its elements.
52
Competition-Level Code Generation with AlphaCode
|
|
| Appendix Figure A7 | Example problem statement. Problem statement of , a Codeforces problem (Mirzayanov, 2020). This is an easy problem, with a ratin | |
53
Competition-Level Code Generation with AlphaCode
| 300M | 1B | ||
|---|---|---|---|
| 8.23% 8.27% | 13.54% 13.30% |
|
|
Appendix Table A11 | Solve rate sensitivity to type information. 10@1024 solve rates with different model sizes, with and without type information. |
|||
Competition-Level Code Generation with AlphaCode
| Appendix Figure A8 | Consistent / inconsistent variable renaming example. This example shows the original description that has variable names 푃, 푦, and 푡, along with versions with consistent and inconsistent replacement. The original description’s variables are the blue variables in each triplet [A][B][C], and similarly the consistent and inconsistent replacements are green (퐴 replaced with 퐵 everywhere) and red (퐴 replaced with a random name 퐶 independently for each appearance) respectively. Consistent replacement does not change the problem, but random replacement introduces noise and renders the problem ill-posed. Model deterioration with such modificatinalysis of how well a model captures the given variable structure. Problem sourced from . |
|---|
E.4. Sensitivity to problem metadata
E.4.1. Problem ratings
0.12
0.10
0.16 300M, Consistent
300M, Inconsistent 10@1024 Solve rate
0.14 1B, Consistent
E.4.2. Solution correctness
Value conditioning conditions the model with either a CORRECT SOLUTION or an INCORRECT SOLUTION tag at training time depending on the solution, and always with a CORRECT SOLUTION tag during sampling. Table 8 shows that it results in a performance improvement. Here, we investigate whether our models are strongly conditioned on this tag by supplying the INCORRECT SOLUTION tag or even no tag at all, instead of the CORRECT SOLUTION. The comparison is illustrated in Figure A13. Conditioning on the INCORRECT SOLUTION tag hurts in the 10@푘 metric, although not the 푝푎푠푠@푘 metric, indicating that the model may produce more solutions that pass example tests but not hidden tests. Removing conditioning hurts in both metrics, although not significantly.
Appendix Figure A10 | Solve rates under different word-level change regimes.
| 300M | 1B | ||
|---|---|---|---|
| Prompt |
|
||
| Description + Specification + IO | 8.33% | 13.75% | |
|
|||
|
|||
|
|||
57
0.06
0.04
1B
Appendix Figure A11 | 10@1024 solve rates for samples conditioned on different ratings. Dotted lines shows solve rates when conditioning on a uniform random rating.
300M 1B 3B
0.15
0.10
2500 to 3400 0.25
0.35 0.35
Conditioning rating Conditioning rating Conditioning rating
Appendix Figure A12 | 10@1024 solve rates by problem difficulty for samples conditioned on different ratings. Dotted lines shows solve rates when conditioning on a uniformly random rating.
0.20 0.30
Pass@k solve rate 0.25 10@k solve rate
0.15
58
Competition-Level Code Generation with AlphaCode
F. Complete prompt and model examples
All problems and human solutions in this section are sourced from .
59
Competition-Level Code Generation with AlphaCode
import sys
input = sys.stdin.readlineif SUM %(n*(n+1) //2) !=0: print("NO")
continueSUM //=(n*(n+1) //2)
| Appendix Figure A15 | Complete modenguage are sampled randomly per problem at test time. See for more examples. |
|---|
Human solution Model solution
Competition-Level Code Generation with AlphaCode
Human solution Model solution
Human solution Model solution

64
Competition-Level Code Generation with AlphaCode
Appendix Figure A21 | A human validation solution to the ’Integers Have Friends’ problem with a very long LCS with the finetuning dataset (length 666). The remaining part of the solution is |
|---|
Input
The first line contains a single integer t (1 <= t <=
a_1 , a_2 , ..., a_n (1 <= a_i <= 10^6).
|
||
|---|---|---|
| If the xor is zero , output "2", else | output | |
t <= 10 000) - the number of test cases.
The first line of each test case contains a single
If the xor of all the a_i is zero , print "2",
otherwise print "1"
2
2
1No Consecutive Zeros – Original
|
integer n, find | the (n+2) th | fibonacci | number |
|---|
Consider all possible binary strings of length n.
The first line contains a single integer t (1 <= t <=
10 000) - the number of test cases.
Input
The first line contains a single integer t (1 <= t <=
Competition-Level Code Generation with AlphaCode
1554A Cherry – Original
Input
The first line contains a single integer t (1 <= t <=
a_1 , a_2 , ..., a_n (1 <= a_i <= 10^6).
It is guaranteed that the sum of n over all test
|
|---|
integer n (2 <= n <= 10^5).
The second line of each test case contains n integers
|
273225 | 402638 | 473783 | 804745 |
|
273225 | 402638 | 473783 | 804745 | ||
|---|---|---|---|---|---|---|---|---|---|---|---|
| Output | |||||||||||
|
|||||||||||
Note
* f(2, 3) = max(a_2 , a_3) . min(a_2 , a_3) = max(4,
3) . min(4, 3) = 4 . 3 = 12.
68
|
|
|---|---|
|
|
|
|
Each test contains multiple test cases.
The first line contains a single integer t (1 <= t <=
sequence.
The second line of each test case contains n integers
| one | integer | - the |
|
|---|
0
1
3
3Note
|
|
1569A Balanced Substring – Original
1569A Balanced Substring – Simplified
A string is called balanced if the number of letters
’a’ in it is equal to the number of letters ’b’. For
there is no such substring , then print -1 -1.
Input
integer n (1 <= n <= 50) - the length of the string.
The second line of the testcase contains a string s,
-1, -1.
Input
integer n (1 <= n <= 50) - the length of the string.
The second line of the testcase contains a string s,
adjacent pair of non -identical letters at indexes l
and r, print l, r. Otherwise , print -1 -1.
| exists print l | ||||||||||
|---|---|---|---|---|---|---|---|---|---|---|
|
||||||||||
|
||||||||||
|
||||||||||
| In the pairs. | first | testcase | there | |||||||
|
third | testcases | there | |||||||
Competition-Level Code Generation with AlphaCode F.2.2. Incorrect and verbose rewordings
Original Opposite
|
|---|
|
|||||||||||||||||||||||||||||||
|---|---|---|---|---|---|---|---|---|---|---|---|---|---|---|---|---|---|---|---|---|---|---|---|---|---|---|---|---|---|---|---|
| line -- the |
|
<= t <= |
|
line -- the |
|||||||||||||||||||||||||||
|
case | case | |||||||||||||||||||||||||||||
a_1 , a_2 , ..., a_n (1 |
test <= a_i |
test <= a_i |
|
||||||||||||||||||||||||||||
| It is cases | all | It is cases |
|
all |
|
||||||||||||||||||||||||||
|
|
||||||||||||||||||||||||||||||
|
|
||||||||||||||||||||||||||||||
| 273225 | 402638 | 473783 | 804745 | 273225 | 402638 | 473783 | 804745 | ||||||||||||||||||||||||
|
|
||||||||||||||||||||||||||||||
| In the | first | first | |||||||||||||||||||||||||||||
|
|
||||||||||||||||||||||||||||||
| So the | maximum |
|
minimum |
|
|||||||||||||||||||||||||||
| maximum | is f(1) = f(2) = |
|
|
minimum | |||||||||||||||||||||||||||
integer n (2 <= n <= 10^5).
The second line of each test case contains n integers
|
|---|
Input
The second line of each test case contains n integers
a_1 , a_2 , ..., a_n (1 <= a_i <= 10^6).
maximum |
test case , print a single |
|---|
| In the | first |
|---|
|
|---|
Input
The second line of each test case contains n integers
a_1 , a_2 , ..., a_n (1 <= a_i <= 10^6).
The first line of each test case contains a single
integer n (2 <= n <= 10^5).
Output
|
|---|