
Gem strategy november theme investing lower return

| STRATEGY |
|---|
Global
Highlights of this Issue
| • | ||
|---|---|---|
| • | ||
|
||
|
• | |
| • | ||
| • |
|
|
|
• | |
| • |
John Morris>>
S.A. Strategist, Merrill Lynch (South
Africa)
(27) 11 305 5151
|
|---|
>>Employed by a non-US affiliate of MLPF&S and is not registered/qualified as a research analyst under NYSE/NASD rules.
Merrill Lynch does and seeks to do business with companies covered in its research reports. As a result, investors should be aware that the firm may have a conflict of interest that could affect the objectivity of this report.

| Table 1: Total Return (%) YTD as of |
1. |
|
|||
| 2004 | 4-Nov-05 | ||||
| MSCI (US$) | |||||
| World | 15.2 | 5.3 |
|
||
| EMF | 26.0 | 21.1 | |||
| Russia | 5.7 | 59.3 | |||
| Brazil | 36.5 | 49.0 | |||
| South Korea | 22.9 | 35.7 | |||
| Mexico | 48.3 | 33.6 | |||
| Turkey | 42.0 | 32.6 | |||
| India | 19.1 | 29.0 | |||
| Chile | 29.0 | 19.4 | |||
| Israel | 20.3 | 16.7 | |||
| Poland | 61.5 | 16.0 | |||
| Thailand | -0.9 | 4.6 | |||
| Taiwan | 9.8 | -5.4 | |||
| Sectors (US dollar terms) | |||||
| Energy | 25.4 | 51.5 | |||
| Utilities | 21.5 | 27.2 | |||
| Staples | 28.2 | 26.5 | |||
| Health Care | 7.7 | 21.3 | |||
| Telecom | 34.6 | 17.9 | |||
| Financials | 39.5 | 16.9 | |||
| Cons. Disc | 28.3 | 15.7 | |||
| Inf. Technology | 10.0 | 13.8 | |||
| Industrials | 33.3 | 12.2 | |||
| Bond Indices (US dollar terms) | |||||
| EM Debt | 11.8 | 7.7 |
|
||
| EM Corp. Debt | 13.7 | 5.6 | |||
| US High Yield | 10.8 | 1.5 | |||
| UST 10 Year | 4.8 | -0.5 | |||
| Commodities | |||||
| Oil (WTI) | 33.6 | 39.4 |
|
||
| CRB Index | 11.2 | 12.3 | |||
| Gold | 5.2 | 5.3 | |||
| Foreign Exchange* | |||||
| USD (trd-wgt) | -7 | 12.9 | |||
| Brazilian Real | 8.9 | 20.1 | |||
| Korean Won | 1.5 | 15.6 | |||
| Mexican Peso | 0.7 | 3.7 | |||
| Chilean Peso | 6.7 | 2.9 | |||
| Thai Baht | 1.7 | 1.7 | |||
| Turkish Lira | 4.7 | -0.4 | |||
| Russian Ruble | 5.5 | -3.0 | |||
| Indian Rupee | 5 | -4.6 | |||
| Taiwan Dollar | 7 | -5.7 | |||
| Israeli Shekel | 1.6 | -7.3 | |||
| Czech Koruna | 14.7 | -9.4 | |||
| Polish Zloty | 24 | -11.2 | |||
| Hungary Forint | 15.3 | -14.3 | |||
| SA Rand | 18 | -15.4 | |||
Source: Bloomberg. * (-) depreciation, (+) appreciation
vs. the US dollar. Total Return assumes dividends were
reinvested where applicable.
| Sector |
|
Stance |
|
||
|---|---|---|---|---|---|
| Materials | Overweight | ||||
| Staples |
|
Overweight |
|
||
| Technology | Overweight | ||||
| Energy |
|
Neutral |
|
||
| Utilities | Neutral | ||||
| Telecom |
|
Neutral |
|
||
| Financials | Neutral | ||||
| Consumer Disc. | Underweight |
|
|
||
| Health Care | Underweight | ||||
| Industrials | Underweight |
|
|
||
| Refer to important disclosures on page 35. | 3 | ||||
� The Late Cycle Show
Inflation Rises
| We are currently “late-cycle”, a | Growth Recovers |
|
Stocks | ||
|---|---|---|---|---|---|
| Bonds | Cash |
|
|||
| shines |
Inflation Falls

GEM Strategy – 8 November 2005
| • | A slump in growth and trade: A sharp slowdown in global growth would hit |
|---|
|
|
|
|---|---|---|
| Energy + Materials | ||
Table 4: GEM Bull & Bear Markets and Drivers
|
Bull 1988-94 | Bull 2003- | ||
|---|---|---|---|---|
| GEM CAC Balance | Surplus | Deficit | Surplus | |
| Relative Valuation | Overvalued | Undervalued | ||
| currently visible | US Real Short Rates | Falling/Low | Rising | Falling/Low |
| Equity Volatility | Decreasing | Increasing | Decreasing | |
| EM Debt Spreads | Falling | Rising | Falling | |
| US$ (trade-weighted) | Falling | Rising | Falling |
Refer to important disclosures on page 35. 6

1.Capital inflows are abating. This is the message from the recent weak Indian rupee (worst performer within EM Asia this past month). Note that capital inflows have been a key driver of the +20% year-to-date total return from India (local currency terms).
2.An inflection point in inflation is imminent. Indian Economist Rajeev Varma predicts a rise in wholesale price inflation from 3% to 6% in the next 6 months. Indian short-rates will rise by at least 75bps over this period. Our mid-year bullishness on India was predicated on lower inflation keeping rates low and liquidity high. As inflation trends higher instead of lower in coming months, the liquidity story reverses.

Chart 8: Chronology of the 2002 Brazil Crisis
| 27 | Selic Interest Rate (%) |
|
Easing | 8000 |
|---|
22 5000
21
| 20 | Tightening | 36% | 4000 | |
|---|---|---|---|---|
| 19 | begins |
GEM Strategy – 8 November 2005
�Theme Investing in 2006
1.GEM Consumer Theme
2.Urbanization Theme
| Themes |
|
|
|---|---|---|
| The GEM Consumer | Consumption % GDP in EM = 56%. In the USA = 70%.GEM consumption |
| Urbanization in Emerging | ||
|---|---|---|
| The UN forecasts that the urban population in the developing world will grow | ||
|
at close to one million persons per week in the next 25 years. Cities such as |
|
|
|
|---|
GEM Strategy – 8 November 2005

| View | • |
|
|
|
↑ | ||
| • | |||
| ↑ | |||
| ↓ | • | G7 interest rates remain low in nominal and real terms. A spike in U.S. | |
| ↓ | |||
|
|||
|
↑ | ||
| • | |||
|
|---|
GEM underperforms only once Fed has done enough to halt
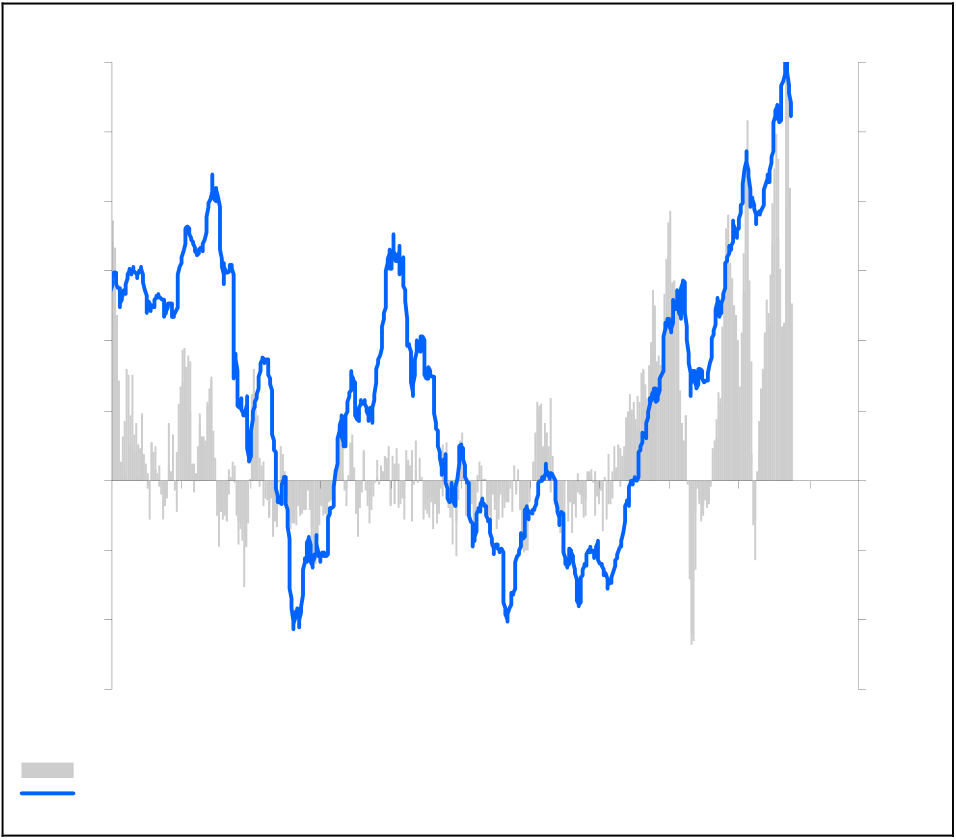
Chart 10: EMF & U.S. 10-Year Bond Yield
Chart 11: Global Liquidity*
We forecast ample growth (+10%) in our global liquidity
measure.
Refer to important disclosures on page 35. 10

3
|
|---|
GEM Strategy – 8 November 2005
| Table 6: GEM Investment Drivers | • | ||
|---|---|---|---|
| Driver | |||
| Liquidity |
|
• |
|
| Growth | • | ||
| Sentiment | |||
| Valuation |
|
||
| Risk Appetite |
|
• | |
| ↑ = Positive, ↓ = Negative, ⎯ = Neutral |
Fund managers on balance want to remain overweight GEM…
Chart 19: Weekly Emerging Market Equity Inflows, US$ bn
Net % Saying Increasing Position in GEM Equities
|
|---|
Chart 20: Cash Levels in GEM Equity Portfolios
5.0
3.5
| 12 | ||||||||||||||||||
|---|---|---|---|---|---|---|---|---|---|---|---|---|---|---|---|---|---|---|
|
|
|||||||||||||||||
|
||||||||||||||||||
|
||||||||||||||||||
| 96 | 97 | 98 | 99 | 00 | 01 | 02 | 03 | 04 | 05 | |||||||||
| 00 | 01 | 02 | 03 | 04 | 05 | |||||||||||||
|
|
|||||||||||||||||
| Source: AMG, Merrill Lynch. Weekly reporters only, five-week moving average. | ||||||||||||||||||

GEM Strategy – 8 November 2005
| Valuation: A Modest Negative | |||||
|---|---|---|---|---|---|
| • | |||||
|
|
• | |||
| • | |||||
|
|
||||
| • | |||||
|
• | ||||
| And GEM earnings yield in line with EM corporate bond yield (7-8%). | |||||
| ↑ = Positive, ↓ = Negative, ⎯ = Neutral | |||||
|
Chart 22: EMF Forward PE Relative to World | ||||
|
|||||

Risk Appetite: Positive
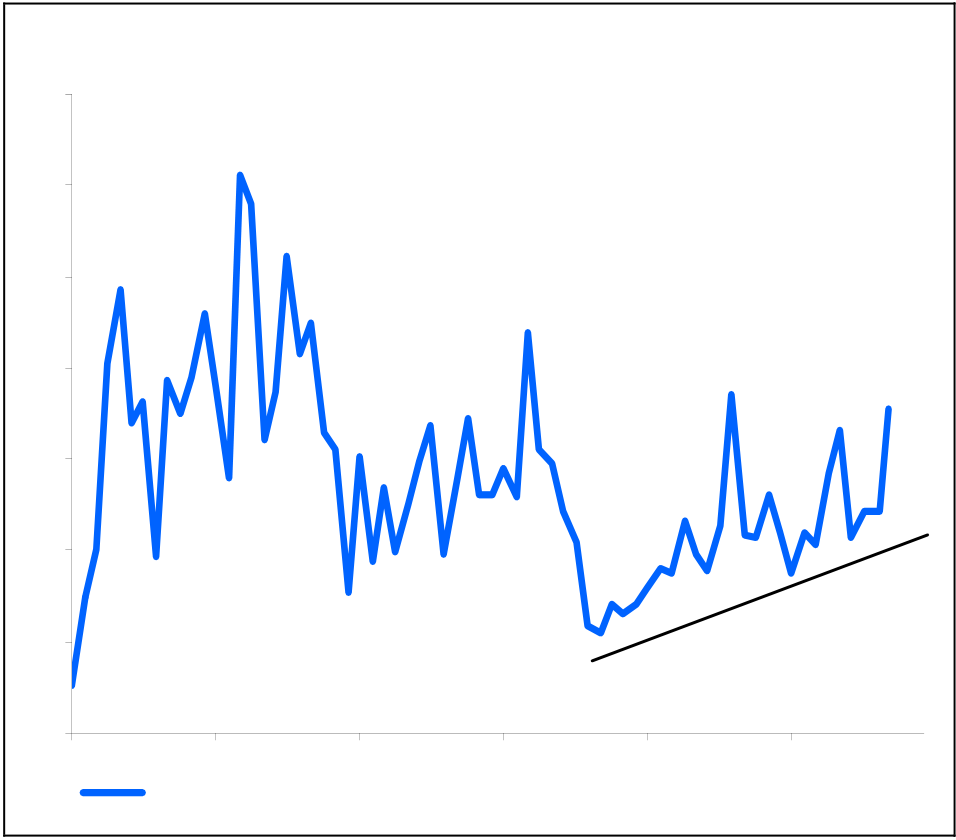
Chart 25: EMF Relative & VIX Index

| Table 9: GEM Investment Drivers | • | |||
|---|---|---|---|---|
| Driver | View | |||
| Liquidity | ↑ | • | ||
| Growth | ↑ | • |
|
|
| Sentiment | ↓ | |||
| Valuation | ↓ | • |
|
|
| Risk Appetite | ↑ | • | ||
| ↑ = Positive, ↓ = Negative, ⎯ = Neutral | ||||
| Chart 30: U.S. High Yield Spreads | ||||

5. Country Views Underweight/Overweight

GEM Strategy – 8 November 2005
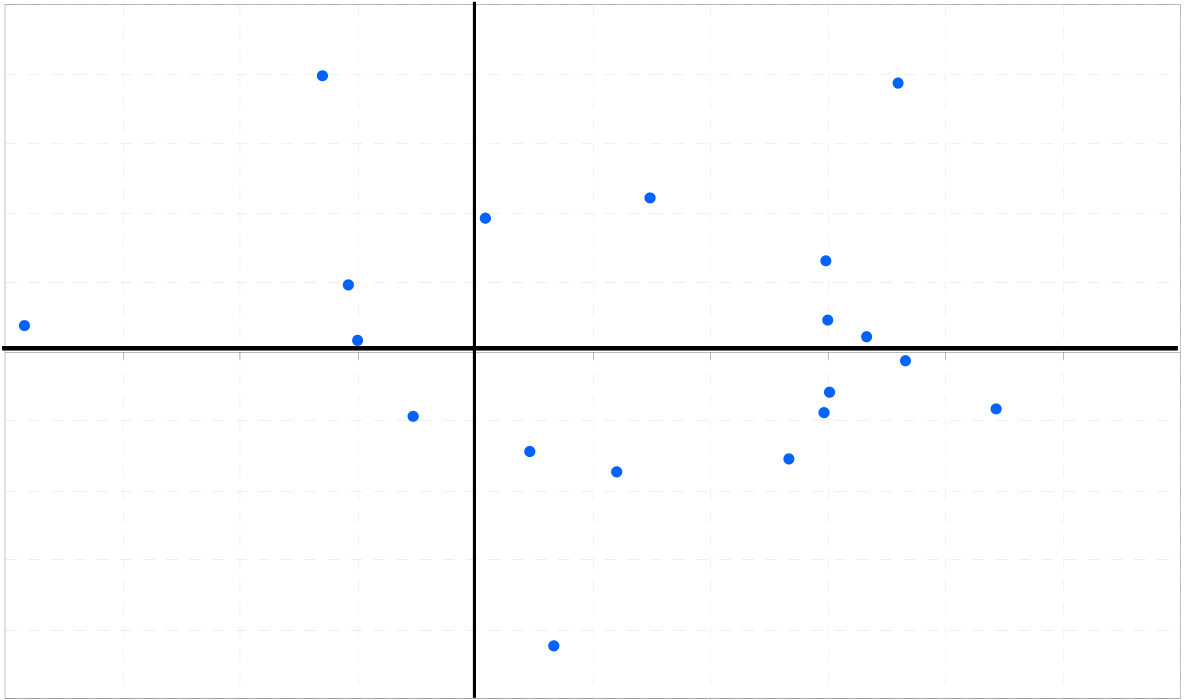
Chart 37: Price Relative & GEM Fund Allocation
|
|---|


GEM Strategy – 8 November 2005
| Underweight/Overweight | |||
|---|---|---|---|
| • | |||
| Country | |||
| Russia | Overweight | • | |
| Brazil | Overweight | ||
| • |
|
||
| Korea | Overweight | ||
| Indonesia |
|
• | Inflation and interest rates rising but FX stability implies crisis over. |
| Turkey | Overweight | ||
| Taiwan | Overweight | ||
| Mexico | Neutral | ||
| South Africa | Neutral | ||
| Israel | Neutral | ||
| Thailand | Neutral | ||
| India | |||
| Central Europe | |||
| China | |||
| Chile | |||
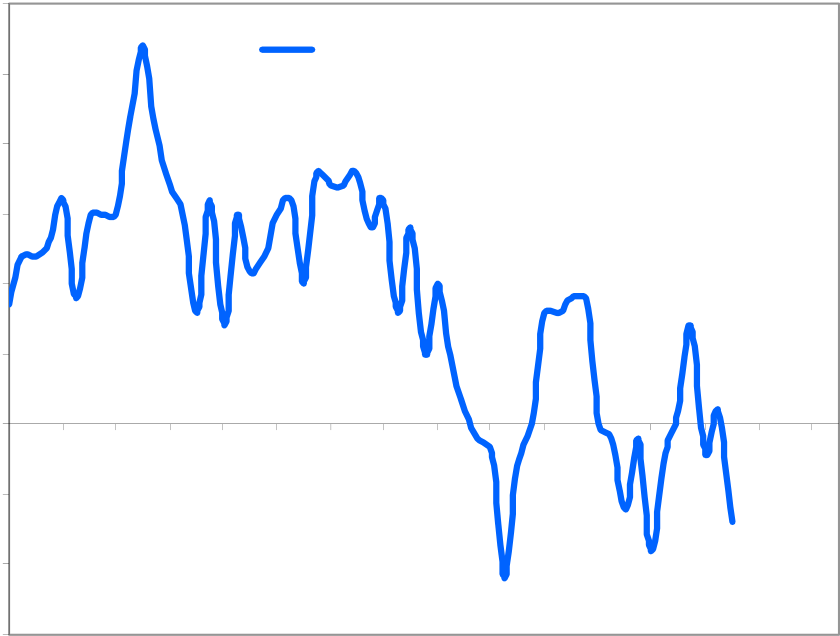
Chart 45: Price Relative & GEM Fund Allocation
Lowest exposure to Indonesia since end of 2001.
Chart 47: Indonesia Current Account Balance (US$ mn)
Chart 48: Indonesia Target Rate and FX Rate
|
|
• | |
| Overweight | |||
| Overweight | • | Liquidity-story a positive. Debt spreads tight. Rates to be cut 50bps. | |
| Overweight | |||
| • |
|
||
|
Overweight | ||
| • | |||
| Overweight | |||
|
Neutral |
|
|
| Neutral | • | ||
| Neutral | |||
| Neutral | |||
|
|
||
|
|
||