
Handbags and similar articles furniture lime fabr
Step 2: Click on ‘Advanced Query’ and choose ‘Trade Data (UN Comtrade)’
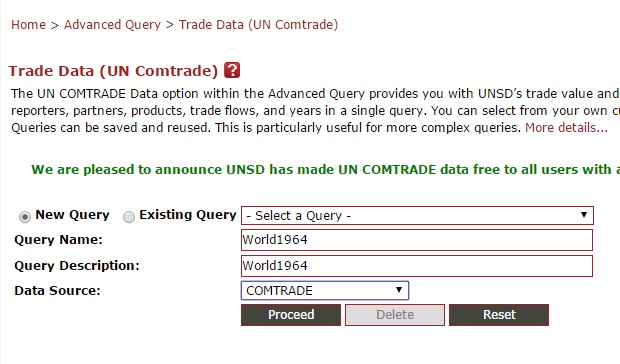
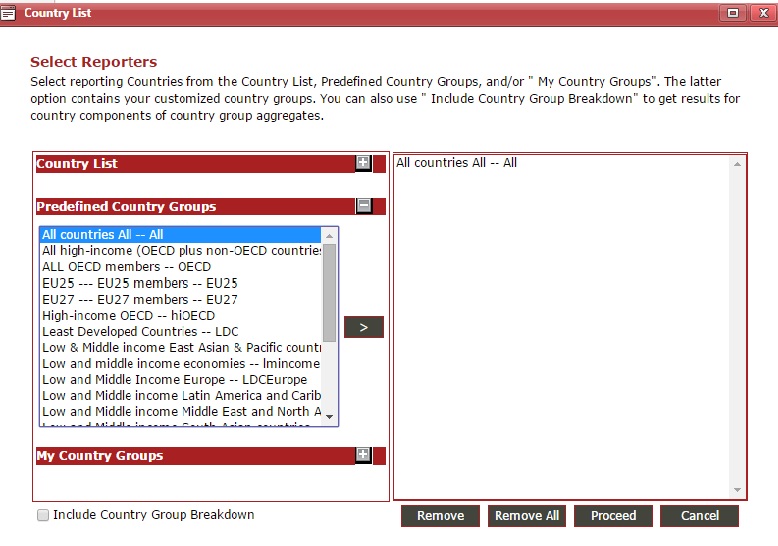
Step 3: After done at the second step, it will appears these sub-step.
Products:
Partners:
‘Select’
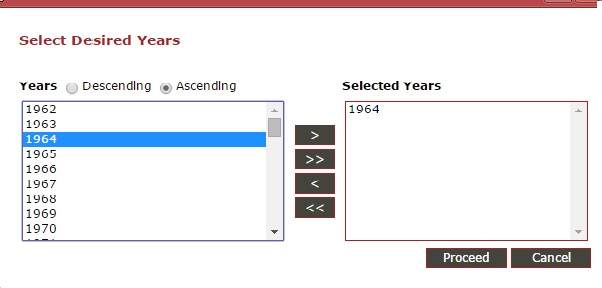
‘1964’ (choosing a year depends on which year you want to get data), then ‘>’, and ‘Proceed’
After done all of those sub-step, click ‘Submit’
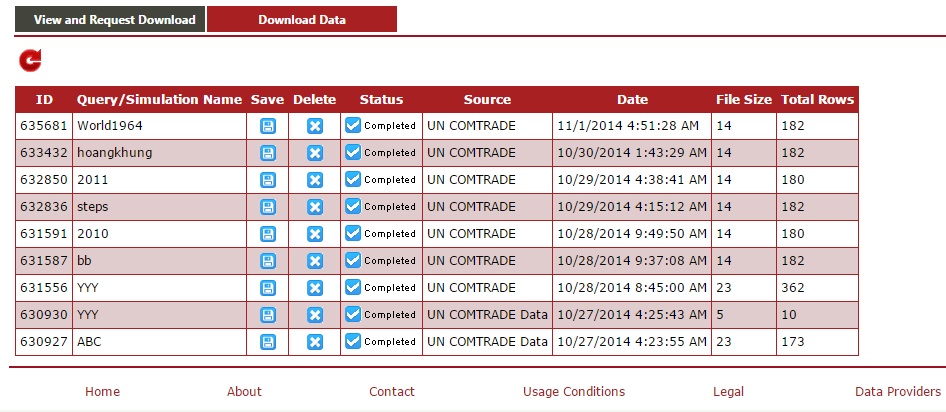
Step 4: click on ‘Download’,
Calculate Revealed Comparative Advantage (RCA) for the manufacturing sector calculation
| Rank | Product code | Top 10 commodities have comparative advantage of Japan in 1965 | |
|---|---|---|---|
| RCA | Product name | ||
| 1 |
|
||
|
|||
|
|
||
|
|||
|
|||
|
|
||
|
|||
|
|||
|
|
||
|
|||
| Rank | Product code | Top 10 commodities have comparative advantage of Japan in 2012 | |
|---|---|---|---|
| RCA | Product name | ||
| 1 |
|
||
|
|||
|
|
||
|
|||
|
|||
|
|
||
|
|||
|
|||
|
|
||
|
|||
| Rank | Product code | Top 10 commodities have comparative advantage of Vietnam in 2012 | |
|---|---|---|---|
| RCA | Product name | ||
| 1 |
|
||
|
|||
|
|
||
|
|||
|
|||
|
|
||
|
|||
|
|||
|
|
||
|
|||
Write a paragraph of no more than 500 words to describe the identified comparative
Firstly, Japan has a high proportion of skilled-labour, whereas a majority of Vietnam’s workforce is low-skill labour. Although Vietnam has ‘a vast pool of labour’, the low and non-skill worker occupies around 84.5% of total employment (General Statistics Office (GSO) 2012). It simply means that, no matter how cheap Vietnam’s labour is, it is very difficult for the country to participate in heavy or high-skill required sector. Therefore, this is one of the most disadvantaged of the country as compare to Japan.
Secondly, Japan is a master in advanced technology in the world according to CIA (2014). Japan has developed its technology since the past until now. It notices that technology development plays an important role in Japan’s manufacturing sector. As question listed above, top ten export product/sector of Japan requires a lot of advanced technology support and their professional, potential human resource. Basically, if the country cannot run its technology system well and lack of skilled-labour engagement, they properly cannot produce all of top ten products.
To illustrate, at Autarky, point A and A’, equilibrium before trade, the price ratio of Australia and Vietnam will be $\frac{Pw}{Pc} = \frac{1}{4}$ and $\frac{Pw}{Pc} = 4$ respectively. Through this, it is clear that the slope of Production Possibility Curve (PPC) in Australia is flatter than Vietnam because of smaller price ratio, then Australia has comparative advantage in Wh, and as presenting another way, Vietnam has comparative advantage in Cl. Thus, Australia should specialize in producing Wh and Vietnam will produce Cl. Meaning that Australian can only consume 60 Cl and 50 Wh (at point A), when Vietnamese can consume 30 Cl and 90 Wh. When the world price ratio is 1Wh = 1/Cl which is $\frac{Pw}{Pc} = 1$, it is between $\frac{1}{4}$ and 4, it will benefit both and Australia produces more Wh and Vietnam produces more Cl. Then A will moves to B (A’ to B’). However, when moving, the cost of producing Wh in Australia and Cl in Vietnam increases, both will stop specializing at point B which indicates the efficient production point. At B, consumers are not maximising their utility because indifference curves (IC) of both countries are lower. Consumer can consume at any point along the world price ratio line, so they can maximise utility at C where IC tangents to world price ratio line. At C, Australian can consume more of 60 Cl by exporting 60Wh to Vietnam, Vietnam is the same when exporting 60 Cl and importing 60 Wh. Consumption is now more than before trade, so both countries can enjoy their benefits.
References