
How accurately model predicts the positives and negatives
Dursun Delena,n, Leman Tomakb, Kazim Topuzc, Enes Eryarsoyd
a Center for Health Systems Innovation, Spears School of Business, Oklahoma State University, Stillwater, OK, USA b Biostatistics and Public Health, Ondokuz Mayis University, Samsun, Turkey
c Center for Health Systems Innovation, Oklahoma State University, Stillwater, OK, USA
d Management Information Systems, Istanbul Sehir University, Istanbul, Turkey
| a r t i c l e i n f o | |
|---|---|
| Article history: Received 4 August 2016 Received in revised form 22 January 2017 Accepted 23 January 2017 |
|
| Keywords: Automobile crashes Predictive analytics Risk factors Injury severity Machine learning Sensitivity analysis |
1. Introduction
Big Data has become a dominant term in describing the exponential growth, accessibility, availability, and widespread use of information—in structured, semi-structured and unstructured format—in a variety of business context (Delen, 2015). Big Data by itself, regardless of the level of volume, variety, or velocity, is worthless unless analysts do something with it that delivers value. That’s where “big” analytics comes into the picture. Although organizations have long run reports and dashboards against data warehouses, most have not opened these repositories to in-depth on-demand exploration. This is partly because analytics tools were too complex for the average user and partly also because the repositories often did not contain all the data needed for the power users. But this is about to change (and had already changed for some) in a dramatic fashion, thanks to the new Big Data Analytics paradigm. One area where Big Data Analytics has greatest potential to make a significant impact is in critical analysis of traffic accidents, especially automobile crashes and resultant injures.

2 D. Delen et al. / Journal of Transport & Health ∎ (∎∎∎∎) ∎∎∎–∎∎∎
2. Literature review
There is a wealth of literature published in reputable journals and conference proceeding on analysis of traffic accidents and resulting outcomes. A vast majority of these studies dealt primarily with the analysis of vehicle related physical properties and roadway related environmental factors that provokes the crash involvement so that the road, traffic and vehicle related features would be reengineered (designed and developed) to prevent the car crashes from happening in the first place. On the other hand, especially in the recent years, there seem to be an equally strong emphasis on data and analytics-based studies that focus on crash related injuries. Since the research explained herein deals with the analysis of crash related injuries and its root causes (underlying risk factors), the literature in this section will primarily be specific to the most relevant and rigorous work in this specific area.
Multinomial logistic regression and its derivative models (i.e., ordered-logit or ordered-probit) have been the most commonly used techniques in developing injury severity analysis models. In a recent study, a multivariate ordered-response probit (MORP) model system was developed by Abay et al. (2013) to explain the injury severity in two-vehicle crashes primarily focusing on the use of seat belts. Another study was conducted within the state of Ohio that focused on the risk factors contributing to injury severity at freeway merging and diverging locations (Mergia et al., 2013). The data set was extracted from the police-reported crash data for the years 2006–2009 and the modelling technique used was the gen-eralized ordinal logit model. The levels of the variables related to road contour were adopted from the state agency's crash database. They split the mode estimation in two parts: one for converging roads and the other for diverging roads. The fit for the model was given in terms of R-square, which was 0.10 and 0.09 for the converging and diverging roads respectively. In an earlier study, Lui and McGee (1988) used statistical methods (specifically logistic regression models) to analyze the likelihood of fatal outcomes at traffic accidents. The data for this study was procured from FARS (the Fatal Accident Re-porting System) database, which contained crashes where at least one fatality was observed. A similar statistical study was carried out by Wood and Simms (2002) for the goal of identifying risk factors that lead to fatality of incapacitating injuries.
As opposed to using only one statistical technique, some of the previous studies preferred to use two or more techniques in an either comparative or a complementary manner. For instance, Park et al (2012) used three statistical techniques—ordered probit, ordered logit, and multinomial logit—to analyze influential factors on the severity of injuries sustained in traffic crashes based on the crash data obtained from the entire network of Korean expressways in 2008. The results of the three methods combined to provide a more reliable estimate of the most influential factors. In another comparative study O’Donnell and Connor (1996) developed and compared two standard statistical modeling techniques: ordered probit and ordered logit models. In this study they wanted to investigate the likelihood of sustaining varying levels of injury severity using variety of descriptive variables including the driver characteristics. The findings of this study suggested that the level of injury severity increases with increasing driving speed, the age of the vehicle, the age of the driver and other occupants, along with high blood alcohol level (over 0.08 percent), not using a restraining system (i.e., seatbelt), female gender, and manner in which the collision happened (i.e., head-on collations). Many of the postulated outcomes and findings of this study were partially confirmed by earlier studies (Hauer, 2009; Delen et al., 2006) and also supported by the machine learning models developed in this study.
3.1. Data acquisition and preparation
The crash data used in this study was originally acquired from NASS GES (National Automotive Sampling System General Estimates System) database. This database contains roughly one percent of all US automobile crashes as they are reported by law enforcement agencies (GES, 2014). The database is specifically designed to have a sufficiently large nationwide sample of all crash reports created by local police departments. The original dataset contains information related to property damage, driver characteristics, crash circumstances, environmental conditions and severity of the injury specifications for all occupants.
4 D. Delen et al. / Journal of Transport & Health ∎ (∎∎∎∎) ∎∎∎–∎∎∎
Fig. 1. The data acquisition/merging/preparation process.
D. Delen et al. / Journal of Transport & Health ∎ (∎∎∎∎) ∎∎∎–∎∎∎ 5
Table 1
List of variables included in the study.
After the preprocessing the data, we noticed that in the representation of the dependent variable we’ve had significantly less number of reported cases for high-level of injury severity than the number of cases for low-level of injury severity. Indeed, we had an underreported crash data problem (Abay, 2015; Ye and Lord, 2011), which is also commonly called as data imbalance problem in data mining. This problem is quite common in machine learning and data mining applications as it appears in many real-world data sets. It is a problem because if not handled, the prediction results would be skewed significantly in favor of the majority class (Thammasiri et al., 2014). That is, for significantly skewed datasets, the results may have very high accuracy for the majority class and the overall prediction problem while having very low accuracy for the minority class. For instance, a dataset having 95% representation of the majority class and 5% of the minority class would have 95% accuracy without correctly classifying any of cases for the minority class. In data mining, this is often referred to as“fool’s gold.” There is not a best way to handle imbalanced data problem. Therefore, in this study, we experimented with the most common procedures—under sampling, over sampling and a hybrid of over and under sampling—and settled on using the under sampling method for balancing the dataset.
|
= |
|
|---|---|---|
An MLP type neural network is basically a collection of processing elements (nonlinear neurons or perceptrons) orga-nized in layers and connected to other layers in a feed-forward multi-layer structure, where the input layer obtains the data/ signal and passes it on to the next hidden layer, then potentially to another hidden layer, and ultimately to the output layer. The end signal at the output layer is then compared to actual observation and the error/difference is fed back to the network (in some form) for gradual adjustment of it parameters/weights (i.e., the learning process). Neural networks in general and MLP in specific are known to be very capable complex function approximators for prediction (both regression as and classification) as well as for clustering/segmentation type analytic problems. In an empirical study, Hornik et al. (1990) showed that an MLP neural network model (given that it is designed optimally with proper model parameter values) can learn highly complex non-linear relationships to optimal accuracy level. Accordingly, Alkheder et al (2016) used ANN to successfully predict severity of traffic accidents, while Karlaftis and Vlahogianni (2011) showed the differences and simi-larities of ANN to its statistical counterparts within the context of transportation research.
In addition to their solid mathematical foundation in learning theory, SVMs have also demonstrated highly competitive performance in numerous real-world prediction problems, such as medical diagnosis, bioinformatics, face/voice recognition, demand forecasting, image processing and text mining, which has established SVMs as one of the most common analytics tools for knowledge discovery and data mining. Similar to artificial neural networks, SVMs possess the well-known ability of being universal approximators of any multivariate function to any desired degree of accuracy. Therefore, they are of par-ticular interest to modeling highly nonlinear, complex problems, systems and processes. SVM have already become a standard analytics tool in transportation research (Chen et al., 2016a; Li et al., 2008).
3.2.3. Decision trees
Decision trees are not new. Some form of decision trees has been used for a variety of decision problems since early 1930s. Early implementation of decision trees was based on expert knowledge, and not so much on data (i.e., deductive as opposed to inductive). With the widespread use of data mining and the new algorithmic advances that allowed them to be developed inductively from historic data, decision trees have become common complement to existing analytics tools again. They are not only viable but also increasingly more popular alternative to neural networks and support vector machines in wide range of analytics problems.

|
10 % | D. Delen et al. / Journal of Transport & Health ∎ (∎∎∎∎) ∎∎∎–∎∎∎ | 10 % | 10 % | ||||||
|---|---|---|---|---|---|---|---|---|---|---|
| 10 % | 10 % 10% | |||||||||
|
||||||||||
| 10 % | 10 % | 10 % | 10 % |
|
10 % | |||||
| 10 % | 10 % | 10 % | 10 % | 10 % | 10 % | |||||
| 10 % | 10 % |
|
10 % |
|
10 % | 10 % | ||||
Estimating the true accuracy of a classification model induced by a supervised learning algorithm is important for the following two reasons: first, it can be used to estimate its future prediction accuracy on real cases, which could indicate the level of confidence one should have in the classifier’s output in the prediction system. Second, it can be used for choosing a classifier from a given set (identifying the “best” classification model out of the trained ones). The most common estimation methodologies used for classification-type data mining models is to split the data into training and testing sets. A con-ventional implementation of this methodology is often called k-fold cross validation. In k-fold (or v-fold, depending on which literature you look at) cross-validation methodology, the complete dataset (all of the samples/rows) is randomized and then split into k distinct subsets of near equal number of samples/rows. To operationalize the experimentation, a classifier is trained on the k-1 number of records and tested on the remaining one subset. This experimentation process (i.e., training followed by testing) is repeated for k times, each time a different fold is used as the test dataset and the remainder of the samples is used as the training dataset. Then the overall accuracy of the classifier is calculated using a simply average of the k individual test sample accuracy measures. The formula for this aggregation is shown Eq. (1).
|
) = | 1 | k ∑ |
||
|---|---|---|---|---|---|
| k | ( ) |
3.4. Evaluation metrics
Methodological advancement (including recent applications of advanced analytics and ensemble models) has sub-stantially improved our understanding of the factors that affect crash-frequencies and crash severities. It is perhaps the combination of evolving methodologies and assessment techniques that holds the greatest promise in advancing the analytics studies in this application domain (Lord and Mannering, 2010). Therefore, to have a good comparison of the analytics models, in this study we employed several performance assessment measures (Pal et al. 2016):
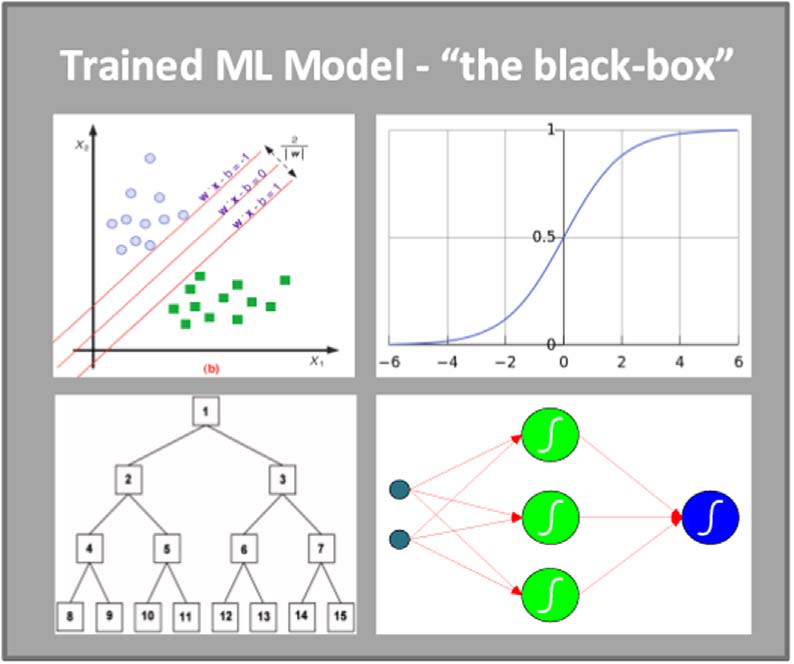
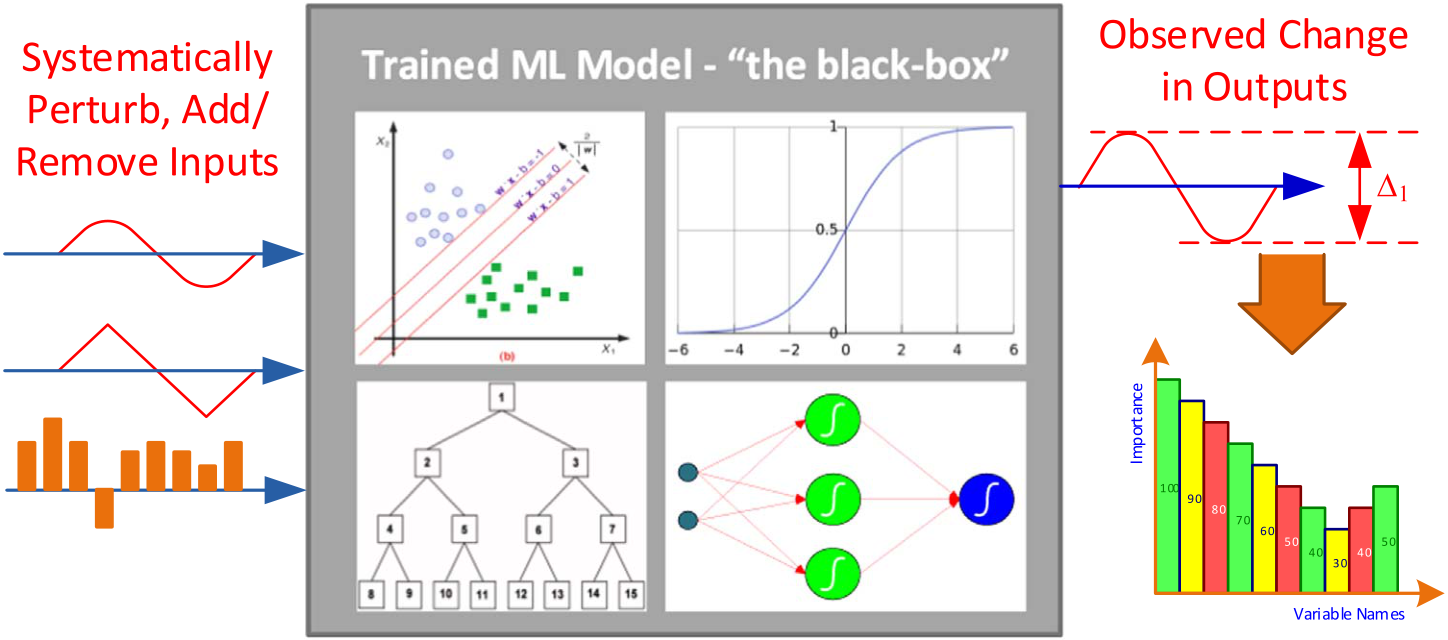
3.5. Sensitivity analysis
Machine learning algorithms are really good at capturing complex relationships between input and output variables (producing very accurate prediction models), but are not nearly as good at explaining how they do what they do (i.e., model transparency). In order to mitigate this deficiency (also called the “black-box syndrome”), machine learning community developed several sensitivity analysis methods. In the context of predictive modeling, sensitivity analysis refers to an ex-clusive experimentation process aimed at discovering the cause and effect relationship between the input and output variables (Davis, 1989).
In the denominator of the equation, V(Ft) refers to the variance in the output variable. In the numerator, V(E(Ft|Xi)), E is the expectation operator to calls for an integral over parameter Xi; that is, inclusive of all input variables except Xi, the V, the variance operator applies a further integral over Xi. The variable contribution (i.e., importance), represented as Si, for the ith variable, is calculated as the normalized sensitivity measure. In a later study, Saltelli et al. (2004) proved that Eq. (6) is the most probable measure of model sensitivity that is capable of ranking input variables (i.e., the predictors) in the order of importance for any combination of interactions including the non-orthogonal relationships amongst the input variables. In order to properly combine the sensitivity analysis results for several prediction methods, we used an information fusion based methodology. Particularly, we modified the Eq. (6) in such a way that the sensitivity measure of an input variable n based on the information obtained (i.e., fused) from m number of prediction models can be shown as in Eq. (7).
| S | n fused ( | ) | = |
|
= | ω 1 1 S n | + | ω | 2 2 S n | + | ... | + | ω | ( ) |
|---|
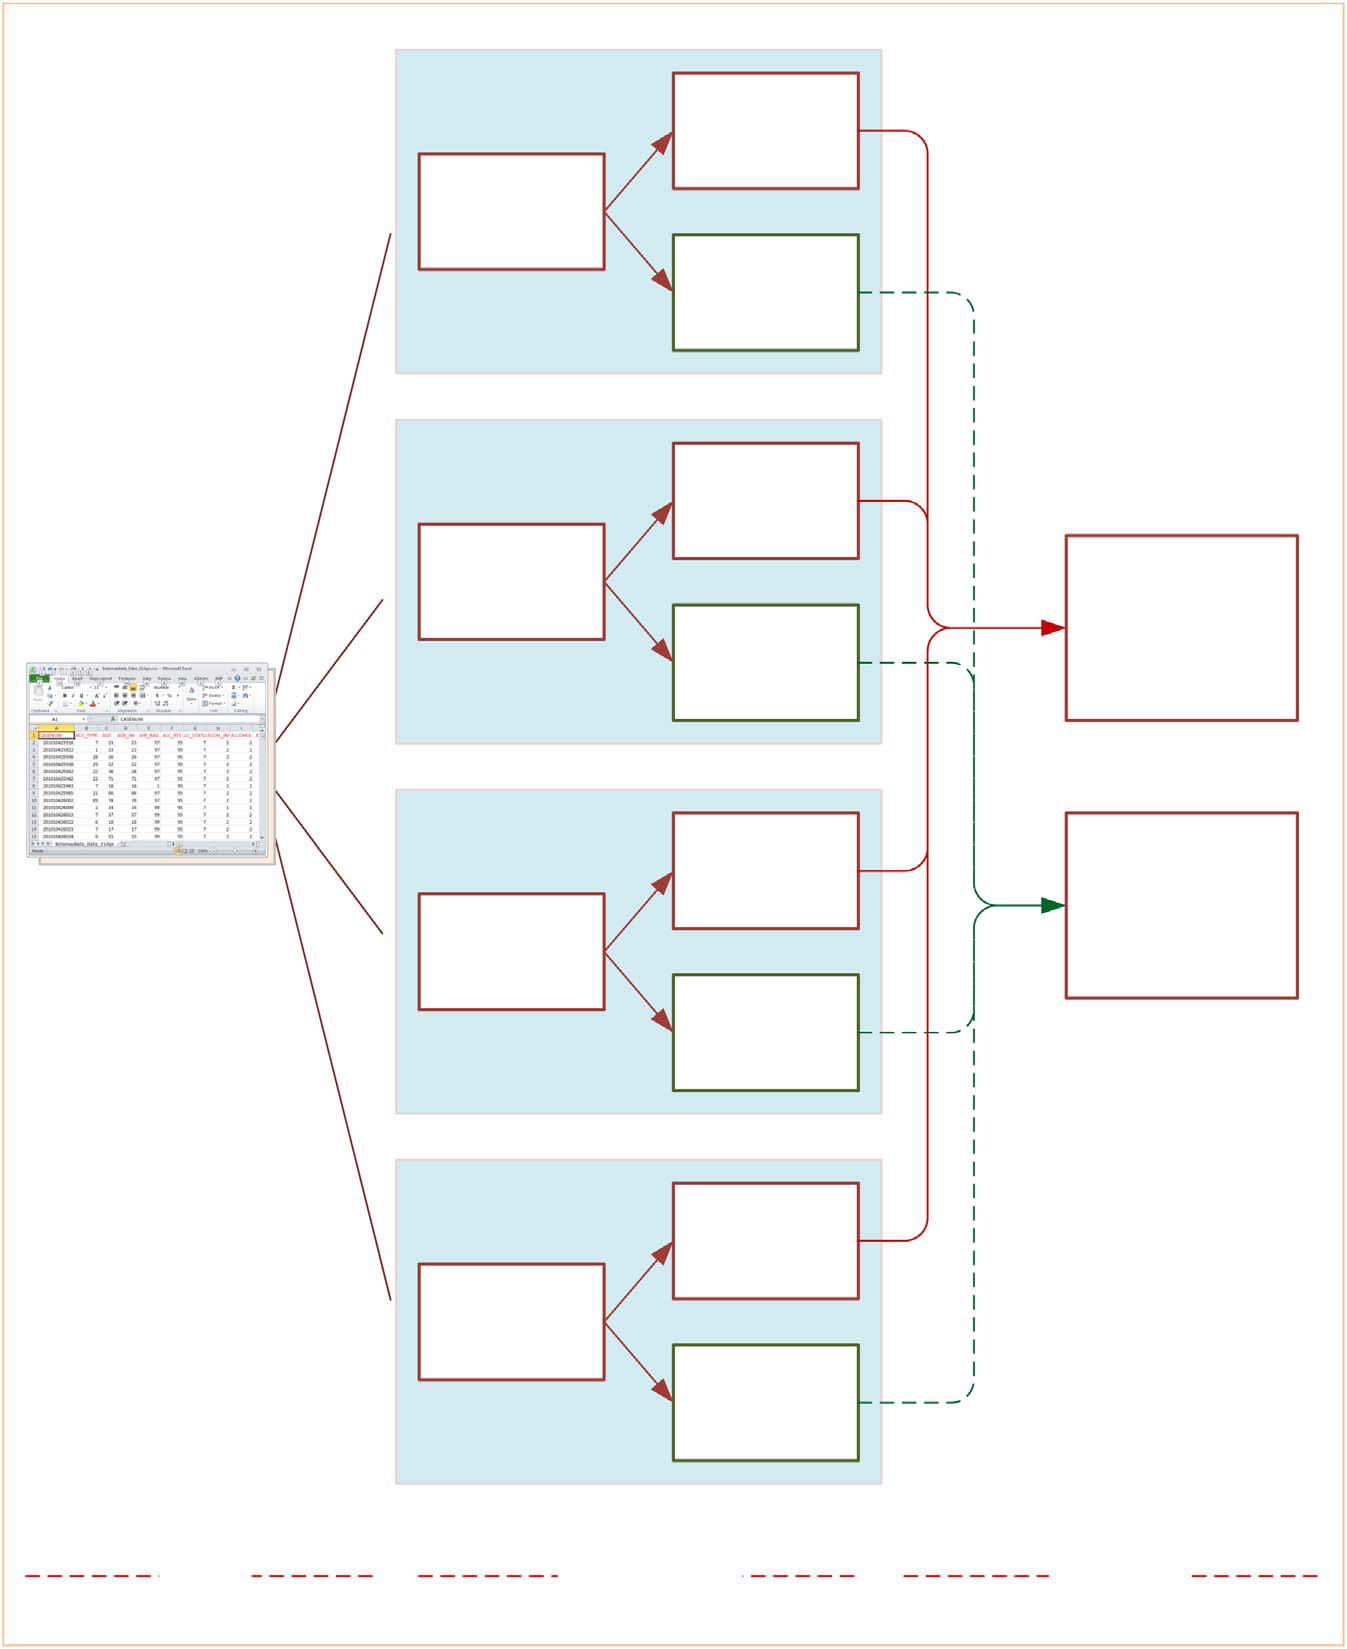
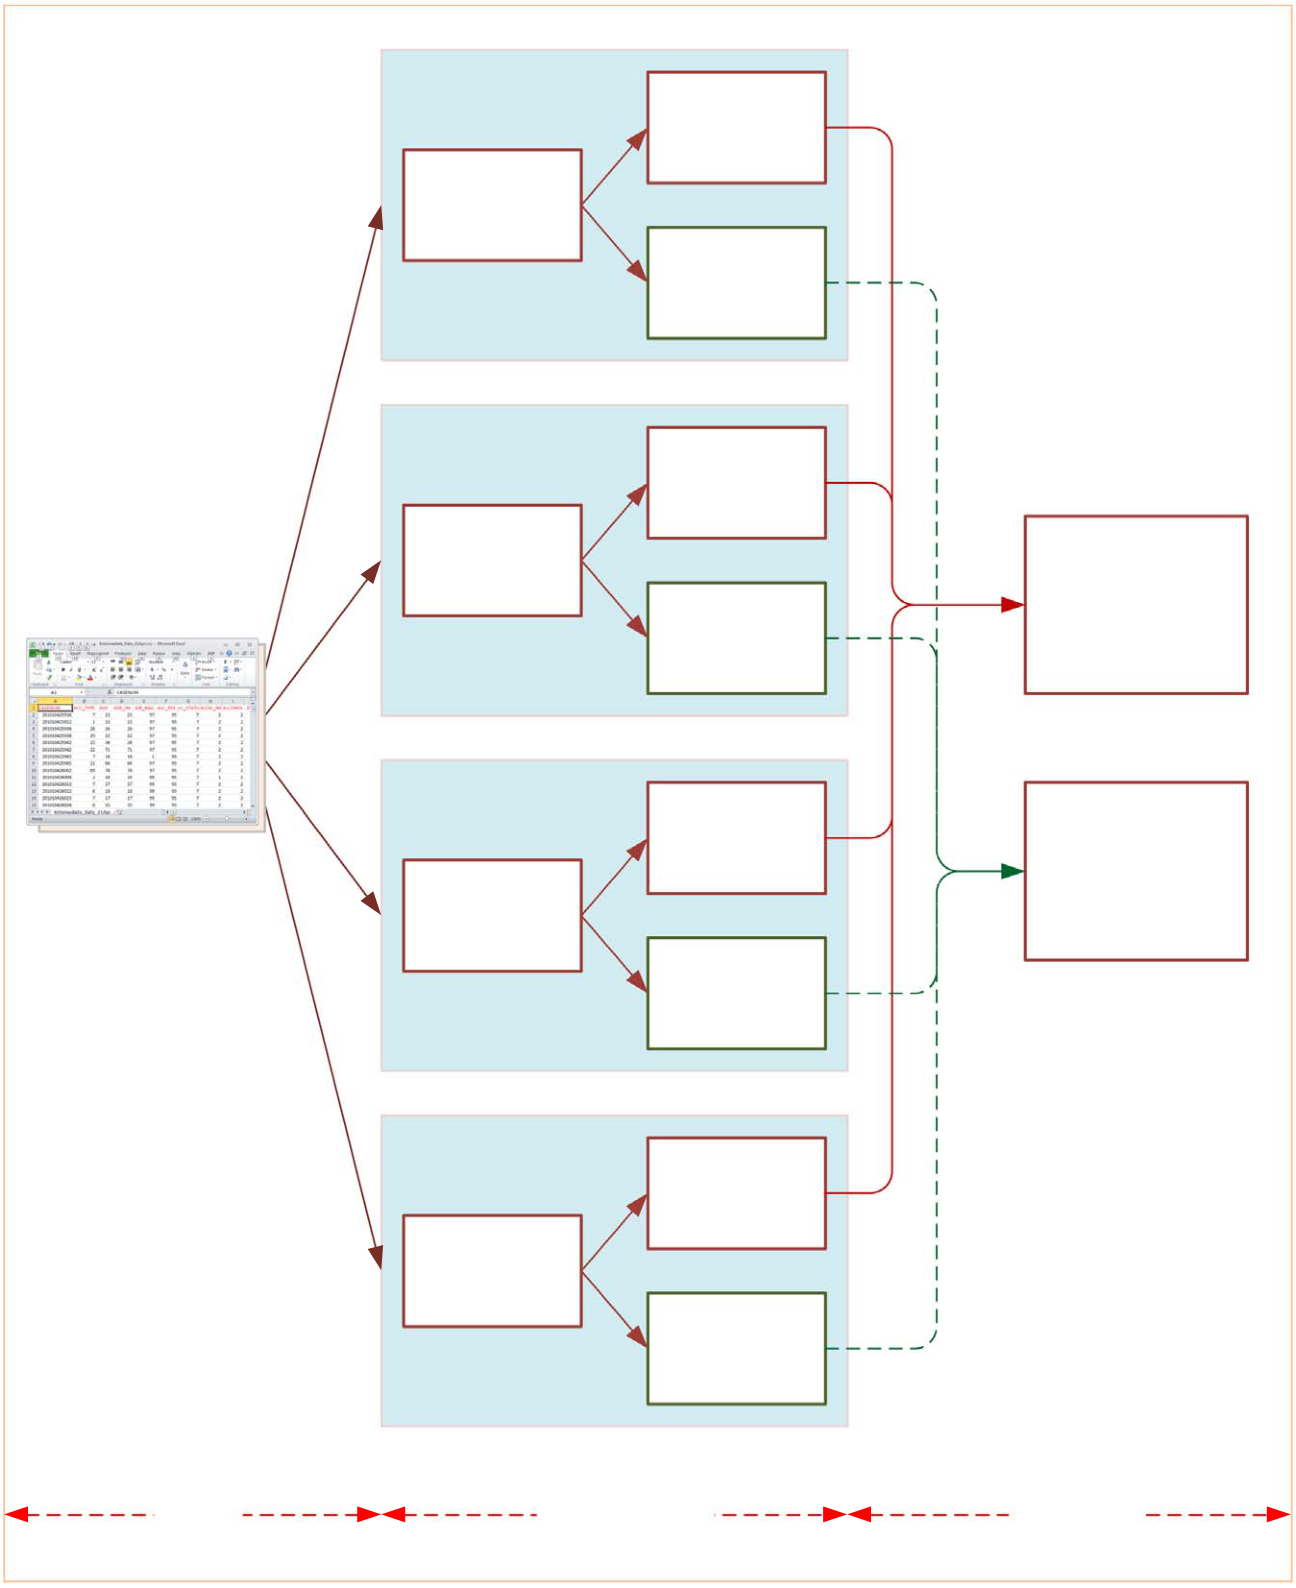

Fig. 5 pictorial represents the process of model training (i.e., building), testing (i.e., validating) and importance measuring (i.e., assessing variable importance with information-fusion based sensitivity analysis). As shown on the left hand-side of the figure, the input data is pre-processed and converted to a flat file in Excel format. As part of the cross validation procedure, the dataset is then randomly split into 10 mutually exclusive partitions—to be used as training and testing sets recursively for each model types—that resulted in 40 prediction models. As the right hand-side of the figure shows, the prediction accuracy and sensitivity analysis results of all models are accumulated and represented using aforementioned performance metrics.
Table 2 shows the predictive accuracies of all four model types. Specifically, it shows the confusion matrices, overall accuracy, sensitivity, specificity and area under the ROC curve measures obtained using 10-fold cross validation for all four mode types. As the results indicate, SVM was the most accurate classification techniques with better than 90% overall accuracy, comparably high sensitivity and specificity, and an AUC value of 0.928 (out of maximum 1.000). The next best model type was C5 decision tree algorithms with slightly better accuracy measured than ANN. The last in the accuracy ranking was LR, also with decent accuracy measures but not as good as the machine learning methods.
D. Delen et al. / Journal of Transport & Health ∎ (∎∎∎∎) ∎∎∎–∎∎∎ 11
Table 2
Tabulation of all prediction results based on 10-fold cross validation.
| Confusion Matrices | Accuracy | Sensitivity | Specificity | AUC | ||||
|---|---|---|---|---|---|---|---|---|
| Low | ||||||||
| Low | 12864 | 85.77% | 81.31% | 89.78% | 0.865 | |||
|
High | 2409 | 10477 | 90.41% | 88.55% | 92.07% | 0.928 | |
| Low | 13192 |
|
||||||
| High | 1475 | 11411 | 86.61% | 84.55% | 88.46% | 0.879 | ||
| Low | 12675 | |||||||
| High | 1991 | 10895 | 76.97% | 77.27% | 76.57% | 0.827 | ||
| Low | 8961 | |||||||
| High | 3525 | 11986 | ||||||

Fig. 6. Variable importance values.
12 D. Delen et al. / Journal of Transport & Health ∎ (∎∎∎∎) ∎∎∎–∎∎∎
(REST_USE_N) is the outright frontrunner. As suggested in some of the previous studies (Delen et al., 2006; Abay et al., 2013), the use of seat belt is one of the most important factors to determine the level of injury severity. As indicated in Delen et al. (2006), compared to minor automobile crashes, use of seat belt (or any other straining system) becomes significantly more important predictor of injury severity for more serious crash that involves multi-cars, high speed and adverse driving conditions. The second most important predictor in the group one came out as MAN_COL_IM (manner of collision), which specifies the orientation of the motor vehicle while involved in the crash that includes front-to-front, rear-end, head-on, angle, sideswipe, and so on. The importance of this variable is consistent with some of the previous studies including Kononen et al. (2011), Jung et al. (2011) and Abaya et al. (2013). The next most important variable, EJECT_IM (whether the driver was ejected from the car) is an obvious and at the same time an inquisitive factor. It is inquisitive because it is highly“correlated” with the use of restraining system. Usually, in situations where similar information is provided to a machine learning algorithm (using two or more variables), algorithm picks the most informative one and ignores the other. In this case, all of the prediction models found these two variables collectively predictive of the injury severity level. The last variable in the first group, DRUGRES1 (results of the drug test), signifies the contribution of drug use in injury severity in traffic accidents. Represented with a continuous numerical value, where larger values indicate high dosage of drug, this variable also finds validation from the existing literature, although not as prevalent as it is found in this study.
In this paper we presented the results of our investigative study which was conducted for the purposes of identifying person, vehicle, and accident related risk factors that are influential in making a difference in the level of injury severity sustained by a driver in a car crash. After numerous experimentation with possible model types and modeling parameters, the best performing four model types—neural networks, support vector machines, decision trees and logistic regression—are employed to develop and test forty prediction models (4* 10-fold ¼ 40). In order to capture the complex relationships a large and feature rich crash data set is obtained and meticulously preprocessed for the model building efforts. According to the cross validation results, support vector machines are the most accurate predictor of the injury severity levels followed by
Please cite this article as: Delen, D., et al., Investigating injury severity risk factors in automobile crashes with predictive |
|---|
Data mining (also known as knowledge discovery in databases, or predictive analytics) is meant to “discover” new and useful patterns (knowledge nuggets) in large databases (often secondary data that is collected for transactional and/or reporting purposes). The main keyword here is the “usefulness/practicality” of the discovered patterns. In this study, we designed and developed several predictive analytics models, and also discovered the variable importance measures. From the practicality standpoint, these variable importance measures can potentially be used to (1) identify features to improve in vehicles (e.g., better design and adherence of restraining systems), (2) improve environment and/or road related char-acteristics (e.g., lighting, surface, etc.), (3) build awareness towards high-risk personal and behavioral factors that contribute to the severity of injuries (e.g., importance of wearing seatbelts, effects of being under the influence, etc.), and (4) better planning and deployment of first responders to an accident (using predictive models to assess the potential severity of injuries).
There is no doubt that we are living in the era of Big Data and Analytics. The unprecedented popularity and the wide-spread use of analytics can be attributed to tree main factors: (1) desperate need for knowledge to do the best with con-straint resources, (2) availability of data and information infrastructure (both hardware and software) and, (3) the afford-ability and increased capability of these evince-based decision support methods and tools. Data and analytics driven risk assessment and management is at the center of this analytics movement. Timely and proper use of analytics to derive actionable insight require a methodical and holistic approach. With this study we wanted show the viability, and to some extent the superiority, of data analytics approach in critical investigation of the risk factors that are related to different levels of injury severities in car crashes.

14 D. Delen et al. / Journal of Transport & Health ∎ (∎∎∎∎) ∎∎∎–∎∎∎