
Isis program and proteus assignment project help
Regulated Power Supply homework help
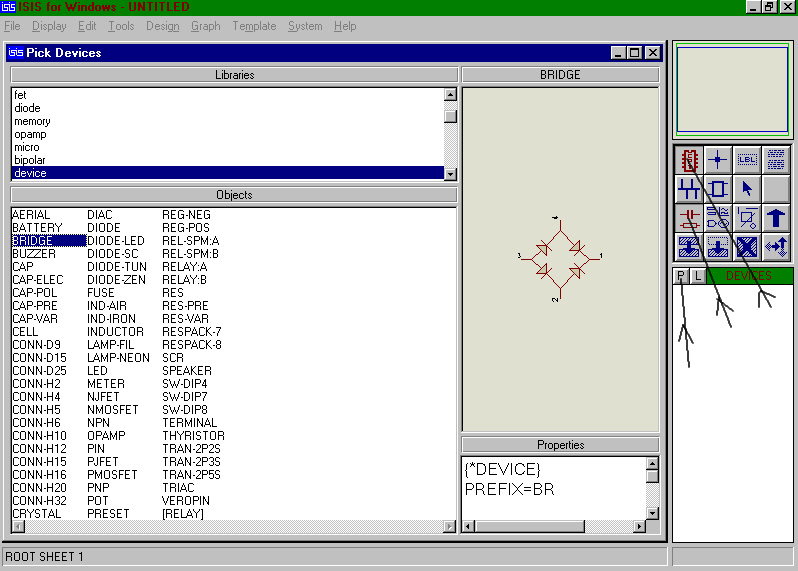
Fig 1
Step 3
How to simulate using the ISIS program
Select the components from the right hand window and place them onto the drawing area and then connect them up (fig 3). The mouse turns to a cross at a component node. Just click (release) move to another node, then click (release) to wire two nodes together. Fig 3 highlights the rotation arrow - needed for correct component orientation. Keys F5 - F11 are the zoom keys. The window at the top right is an overview of the drawing: use this to place the view window over the area you are editing.
To move a component’s position, just right click to highlight it, then click left - hold drag and release. If you right click twice the component will be removed. Use the U key to undo an operation.
Step 5
Fig 4
How to use ISIS program within Proteus
Now place a sine wave generator at the bridge input. Select Main mode - component and P (as before). Choose the library “asimmdls” and select VSINE. Place VSINE onto the schematic (fig 5).
20V RMS supply (Peak of 20 * √2 = 28.28V) at 50 Hz.
Peak to peak ripple of no more than 1.5V
(assume two diode drops gives 1.4 V)
Iave = 26.13 mA
Step 8
Fig 6
Continue to edit all other components. Note that:
n = nano
Step 9
Similarly right click VSINE and then left click to open the edit box and enter the design parameters as in fig 7:
Step 10
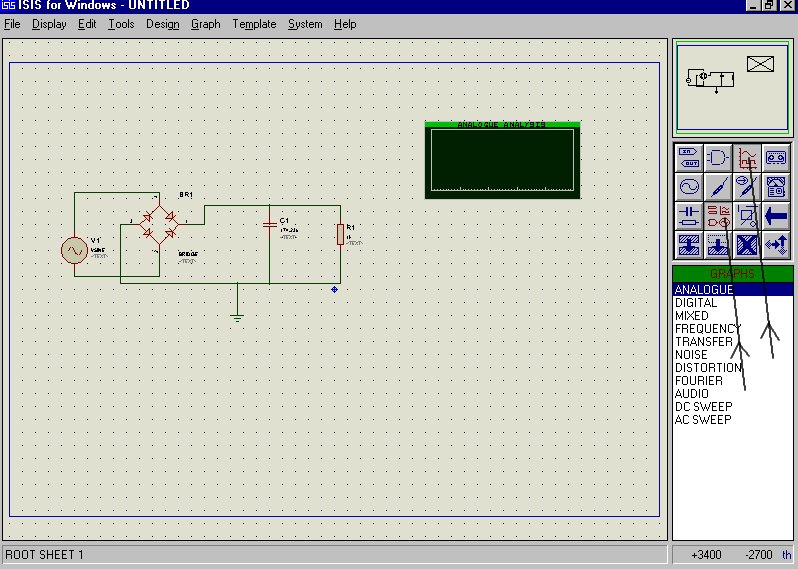
Fig 8
ISIS program and Proteus assignment help
Step 12
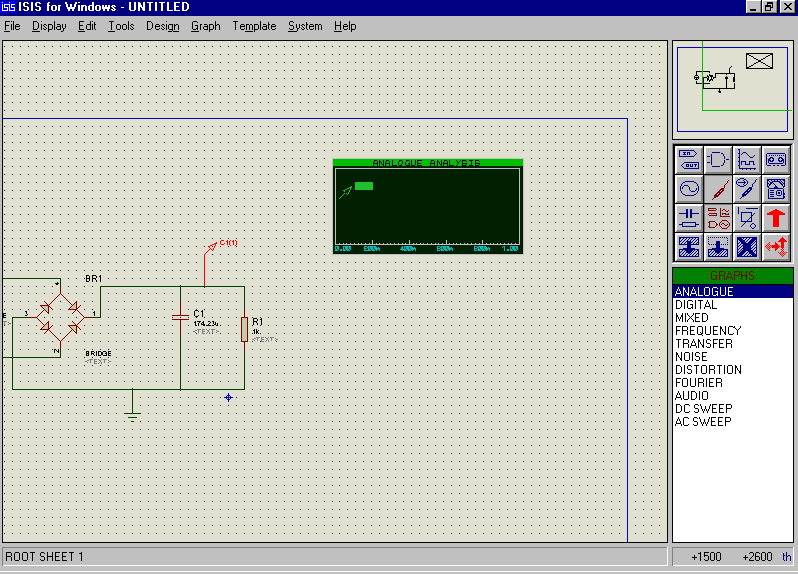
Fig 10
ISIS program and Proteus project help
Step 13
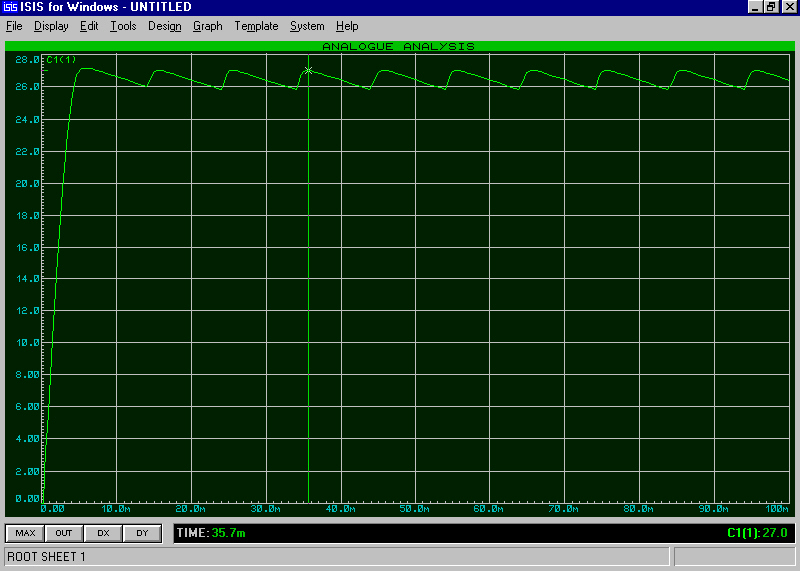
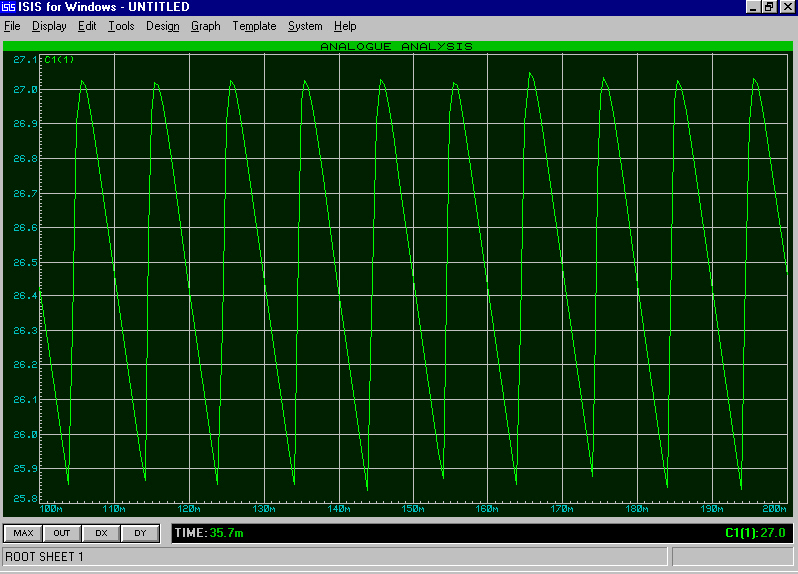
Place the cursor over the graph and press space bar to run the simulation. Provided you have connected everything together properly (not left wires off nodes etc.) then a trace will appear on the graph. Now click in the green bar on the top of the graph to expand it to full screen (fig 12).
To return to the ISIS widow press ESC.
ISIS program and Proteus assignment project help
Set the time parameters of the graph to “Start time” 100ms and “Stop time” 200ms. This will display the steady state ripple. Since the transient is no longer displayed then a higher proportion of the graph contains the ripple which can be measured more accurately (fig 13). Again make some measurements of ripple and comment on the results.
Part 2
820 Ohm load
Calculate the capacitance.
Part 3 –
Points to note
The Voltmeter and Ammeter symbols are used (from the Active library)
Fig 16
Once you have the basic circuit operational, you can investigate its functionality.
What steps can you take to limit the power dissipation in Q1 to its rated level of 1W?
Modify the circuit so that with the use of a potentiometer, the output voltage moves from 0 to its max. value with the given zener.