
List customer and project ctqs critical quality ranking matrix
 |
||
|---|---|---|
Version 5
Our Mission:Manage Army installations to support readiness and
1 of 37 3211544RMAY07
2 of 37 3211544RMAY07
 |
||
|---|---|---|

|
||
|---|---|---|
Version 5 |
||
| Define Deliverables | ||
| 5 of 37 | 3211544RMAY07 |
|---|
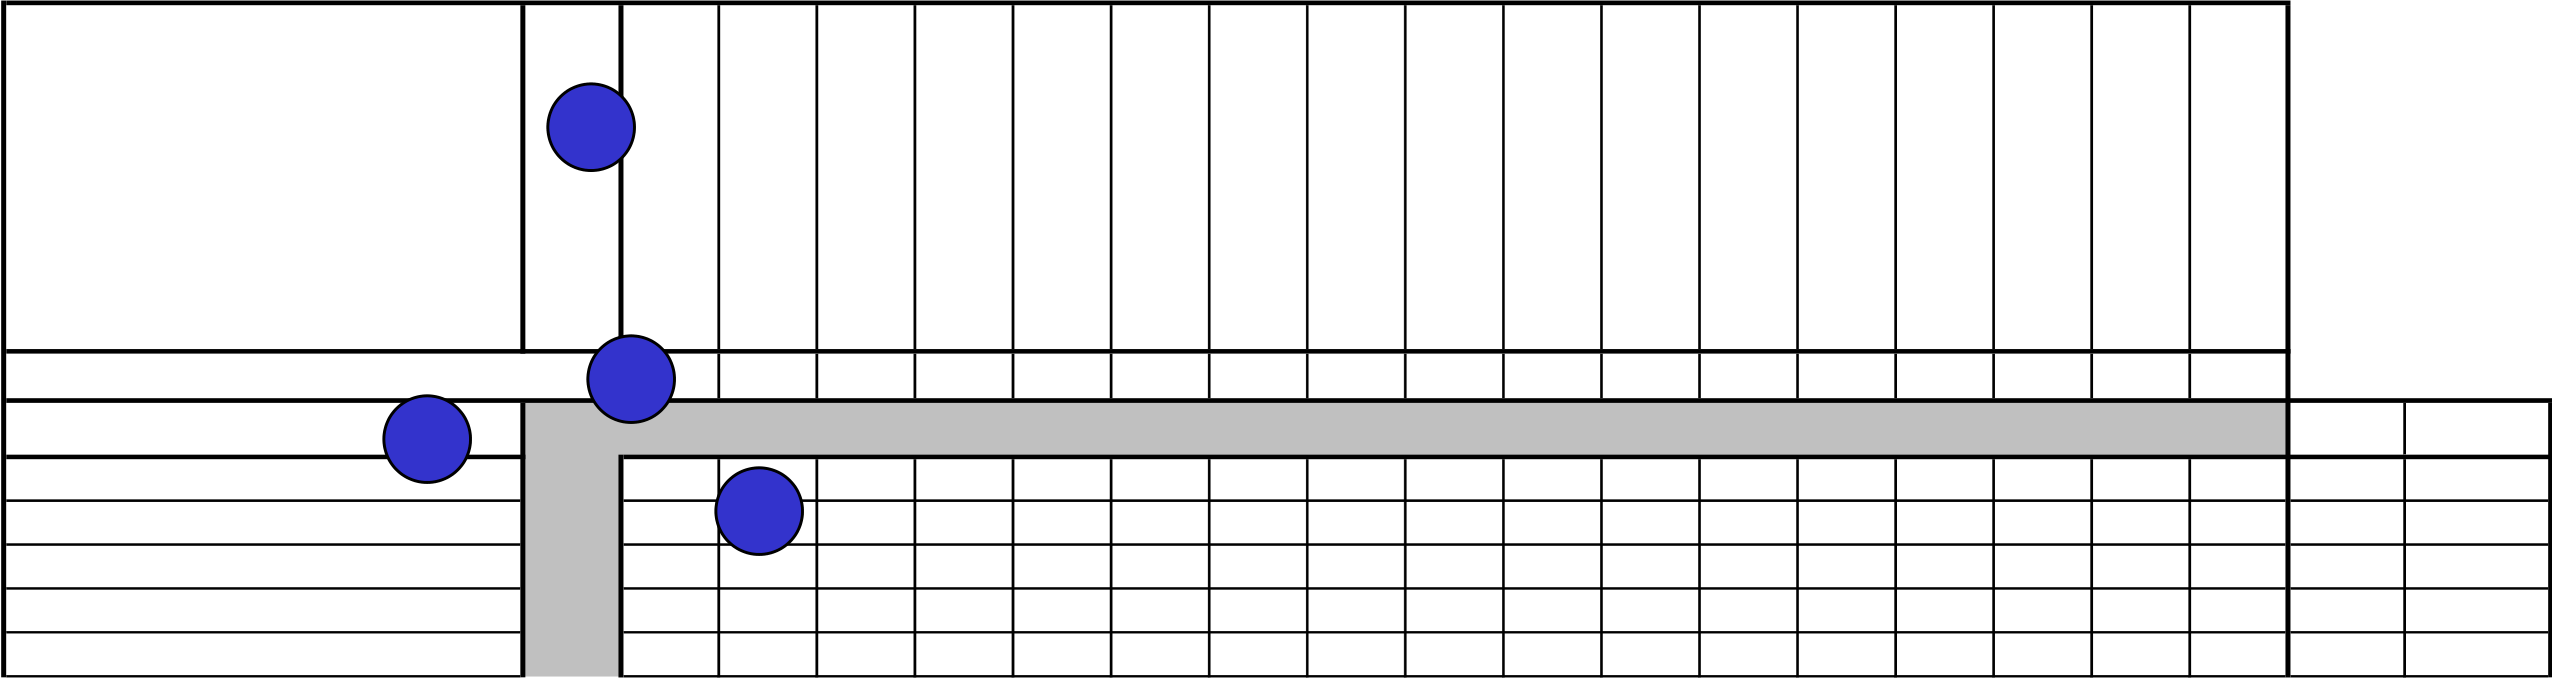
Several software applications can be used for Detailed Process Maps (MS Visio, MS PowerPoint,
process and key linkages
Steps for constructing a SIPOC:
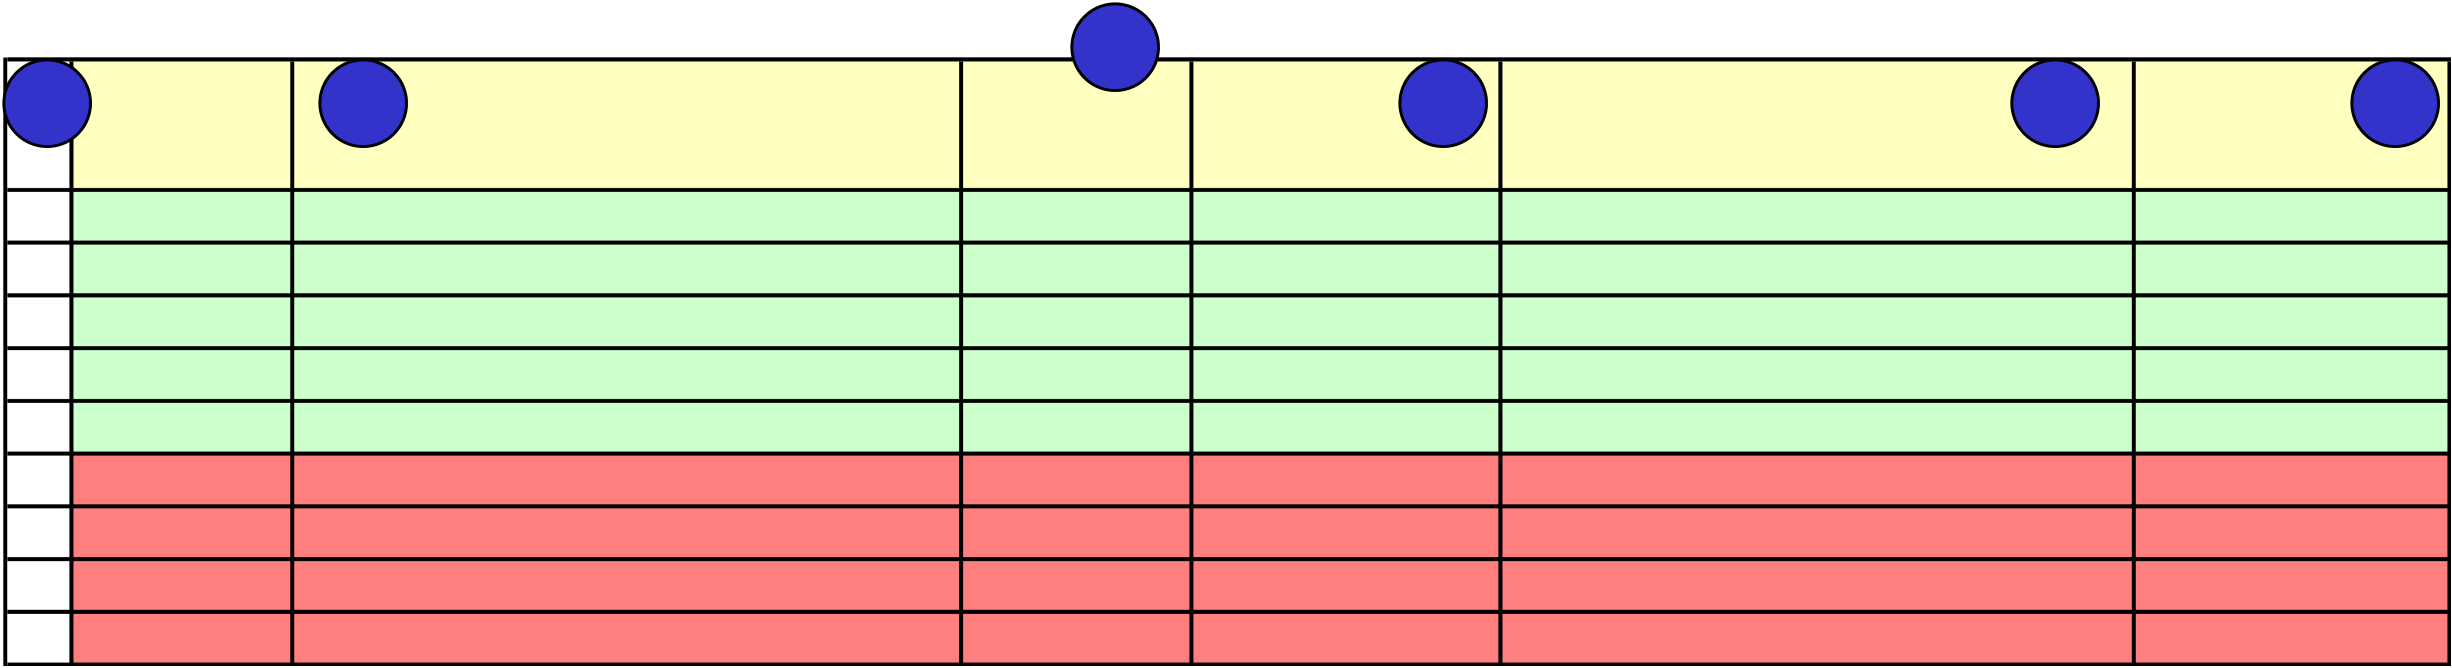
| Customer | Input Metrics | Process Metrics | Output Metrics | Quality | |
|---|---|---|---|---|---|
|
|||||
|
Speed | ||||
| – who provides the inputs to your process? |
| Suppliers | Inputs | Process | Outputs | Customer |
|---|---|---|---|---|
|
|
Quality | |||
|---|---|---|---|---|
| Speed | ||||
| Cost |
| 8 of 37 | 3211544RMAY07 |
|---|
Version 5 |
||
|---|---|---|
| Value Stream Map – Instructions |
Value Stream Map Symbols
|
||
|---|---|---|
Customer Requirements / Prioritization Tool
1
Customers ▼
| 1 | Ranking ► | Rank | ||||
|---|---|---|---|---|---|---|
| 2 |
3
4
1. List all customers related to the in-scope process
2. Rank each customer in relative importance to the process (multiple customers can have the same ranking)
| 1 | Who | What & Why | Sources |
|
|
|---|---|---|---|---|---|
| Customers & Segments |
|
||||
| Check all that apply | |||||
|
|
Interviews | |||
| Focus groups | |||||
| 2 | Surveys | ||||
| Comment cards | |||||
|
Sales visits/calls | ||||
|
|||||
| Direct observation | |||||
|
Benchmarking | ||||
|
|||||
| Other: | |||||
Instructions
| 12 of 37 | 3211544RMAY07 |
|---|


|
<VOC Need I> | |||
|---|---|---|---|---|
Version 5
|
 |
|---|
| 14 of 37 | 3211544RMAY07 |
|---|
|
|---|

This approach to group decision making places the leader in a particular role in which he/she must cease to contribute, avoid evaluation, and refrain from thinking about solution or group products; instead he/she must concentrate on the group process by assuming responsibility for accurate communication between members.
The way decisions are made testify to the degree of effectiveness of a group. Here is a list of facts about effective and ineffective groups:
| Stakeholder Analysis – Instructions |

Stakeholder Assessment Example Stakeholder Analysis
Green Belt Practitioners Toolkit |
||||||||||
|---|---|---|---|---|---|---|---|---|---|---|
| Current Level |  |
|||||||||
| STAKEHOLDER |
|
NEGATIVE | NEUTRAL | HELPFUL |
|
|||||
| 1 | 2 | 3 | - Let Ted brief the project outcomes to the | |||||||
|
||||||||||
|
||||||||||

demonstrates to Anne that we are not
adding difficulty to her job
|
- Continue to provide weekly updates that |
|---|
Steps:
1. List all stakeholders, by name and position where possible

Green Belt Practitioners Toolkit |
||||||||||
|---|---|---|---|---|---|---|---|---|---|---|
| Instructions | ||||||||||
| Project Benefits |
12/1/2006 |
x | ||||||||
| The Project Benefit Estimate is a means to summarize potential project | All values based on 12 months of savings starting | |||||||||
| benefits, mainly related to cost, but also related to speed and quality | Benefits | 200,000 | ||||||||
|
||||||||||
| Only populate the fields related to your project benefit; most likely, you | ||||||||||
|
10,000 | |||||||||
| 3 | ||||||||||
|
|
|||||||||
| 20,000 | ||||||||||
|
|
Total Project Costs | 30,000 | |||||||
| Net Annualized Savings | 290,000 | |||||||||
| Soft Savings (description and quantification): | ||||||||||
|
||||||||||
| Maintenance cost reductions |
|
|||||||||
| estimate improvement of 50% on wait time. | ||||||||||
| 5 |
|
|||||||||
|
||||||||||
|
|
|||||||||
|
||||||||||
|
||||||||||
| 6 | ||||||||||
|
||||||||||
|
||||||||||
| 7. Project Costs – costs incurred as a result of the solution | ||||||||||
| Total One Time Savings | 0 | |||||||||
| 20 of 37 | 3211544RMAY07 |
|---|
21 of 37 3211544RMAY07
| 22 of 37 | 3211544RMAY07 |
|---|
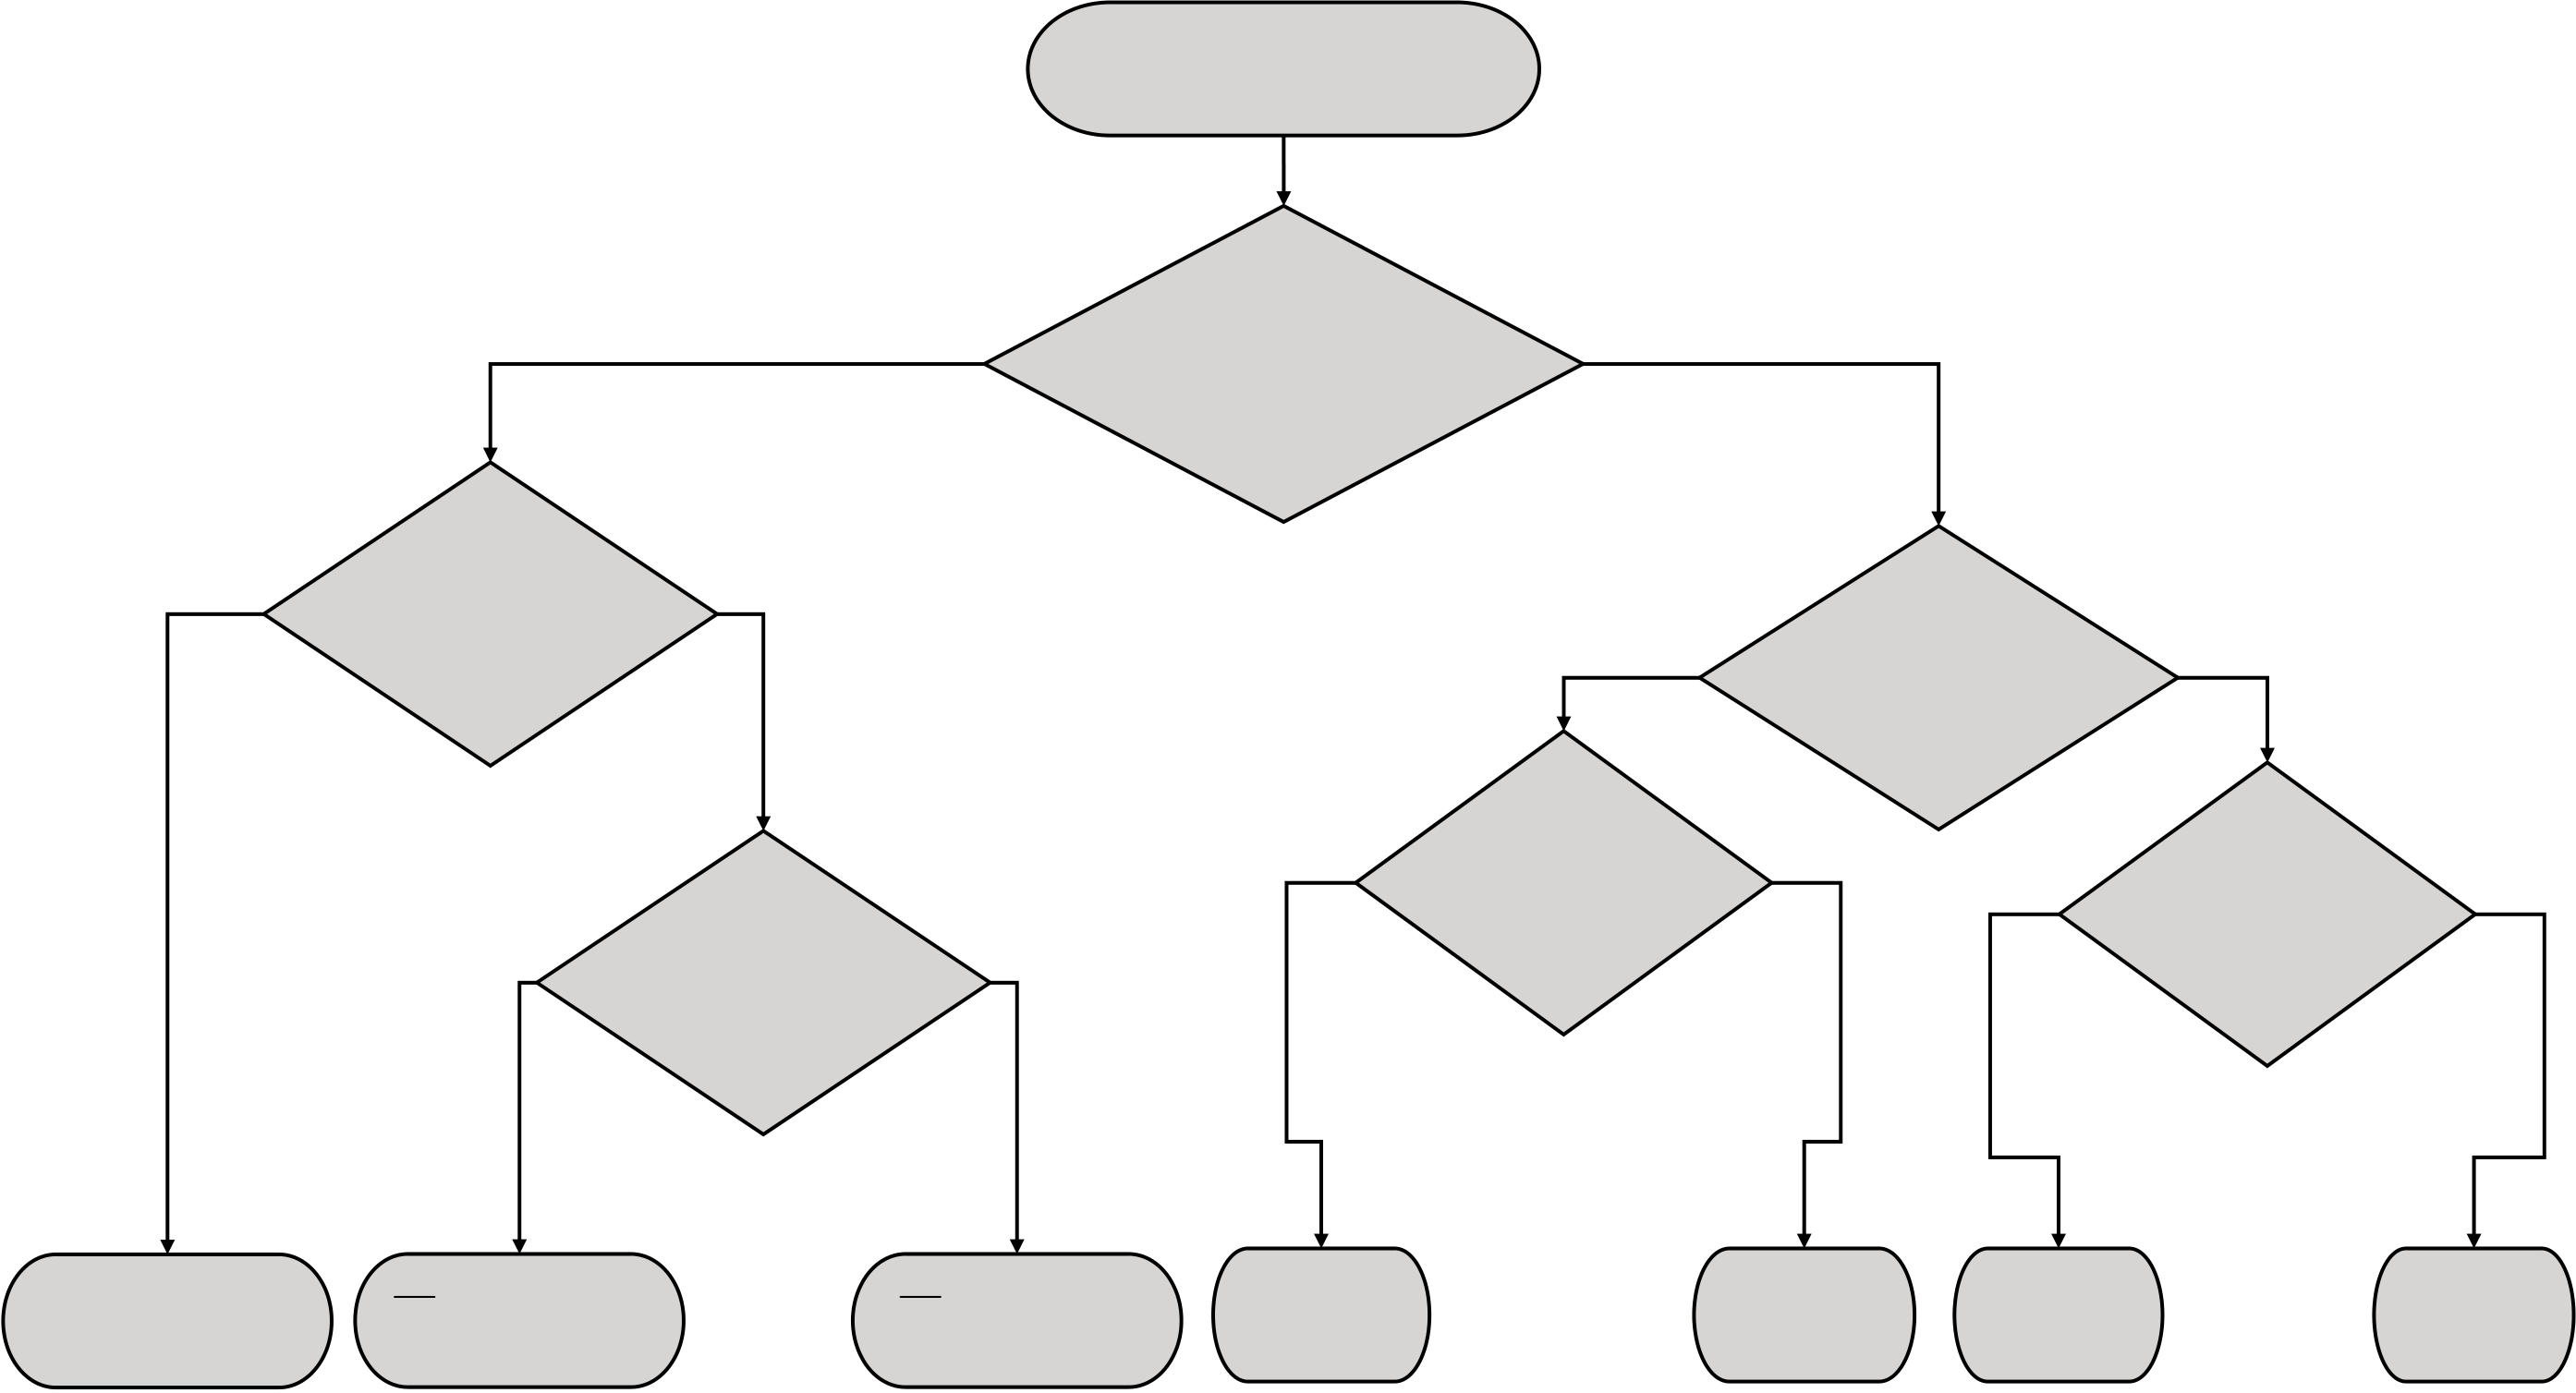
detail in order to determine re-work loops, hand-offs, or individual worker actions
Numbering the steps is a best practice for ease of reference
For each decision step, there should be multiple branches based on multiple types of decisions (i.e.“yes/no” decision branches)
| Value Stream Map – Instructions |
Value Stream Map Symbols
|
 |
||||||||||||||||||||||||||||||||
|---|---|---|---|---|---|---|---|---|---|---|---|---|---|---|---|---|---|---|---|---|---|---|---|---|---|---|---|---|---|---|---|---|---|
| Symbols | Dandelion Wine P-map | Go To A | |||||||||||||||||||||||||||||||
| David Wright | XCCritical Controllable | ||||||||||||||||||||||||||||||||
| Start Date: 03/10/03 | |||||||||||||||||||||||||||||||||
| Update: 04/10/03 |
|
||||||||||||||||||||||||||||||||
| Page 1 |
|
||||||||||||||||||||||||||||||||
| S SOP | Dandelion | ||||||||||||||||||||||||||||||||
| Start | N Noise Have | 4 gal. | Supplies | What | |||||||||||||||||||||||||||||
| recipe | max | bought | |||||||||||||||||||||||||||||||
| Decide on recipe |
|
dandelion | Pick dandelions | part of the | |||||||||||||||||||||||||||||
|
dandelions? | ||||||||||||||||||||||||||||||||
| N Accessibility | XS Crock size | ||||||||||||||||||||||||||||||||
| C Container type | C Recipe call out * Gal. desire |
|
|||||||||||||||||||||||||||||||
|
C # & size of bottles | End | |||||||||||||||||||||||||||||||
| N Internet | N Desired quantity | ||||||||||||||||||||||||||||||||
|
|
||||||||||||||||||||||||||||||||
| N Cook book | Ready for |
|
|||||||||||||||||||||||||||||||
| it bitter | |||||||||||||||||||||||||||||||||
|
|||||||||||||||||||||||||||||||||
| saturation | |||||||||||||||||||||||||||||||||
|
|||||||||||||||||||||||||||||||||
| A | Pick dandelions picked | ingredient & |
|
||||||||||||||||||||||||||||||
| supplies to start | |||||||||||||||||||||||||||||||||
| XS Time of year | How |
|
Trash |
|
|||||||||||||||||||||||||||||
| XS Time of day | |||||||||||||||||||||||||||||||||
| End | |||||||||||||||||||||||||||||||||
| N Rainfall quantity | C Dandelion Head Quantity | ||||||||||||||||||||||||||||||||
| N Buckets | S Recipe | Use 2 ea. 2 gallons | Clean dandelion | ||||||||||||||||||||||||||||||
| much water | |||||||||||||||||||||||||||||||||
| N Location of Dandelions | pans due to pan |
|
|||||||||||||||||||||||||||||||
| should I | |||||||||||||||||||||||||||||||||
| C Location to pick from |
|
size constraints | |||||||||||||||||||||||||||||||
| boil? | |||||||||||||||||||||||||||||||||
| C Dandelion Head Quantity | C Temperature | ||||||||||||||||||||||||||||||||
| C Dandelion Head Quality | |||||||||||||||||||||||||||||||||
| C # of pickers | Hot Saturation | heads & Scraps | |||||||||||||||||||||||||||||||
| C Golf cart | Mixture in bucket | Pick scraps out of | |||||||||||||||||||||||||||||||
| C Pesticides | dandelions and place | ||||||||||||||||||||||||||||||||
| N Time | Cover with towel |
|
into a clean 5 gallon | ||||||||||||||||||||||||||||||
| and let cool | (2 hrs.) | bucket | |||||||||||||||||||||||||||||||
| B | Hot Saturation |
|
XN Cool Time | Mixture in crock | Saturation | ||||||||||||||||||||||||||||
| N Saturation Mixture | |||||||||||||||||||||||||||||||||
| Mixture, dirty | |||||||||||||||||||||||||||||||||
| buckets & pans |
|
|
|||||||||||||||||||||||||||||||
| Pour boiling water | |||||||||||||||||||||||||||||||||
| over dandelion | C Surface of location | Time |
|
||||||||||||||||||||||||||||||
| clean heads | Area & utensils |
|
|||||||||||||||||||||||||||||||
| N Pans |
|
||||||||||||||||||||||||||||||||
| clean & away | |||||||||||||||||||||||||||||||||
| Clean dirty buckets |
|
||||||||||||||||||||||||||||||||
| N Dandelion heads | |||||||||||||||||||||||||||||||||
| & pans & put away | |||||||||||||||||||||||||||||||||
| S Pot holders | |||||||||||||||||||||||||||||||||
| N 5 gallon bucket | N Pans |
|
|||||||||||||||||||||||||||||||
|
|||||||||||||||||||||||||||||||||
| C Location | |||||||||||||||||||||||||||||||||
| N Water | |||||||||||||||||||||||||||||||||
| C Surface of location | S Sink | ||||||||||||||||||||||||||||||||
| N Mixing Spoon | C Temperature of location | ||||||||||||||||||||||||||||||||
| N 5 gallon bucket | |||||||||||||||||||||||||||||||||
| N Soap | |||||||||||||||||||||||||||||||||
In the Measure phase, detailed process maps are a good way to understand the task-level detail within the in-scope
process
Detailed process maps are best applied in situations where the team needs to understand not only the process steps in
| 100.0% |
|---|
Date: 12/1/2006
Instructions
Excel template: Blank XY Matrix.xls
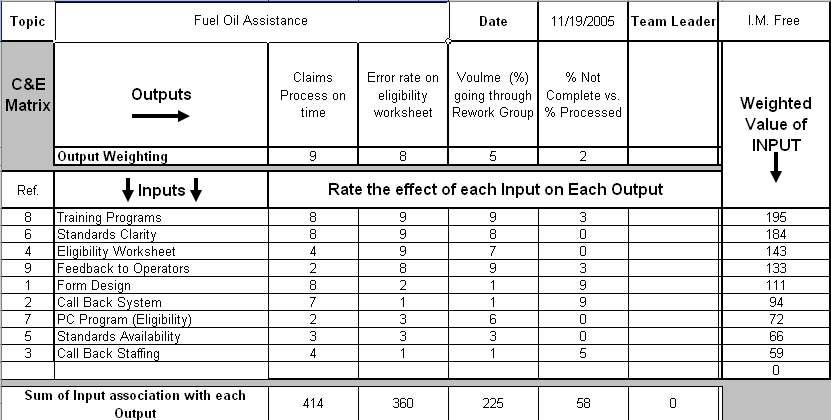
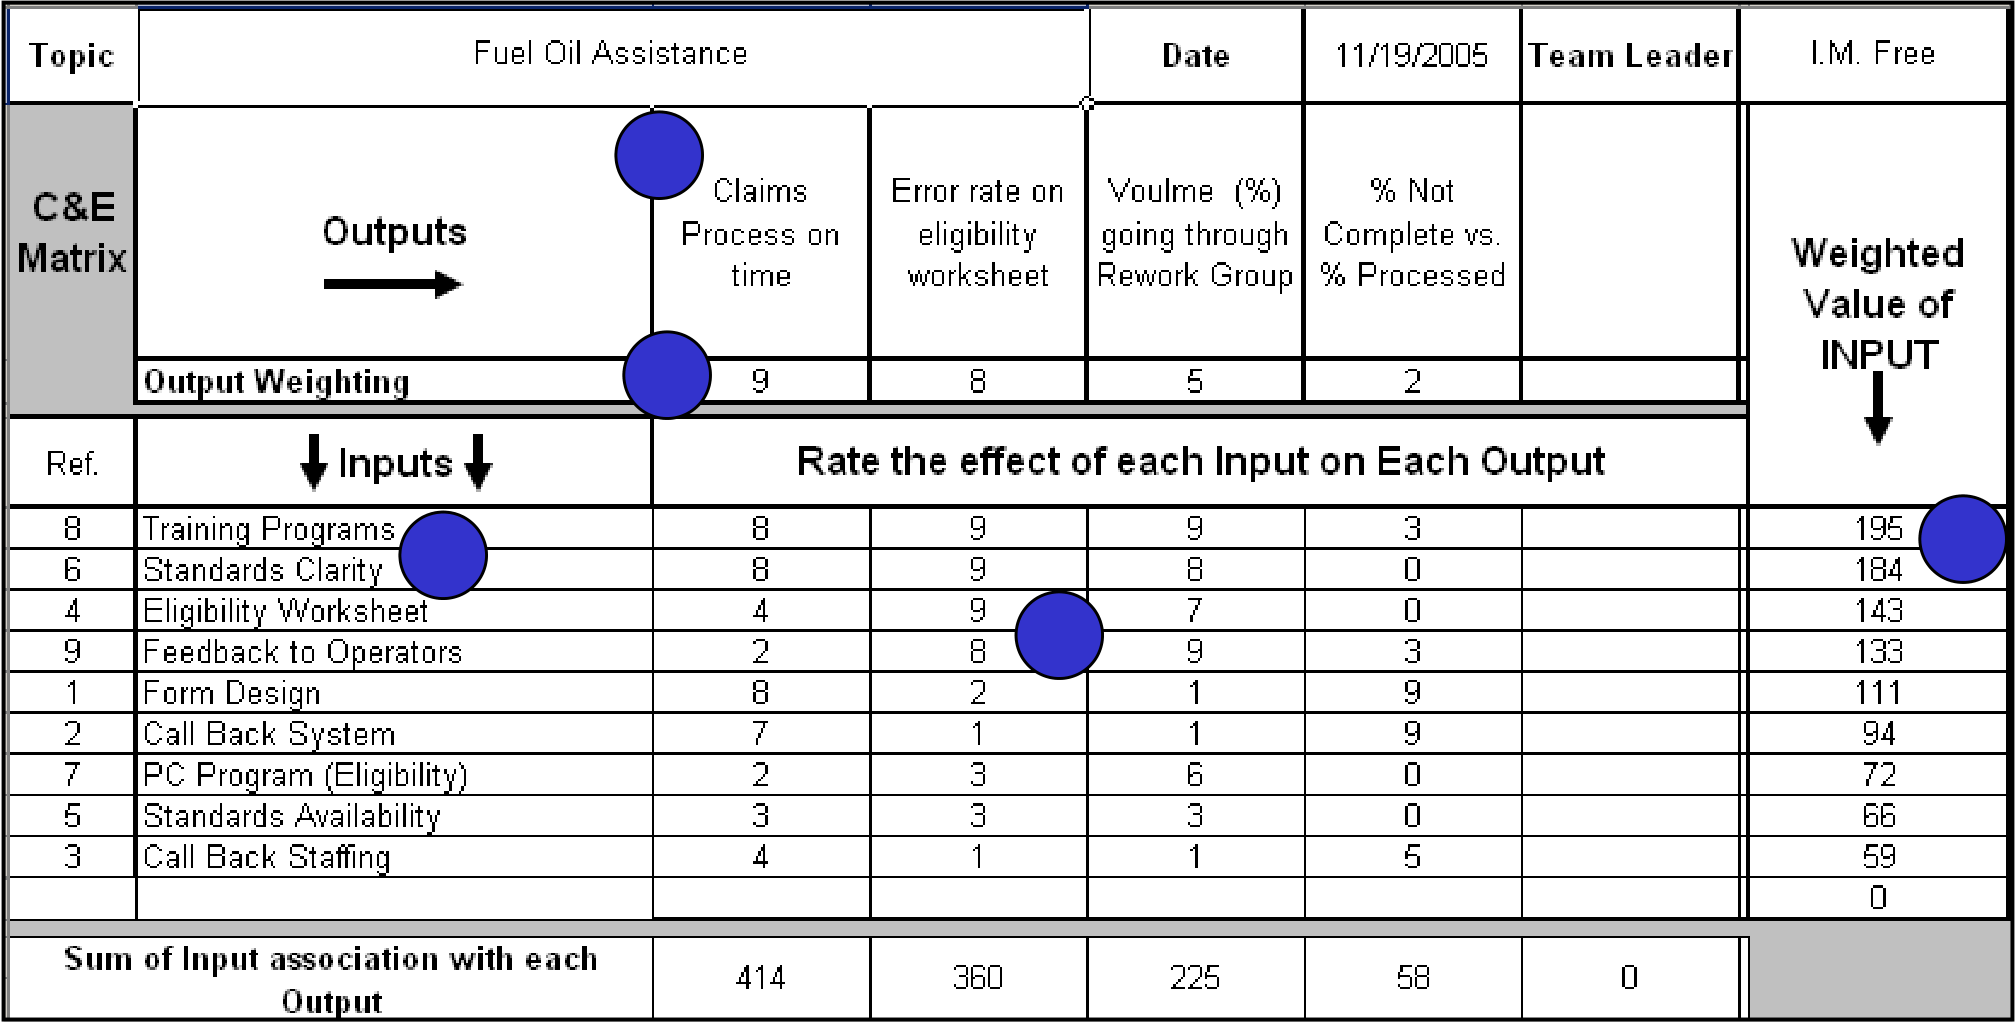
The XY matrix can be used to help identify an area of focus for the FMEA, or it can be used by a project team to identify the initial factors for a designed experiment
When the output variables (Y's) are not to specification, the situation represents potential "EFFECTS“
When each input variable (X) is not to specification, "CAUSES" are present. Steps:
1. Enter, into the Output Variables (Y's) row, those characteristics that the team and /or customer deem important (use the outputs identified on the process map)
2. Then numerically rate each Y from 1 to 10, the most important receiving the highestnumber and so on.Place these numbers in the Output Rating row.
|
||
|---|---|---|
Version 5 |
||
|
|
||
|---|---|---|---|
|
Instructions
| Defect Definition Table | ||
|---|---|---|
| Data Collection Plan Example | ||||||||||||||||
| 1 | 3 |
|
4 | Segmentation | 5 |
|
6 | 7 | 8 | |||||||
| Measure | Data Type | |||||||||||||||
|
|
By installation, day | Work order | |||||||||||||
|
processed according to DOD | of week, and work | members | starting 12/1/06 |
|
|||||||||||
| regulations (5 defect opportunities | ||||||||||||||||
|
||||||||||||||||
|
||||||||||||||||
| Work order | Continuous | All team | Work order | |||||||||||||
|
process a work order from time/date |
|
members | starting 12/1/06 | ||||||||||||
| stamp of initial call to resolution | population) | |||||||||||||||
| noted in the work order system |
|
|||||||||||||||
Instructions
|
|
|---|
|
||
|---|---|---|
 |
|||||||||||||||||||||||||||
|---|---|---|---|---|---|---|---|---|---|---|---|---|---|---|---|---|---|---|---|---|---|---|---|---|---|---|---|
|
|||||||||||||||||||||||||||
| (Continuous Data) | |||||||||||||||||||||||||||
| Continuous Data: Sample Size and Error Calculator |
|
||||||||||||||||||||||||||
| Data | Za/2= 2.575 |
|
|
||||||||||||||||||||||||
| Min @ 99% is: | Average | Max @ 99% is: | 102 | 15 | |||||||||||||||||||||||
| 5.5 | 8.8 | 12.2 | 4 |
|
4 | ||||||||||||||||||||||
|
|||||||||||||||||||||||||||
| 2 | |||||||||||||||||||||||||||
| Za/2= 1.96 |
|
||||||||||||||||||||||||||
| Min @ 95% is: | Average | Max @ 95% is: | |||||||||||||||||||||||||
| 6.0 | 8.8 | 11.7 | |||||||||||||||||||||||||
|
Za/2= 1.645 |
|
|||||||||||||||||||||||||
| Za/2= 1.285 |
|
||||||||||||||||||||||||||
| Instructions | |||||||||||||||||||||||||||
Excel template: Continuous Sampling.xls
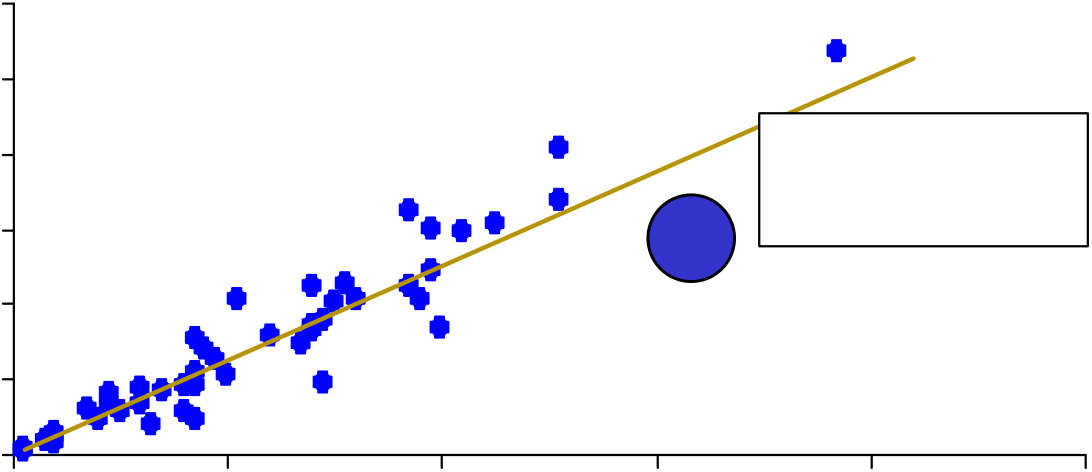
The purpose of the calculating sample sizes is to make valid inferences about a population without having to measure all data points in the population
Continuous data has a unique means for calculating sample size based on the existing variation in the data
Steps:
1. Collect an initial sample size (approximately 30 data points) to calculate a sample standard deviation
2. Calculate confidence interval based on the desired level of confidence: 99%, 95%, 90%, or 80% (the tool calculates this automatically)
3. Determine your desired error (e.g. +/- 2 minutes) or enter in the number of samples you plan on taking
4. The tool will calculate your required sample size based on confidence and error, or it will calculate your error based on confidence and your planned sample size
31 of 37 3211544RMAY07
Population” sample size output
32 of 37 3211544RMAY07
|
|||||
|---|---|---|---|---|---|
| Attribute Gage R & R Effectiveness |
|
||||
| DATE: | |||||
| NAME: Ft. Campbell MWR | |||||
|
|||||||||||||||||||||||||||||||||||||||||||||||||||||||||||||||||||||||||||||||||||||||||||||||||||||||||||||||||||||||||||||||||||||||||||||||||||||||||||||||||||||||||||||||||||||||
|---|---|---|---|---|---|---|---|---|---|---|---|---|---|---|---|---|---|---|---|---|---|---|---|---|---|---|---|---|---|---|---|---|---|---|---|---|---|---|---|---|---|---|---|---|---|---|---|---|---|---|---|---|---|---|---|---|---|---|---|---|---|---|---|---|---|---|---|---|---|---|---|---|---|---|---|---|---|---|---|---|---|---|---|---|---|---|---|---|---|---|---|---|---|---|---|---|---|---|---|---|---|---|---|---|---|---|---|---|---|---|---|---|---|---|---|---|---|---|---|---|---|---|---|---|---|---|---|---|---|---|---|---|---|---|---|---|---|---|---|---|---|---|---|---|---|---|---|---|---|---|---|---|---|---|---|---|---|---|---|---|---|---|---|---|---|---|---|---|---|---|---|---|---|---|---|---|---|---|---|---|---|---|---|
| Attribute Legend5(used in computations) | |||||||||||||||||||||||||||||||||||||||||||||||||||||||||||||||||||||||||||||||||||||||||||||||||||||||||||||||||||||||||||||||||||||||||||||||||||||||||||||||||||||||||||||||||||||||
| 1 pass | PROCESS: Budgeting | All operators | |||||||||||||||||||||||||||||||||||||||||||||||||||||||||||||||||||||||||||||||||||||||||||||||||||||||||||||||||||||||||||||||||||||||||||||||||||||||||||||||||||||||||||||||||||||
| agree within and |
|
||||||||||||||||||||||||||||||||||||||||||||||||||||||||||||||||||||||||||||||||||||||||||||||||||||||||||||||||||||||||||||||||||||||||||||||||||||||||||||||||||||||||||||||||||||||
| between each |
|
||||||||||||||||||||||||||||||||||||||||||||||||||||||||||||||||||||||||||||||||||||||||||||||||||||||||||||||||||||||||||||||||||||||||||||||||||||||||||||||||||||||||||||||||||||||
| Other | |||||||||||||||||||||||||||||||||||||||||||||||||||||||||||||||||||||||||||||||||||||||||||||||||||||||||||||||||||||||||||||||||||||||||||||||||||||||||||||||||||||||||||||||||||||||
|
|||||||||||||||||||||||||||||||||||||||||||||||||||||||||||||||||||||||||||||||||||||||||||||||||||||||||||||||||||||||||||||||||||||||||||||||||||||||||||||||||||||||||||||||||||||||
| | |||||||||||||||||||||||||||||||||||||||||||||||||||||||||||||||||||||||||||||||||||||||||||||||||||||||||||||||||||||||||||||||||||||||||||||||||||||||||||||||||||||||||||||||||||||||
| |
|
||||||||||||||||||||||||||||||||||||||||||||||||||||||||||||||||||||||||||||||||||||||||||||||||||||||||||||||||||||||||||||||||||||||||||||||||||||||||||||||||||||||||||||||||||||||
|
|||||||||||||||||||||||||||||||||||||||||||||||||||||||||||||||||||||||||||||||||||||||||||||||||||||||||||||||||||||||||||||||||||||||||||||||||||||||||||||||||||||||||||||||||||||||
|
||
|---|---|---|
| Control Charts – Roadmap |
?

| | |||
|---|---|---|---|
| Instructions | |||
|
|||
| |
|
||
| | |||
| | |||
| |
|
||
|
|||
| | Average and Range (X Bar and R): Used for data sets with relatively small sample sizes | ||
|
 |
||||||||||||||||||||
|---|---|---|---|---|---|---|---|---|---|---|---|---|---|---|---|---|---|---|---|---|---|
| Upper Specification Limit (USL)= | 100 |
|
|||||||||||||||||||
|
80 | ||||||||||||||||||||
| 1 sigma (s) = | 7.8 | ||||||||||||||||||||
| n= |
|
||||||||||||||||||||
| 2 | Cp = | 0.43 |
|
||||||||||||||||||
| 1000 | |||||||||||||||||||||
| C | p | | USL | | s | ||||||||||||||||
| 1 | D= | ||||||||||||||||||||
| 25 | |||||||||||||||||||||
| O= | 4 | 6 | |||||||||||||||||||
|
|
100 |
|
||||||||||||||||||
| 80 |
|
||||||||||||||||||||
| Mean ( x ) = x | 83 |
|
|||||||||||||||||||
| 1 sigma (s) = | 7.8 | ||||||||||||||||||||
| Instructions | 3 | 0.73 | Cpk | 3 s |
x | or | x | |
|
||||||||||||
| 0.13 | |||||||||||||||||||||
| 0.13 | |||||||||||||||||||||
| | |||||||||||||||||||||
| |
|
||||||||||||||||||||

and the existing variation of the process compared to process specifications
Tools:
1. Process Sigma – identify the number of units sampled from the process, the total number of defects, and the total number of defect opportunities per unit. The calculation output, Process Sigma, is a measure of the short term ability of the process to meet customer requirements (6 Sigma = 99.9997% defect-free)
Cp – specify the upper and lower customer specification limit (in some cases the lower specification limit may be 0), and identify the standard 2.
Process Capability Baseline - Summary
| DPMO |
|
Cp | Cpk | |||||
|---|---|---|---|---|---|---|---|---|
|
||||||||
Version 5 |
|||||||||||||
|---|---|---|---|---|---|---|---|---|---|---|---|---|---|
| x |
|
||||||||||||
| Measure phase as you now have more information on the process | Project Benefits |
|
Reduce DOIM Help Desk Cycle Time | ||||||||||
| All values based on 12 months of savings starting | 12/1/2006 | ||||||||||||
| Cost of Services | Benefits |
|
|
10,000 | |||||||||
| Material reduction |
|
||||||||||||
|
200,000 | 20,000 | |||||||||||
|
|||||||||||||
|
30,000 | ||||||||||||
|
|
||||||||||||
|
|||||||||||||
|
|||||||||||||
|
|
||||||||||||
| Scrap reduction | |||||||||||||
| 120,000 | |||||||||||||
| Warranty cost reduction | |||||||||||||
|
|||||||||||||
|
|||||||||||||
|
|||||||||||||
|
|||||||||||||
| 7. Project Costs – costs incurred as a result of the solution | |||||||||||||
| 320,000 | |||||||||||||
|
|
||||||||||||
| Total One Time Savings | 0 | ||||||||||||

39 of 37 3211544RMAY07
| 40 of 37 | 3211544RMAY07 |
|---|
| 42 of 37 | 3211544RMAY07 |
|---|


Green Belt Practitioners Toolkit
A B C D E F G H
Q1. Why did ProblemE happen? Local focus Because of S.
on causes.
Q4. Why did U happen? Wider focus Because of V.
Purpose: 5 Whys is a conversational tool designed to quickly drill down to an actionable cause for
a specific problem
If you reach a cause that is beyond your team’s ability to address, stop and pass that information
along to your project champion for action
2. Label each major "bone" of the "fish“ with one of the categories to
|
1 |
|---|
|
||
|---|---|---|
|
||
|---|---|---|
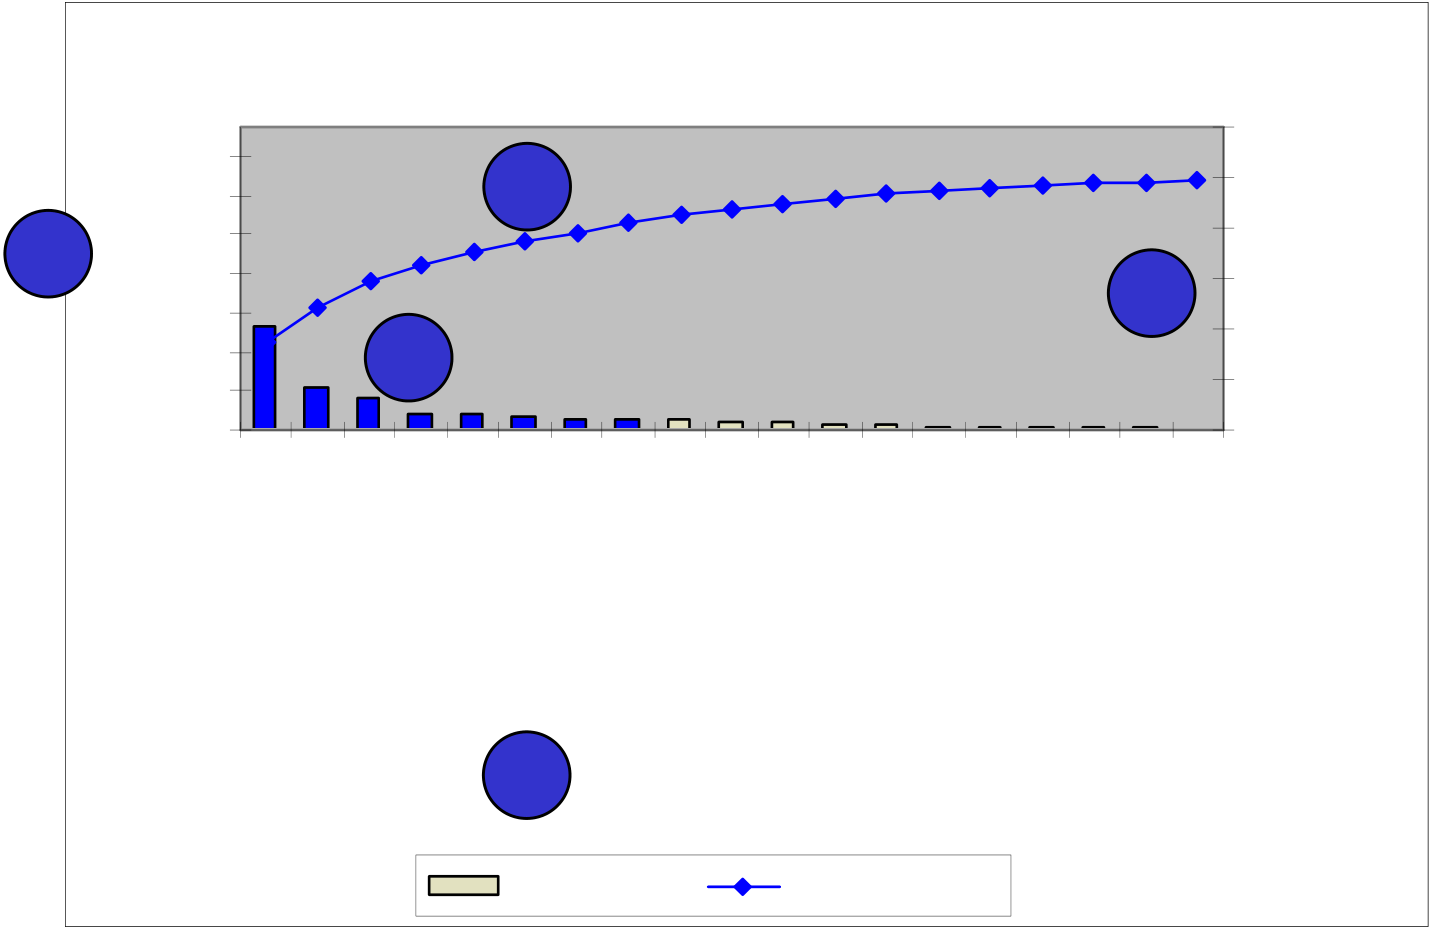
| Graphical Analysis – Instructions |
ordered categories is plotted above the category bar,
and the percent scale is on the right axis.
Version 5 |
||
|---|---|---|

|
1 |
|
|---|---|---|
48 of 37 3211544RMAY07


|
||
|---|---|---|
1
2
customer we need to collect in support of the project
Steps:
5. Multiply these impact ratings times the weighting and sum to obtain a value of the overall importance of each input (the Excel tool does this
automatically)
|
2 Sample |
|
Independent | Dependent | Independent | |
|---|---|---|---|---|---|---|
| Mann- |
|
|||||
| Wilcoxon/ | Kruskal- | |||||
| Test | Test | Test | Whitney U | Sign (Paired | Wallis H |
|
| (t-test | t-test | /Mood’s | ANOVA | |||
| analog) | analog) | Median | ||||
| Test | measure | |||||
| (One-way | ANOVA) |
|
||||||||||||||||||
|---|---|---|---|---|---|---|---|---|---|---|---|---|---|---|---|---|---|---|
Version 5 |
||||||||||||||||||
| Statistical Tools – Hypothesis Tests | ||||||||||||||||||
| General Instructions | ||||||||||||||||||
|
||||||||||||||||||
| 53 of 37 | 3211544RMAY07 |
|---|
| List of Significant X’s (Causes) – Instructions |
|---|
Failure Mode Effects Analysis (FMEA) – |
||||||||||||||
|---|---|---|---|---|---|---|---|---|---|---|---|---|---|---|
 |
Timing |
|||||||||||||
| Instructions | ||||||||||||||
| FMEA Example | ||||||||||||||
| Process Step | Failure Mode | Failure Effects | Causes | Controls | Resp | |||||||||
|
||||||||||||||
| May be process step, general | What is the potential failure or | If the failure mode occurs, what | S | What is/are the cause/s of the | O | What controls are in place to prevent the | D | R | What specific actions are required to improve |
|
||||
| activity, functional area, or | undesirable outcome for this | E | C | cause from occuring or to detect that the | E | P | ||||||||
| will the effect be? | failure? | the RPN number | ||||||||||||
| other rational grouping | area? | V | C | cause has occurred? | T | N | ||||||||
| 1 | 2 | 3 | 6 | 7 | 8 | 10 | 11 | |||||||
| | ||
|---|---|---|
| 1. | ||
| 2. |
|
output.
11. Responsible/ Timing: Each action should have a team member assigned as responsible for completion and a suspense date.
55 of 37 3211544RMAY07
| 56 of 37 | 3211544RMAY07 |
|---|
| 58 of 37 | 3211544RMAY07 |
|---|
| Sum of Positives | 0 | 6 | 2 | 3 | 2 |
|---|
| Sum of Negatives | 0 | 2 | 5 | 4 | 5 | 0 | 4 |
|---|---|---|---|---|---|---|---|
| Sum of Sames | 10 | 2 | 3 | 3 | 3 | 0 | |
| Weighted sum of Positives | 0 | 12 | 5 | 5 | 10 | 0 | |
| Weighted sum of Negatives | 0 | -5 | -5 | -9 | -7 | 0 | |
| Total Weighted Score | 0 | 7 | 0 | -4 | 3 | 0 | |
|
 |
|||||||
|---|---|---|---|---|---|---|---|---|
| Solution Selection Matrix | ||||||||
| 1 |
|
Impact Rating |
|
|||||
| Root Cause Significance Rating | ||||||||
| ? | ||||||||
| Potential Improvements ? | ||||||||
| 1 | 4 | |||||||
| 2 | ||||||||
4
5
4. Using a defined 1-10 scale in the spreadsheet, rate each potential improvement to each root cause. Next, rate each potential improvement for business or other risk and for implementation cost. The spreadsheet will make all calculations and rank each potential improvement, with the best choice having a rank of 1.
60 of 37 3211544RMAY07
|
||||||||||||
|---|---|---|---|---|---|---|---|---|---|---|---|---|
| Instructions |
|
|||||||||||
| Project Benefits | x |
|
||||||||||
|
||||||||||||
| Benefits | 200,000 | |||||||||||
|
||||||||||||
|
||||||||||||
| 10,000 | ||||||||||||
| 3 |
|
|||||||||||
|
||||||||||||
| 20,000 | ||||||||||||
|
|
Total Project Costs | 30,000 | |||||||||
| Net Annualized Savings | 290,000 | |||||||||||
| Soft Savings (description and quantification): | ||||||||||||
|
||||||||||||
|
||||||||||||
| estimate improvement of 50% on wait time. | ||||||||||||
|
5 |
|
||||||||||
|
||||||||||||
|
||||||||||||
|
||||||||||||
|
||||||||||||
| 6 |
|
|||||||||||
| 7. Project Costs – costs incurred as a result of the solution | ||||||||||||
|
Total One Time Savings | 0 | ||||||||||
|
||||||||||||
| Examples of When to Use | Benefits | Common Pitfalls | Potential Tools* |
|---|---|---|---|
|
|
|
* For additional information reference Green Belt LSS training materials and websites noted within this toolkit
| Kaizen Event |
|---|
64 of 37 3211544RMAY07
|
||
|---|---|---|
| Improve Phase Gate Checklist | ||
 |
||
|---|---|---|
Control Phase
66 of 37 3211544RMAY07
| Control Deliverables | ||
|---|---|---|
Version 5 |
||
|---|---|---|
| Control Charts – Roadmap |
Select Measurement
68 of 37 3211544RMAY07
|
||
|---|---|---|
further action as appropriate. Instructions
6. Target Value: List the target value for the X or Y being measured.
7. Upper Control Limit: List the Upper Control Limit for the X or Y being measured.
|
|||
|---|---|---|---|
|
|||
|
|||||
|
|||||
| STRATEGY | | Garrison Leadership and Management – LSS Champions and / or Leadership who may be involved or impacted by LSS projects | |||
|
|||||
| | |||||
| | |||||
| | |||||
| | Educate on project team resource roles, solicitation process, participation criteria, participation commitment and application | ||||
|
|||||
| |
|
||||
| | |||||
| | Garrision Key Staff - Staff that may at some point apply for an LSS position, or serve as a SME and / or project team member for | ||||
| | |||||
| | Educate on project team resource roles, solicitation process, participation criteria, participation commitment and application | ||||
| |
|
||||
| | Garrison General staff – Staff who has heard about the LSS organization, but is unlikely to work directly on a project | ||||
| |
|
||||
| | |||||
| | Other Garrison Sr. Management - General FYI messages and positive PR | ||||
| | |||||
| | |||||
| | Other MACOMs – General FYI messages and positive PR | ||||
| | |||||
| |
|
||||
|
AUDIENCE | | Garrison Leadership and Management – LSS Champions and / or Leadership who may be involved or impacted by LSS projects | ||
| | Garrison Key Staff - Staff that may at some point apply for an LSS position, or serve as a SME and / or project team member for | ||||
| | Garrison General staff – Staff who has heard about the LSS organization, but is unlikely to work directly on a project | ||||
| | Other Garrisoin Sr. Management - General FYI messages and positive PR | ||||
|
|
Risk Mitigation | Target / Actual | ||||||
|---|---|---|---|---|---|---|---|---|---|
|
Current Status/ Comments | ||||||||
|
|||||||||
|
|||||||||
|
Solution | 3 | |||||||
| Issues/Barriers | |||||||||
| Number | Complete Date | ||||||||
|
|
||||||||
| 1 | 2 | ||||||||
| Mistake-proofing opportunity: IS&T | |||||||||
| 1 | Inventory available network drops |
|
Work with HR to ensure | 17 Aug 06 / 24 Aug 06 | In progress. No issues. | ||||
|
|||||||||
| 1 | indicate via color coding active, inactive, | cubicle reassignments or of influx of | IS&T is copied on | ||||||
| Lead | |||||||||
| availability and in use | schedule of new hires | ||||||||
3. Control Action #: List the appropriate control action number if a control has been put in place to ensure the change/action is continued after the implementation.
4. Responsible Individual / Solution Owner: This is the individual that will be held accountable for completing the action item. The person responsible for ensuring the action is completed (if different than the Responsible Individual) should also be listed.
72 of 37 3211544RMAY07
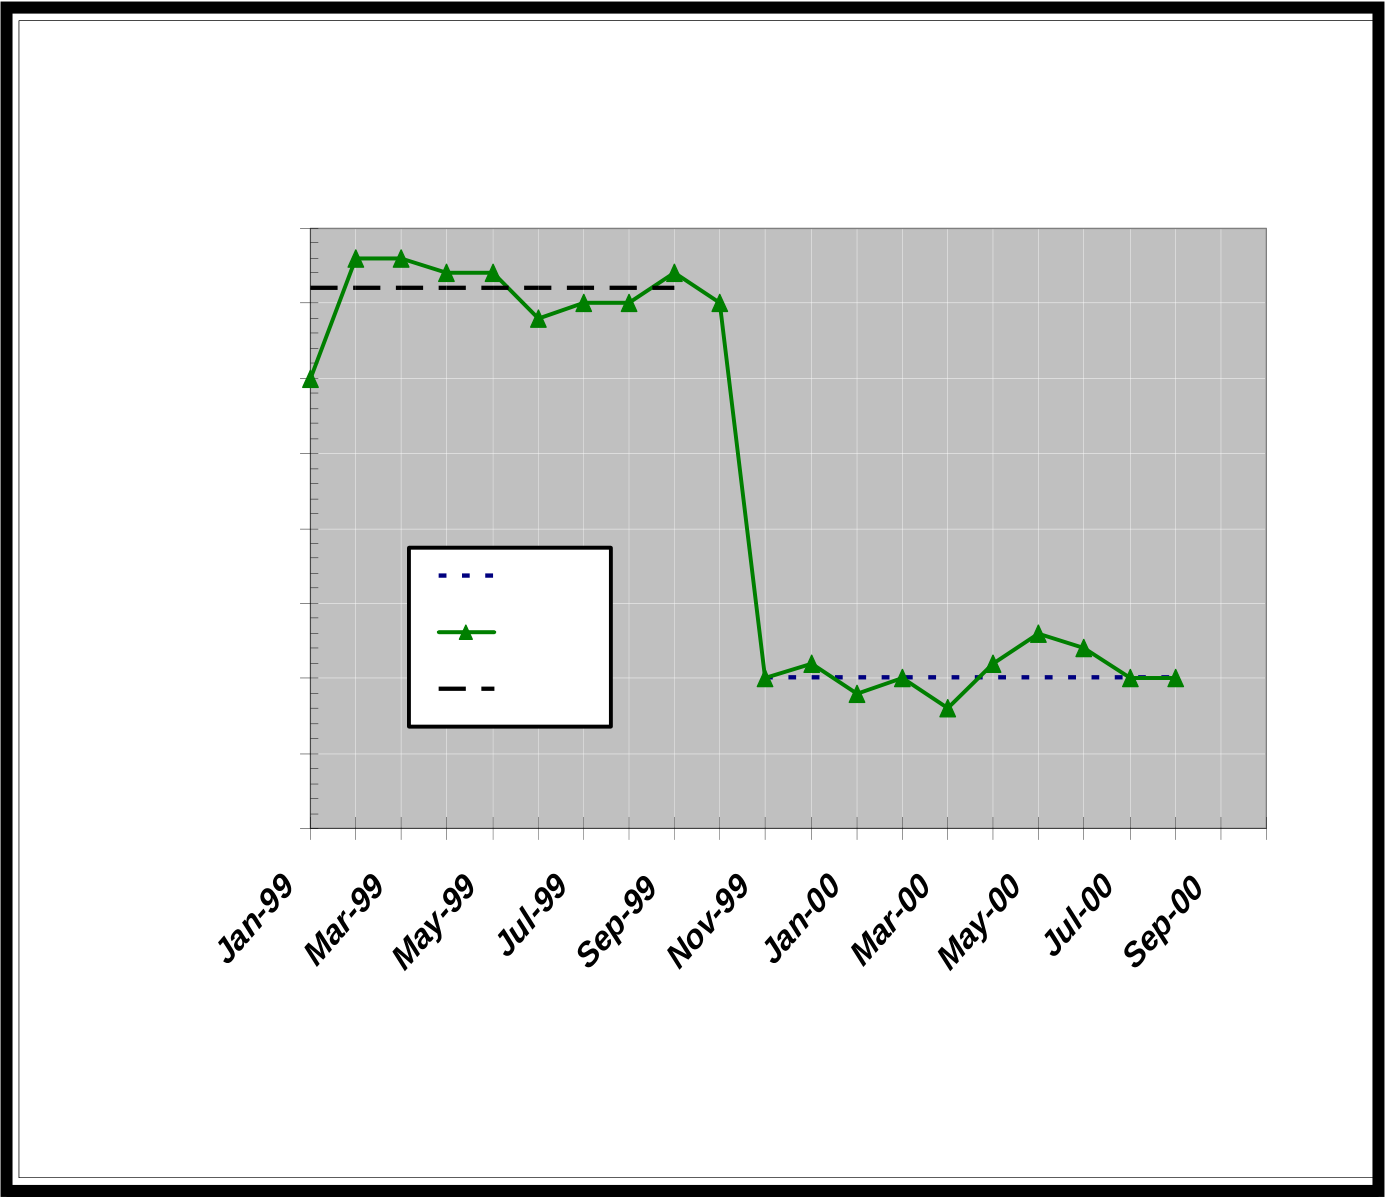
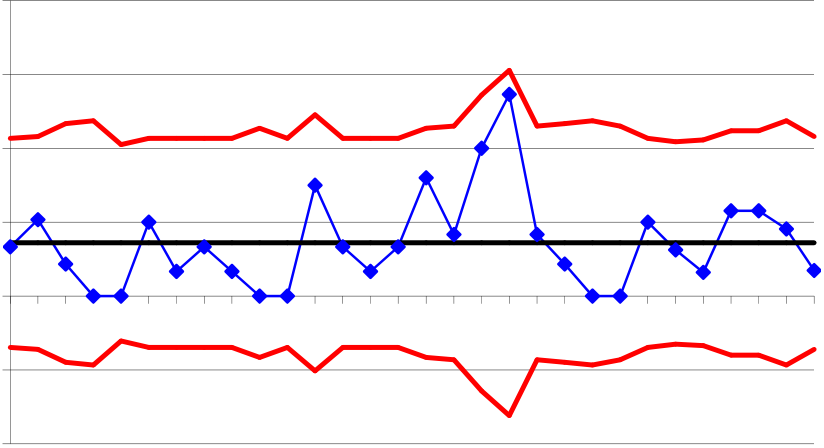
A primary metric chart graphically displays the
|
Target | |||
|---|---|---|---|---|
|
||||
|
||||
| performing as desired, so actions can be taken to | ||||
|
||||
|
||||
| Actual | ||||
|
Baseline | |||
|
5 | |||
| 0 |
document).
73 of 37 3211544RMAY07
| • |
|
|||
| – |
|
|||
| – | ||||
| • | ||||
| – | ||||
| – | ||||
| – |
|
|||
| • |
|
|||
| – | ||||
| – | ||||
| – | ||||
| – | ||||
74 of 37 3211544RMAY07
work)
| • | ||
|---|---|---|
| – | ||
| – | ||
Version 5 |
||
|---|---|---|
| Control Phase Gate Checklist | ||

| Approvals | ||
|---|---|---|
|
Y | |
|
Y | |
| Y | ||
| Y | ||
|
|---|
www.isixsigma.com
• Links to free papers, articles, and case studies on lean principles
www.itl.nist.gov/div898/handbook/index.htm
| “Sustain, Support and Defend” |
|---|