
Note that the mean the sample and the mean the squares the sample
Answer each question in the space provided. You can write in pen or pencil. Marks are
indicated next to each question. The total mark for the exam is 100.
(a) What is the median? 14
(b) What is the 1st quartile? 9.75
upper and lower hinges at Q3 and Q1, median at 14, upper and lower whiskers at 3 and 34,
one outlier at 60
16.776
(g) If you only knew the mean and sample standard deviation of the sample, what does
| Page 4 of 45 |
|---|
Throughout this question, show your working and leave your answer in a clear from. Of those reporting to a medical clinic, 1% have medical condition Z. It is assumed that this figure of 1% is also the base rate across the population. There is a test for condition Z such that, for those patients who have condition Z, 90% will test positive; and for those patients who do not have condition Z, 20% will test positive.
(a) If a patient tests positive, what is the probability that the patient has condition Z?
| Page 5 of 45 |
|---|
patient has condition Z?
81/477
otherwise
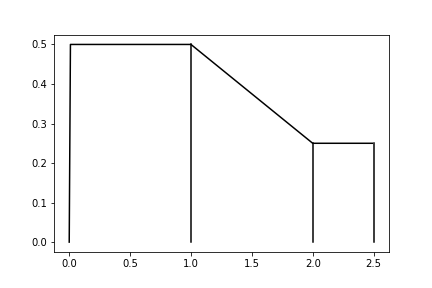
Consider the probability density function given
at the right, defined by
|
|||||
|---|---|---|---|---|---|
| Q(p) = | | : | p ≤ 0.25 0.25 ≤ p ≤ 0.75 p ≥ 0.75 |
||
| 1 + 2(p − 0.25) 2 + 4(p − 0.75) | : | ||||
| : | |||||
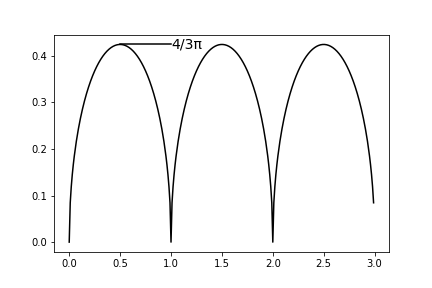
from this distribution.
Use an inverse sampler with Q(p) above.
| Page 8 of 45 |
|---|
18
p(x|ρ, µ1, µ2, σ) = ρN(x|µ1, σ) + (1 − ρ)N(x|µ2, 2σ)
where N(·|·) is the probability density function of a Gaussian given its mean and standard
ρµ1 + (1 − ρ)µ2
(b) Assuming the means are identical, µ1 = µ2, what is the mean of x2for the mixture of
|
|---|
Gaussians?
| Page 11 of 45 |
|---|
You have data x distributed as Poisson with rate λ = 12, so x ∼ Pois(12).
(a) Show how to use the central limit theorem to get an approximate value for p(10 ≤ x ≤
(b) You have a sample of 10 values from this distribution, and compute its mean x. What
is an approximate distribution for x?
| Page 12 of 45 |
|---|
Question B.2 (2+5=7 marks)
While IQ is considered to have a mean of 100 and standard deviation of 15. You expect students in your masters class will have a higher mean.
| Page 13 of 45 |
|---|
Question B.3 (2+2+4+2=10 marks)
X and Y ?
rxy = 0.883
β0 = −2.9242 and β1 = 2.9013?
(d) Test the hypothesis the β1 = 0. What is your test statistic and its p-value? What is the outcome of the test?
test statistic is tα,8 = 5.326, and p-value 0.000706 (all you can tell from tables), so reject the null hypothesis
| Page 15 of 45 |
|---|
A: a 4 degree polynomial
| ˆy = | 20 � |
||
|---|---|---|---|
A has higher bias with 5 versus 21 parameters; generally, A should not give as good a fit to the training data
(b) Describe how the variance of models A and B differ.
| Page 16 of 45 |
|---|
mend? Justify your answer.
by the rule of thumb, with 100 data points, you should fit about 100/10=10 parameters, so
Boolean X. Someone has already counted the data for you to create frequency tables below:
|
|||||
|---|---|---|---|---|---|
| X=0 |
|
||||
| X=1 |
|
First p(X=0) = p(X=1) = 0.5. Then the tables for p(A|X), p(B|X) and p(C|X) respectively
are created by normalising the above tables along the rows. Then give the unnormalised
| Page 18 of 45 |
|---|
Its not really clear, since they have the same bias. But at a pinch since there is so few data,
perhaps the NBC works better because it can be more robust with little data.
Many solutions. Pick a random point as first centroid. For the next k − 1 centroids: select 10 random points and select the point furtherest away from the current batch of centroids.
| Page 20 of 45 |
|---|
HINT: no integrals need to be calculated.
|
|||
|---|---|---|---|
| X=0 |
|
||
| X=1 | |||
| X=2 |
|
B is the best attribute. Don’t need to get (a) right to see this.