
Picture the final von mises stress distribution
|
||||
|---|---|---|---|---|
|
|
|||
|
|---|
Page 1 of 5
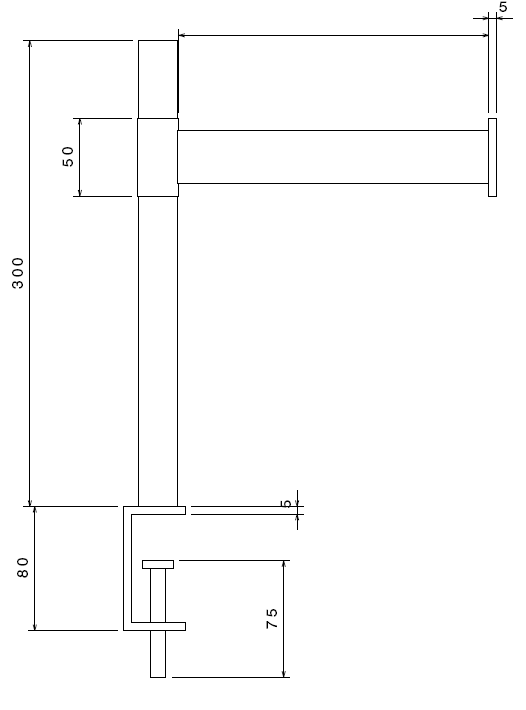
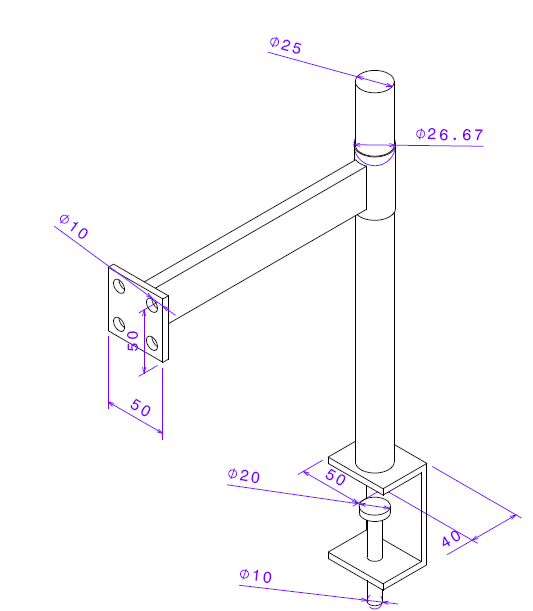
Figure 1 shows the CATIA 3D CAD model of the loaded component to be
studied which can be seen below:
200
AIMS
To reinforce the structure, so that:
1. The maximum displacement measured at any point is smaller than 2 mm
with maximum load of 50kg on the monitor holding plate.
2. The Von Mises Stress is below the tensile strength,
3. The weight is as little as possible (ideally, the weight should be
reduced).
Presentation is a very important aspect of your report, mostly because of clarity. Use page numbers, headings, figure/table captions and numbers (and always refer to them in the text), etc.
Above all, the report should look like a proper professional technical document.
Check mesh convergence with a few (minimum of 5) simulations by changing mesh •
sizeand/or sag size, adding fillets, etc. Using Excel, you should show:
Page 4 of 5
NB: If the only change made is in the thickness without any other visible effort, your model will be marked with zero marks.
Marking Scheme (out of 100)