
Power loss ofruid yuqian zhang mae mech
To determine the performance of a small industrial power generator, the Rankine cycle is evaluated. The purpose of this laboratory is to adequately explain to students the functions and concepts of an industrial steam facility. In an open Rankine experimental cycle setup, the engine is run to collect data based on speed, torque, and power, including the temperatures, pressures, and condensate flows at each point of the cycle. A Willans line is used to determine power loss of the cycle. Possible sources of error are attributed to failure in controlling aspects such as torque or rpm as the engine is running. However, the specific steam consumption curve, as well as boiler efficiency turned out to be similar to theoretical predictions, allowing the students to obtain a basic understanding of a real world Rankine cycle in steam plants.
INTRODUCTION
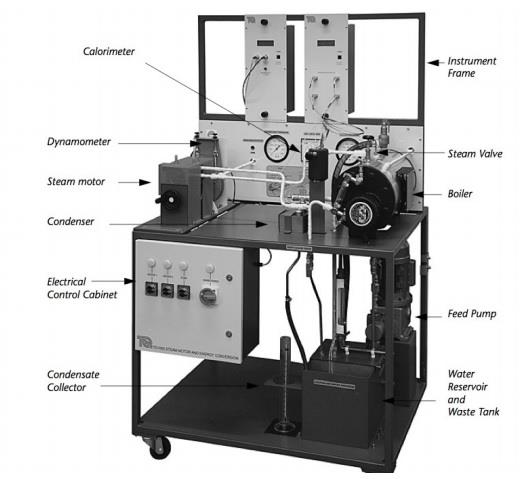
Figure 2. Experimental Steam Engine Setup
Q1: heat flow rate into the boiler Q2: heat
loss rate from the boiler Q3: heat flow rate from the engine Q4: heat loss rate from the condenser Q5: transferred heat to the cooling water hw: enthalpy of water, with subscript w being for water
h3: enthalpy of condensate leaving condenser

Figure 3. Control Surface Analysis of the Energy Balance in the Steam Engine
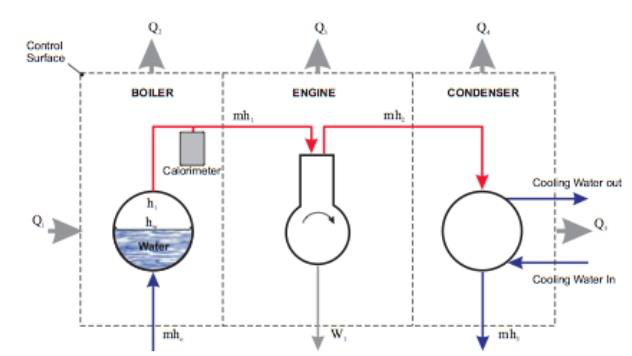
𝑚ℎ2 = 𝑄4 + 𝑄5 + 𝑚ℎ3
These control surfaces are accurately depicted in Figure 3. The thermal efficiency, 𝜂𝑡ℎ, is represented by the power out (work from the engine), over the electrical power in (heat flow into the boiler), plus the mass flow rate and then multiplied by both the enthalpy of the water and of the condensate, as shown in the equation below.
RESULTS AND DISCUSSION
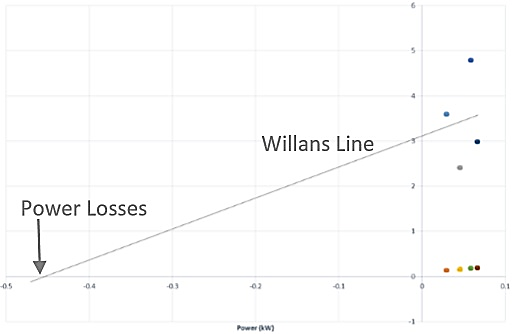
A Willans line is formulated through experimental data from four trials using experimental condensate flow values versus power, as depicted in Figure 4. There seems to be significantly large power loss as seen from the graph. Theoretically, power loss of
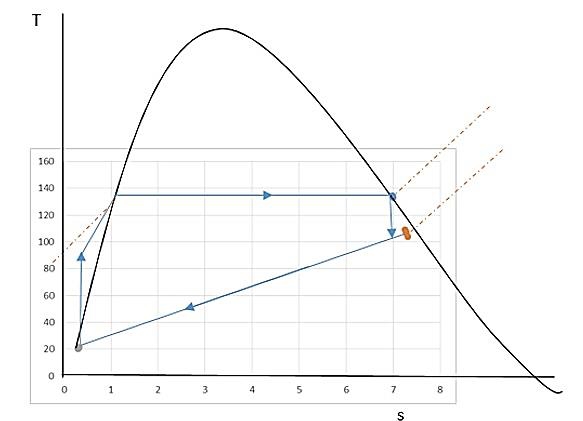
A T-S diagram is shown in Figure 6, graphing the temperature against entropy of the water at various states in the experimental engine cycle.
All the data acquired in this lab is listed in Table 1. Entropies and enthalpies are gathered and interpolated from the thermodynamic tables in Appendix B of Fundamentals of Thermodynamics, 8th edition. The work done by the engine, electrical power input to the boiler, heat rate loss from the boiler, motor, and condenser, as well as the heat transferred to the cooling water in the condenser is listed in Table 2. The third, fourth and fifth equations in this report are used to find Qs of each component of the engine. The thermal and steam engine efficiencies are also calculated using the sixth and seventh equations and the values in both tables.
|
|---|
MAE 650:431 Mech. Eng. Laboratory
The thermal efficiency should be in the 2-3% range as opposed to the 30-40% seen in the experimental trials. The percentage obtained in this lab is impossible for the Rankine cycle, comparing it to the perfect Carnot cycle which runs at a maximum of 50% efficiency. With the running engine not controlled or monitored properly, the resultant thermal efficiencies are what led to scattered data on the graphs.
Boiler, or engine efficiencies calculated do follow the theoretical values. To enhance the cycle and improve its efficiency, certain concepts such as superheating and reheating of the Rankine cycle may fix the efficiency values.
Table 3
By increasing the average temperature at which heat it added, and lowering the temperature at which heat is rejects, the cycle is transformed into more of a Carnot cycle, which has the highest efficiencies. We can also conclude that by increasing the pressure of the boiler, which would increase the temperature where heat is added, or lowering the pressure of the condenser, which would lower the temperature at which heat is rejected, there would be an overall increase the efficiency of the cycle.
MAE 650:431 Mech. Eng. Laboratory REFERENCES
July 6, 2017
|
|---|