
Press the start test menu item the top the screen
3. Before beginning a test or moving/resetting the Instron Testing Machine, all items including hands, hair, etc. should be clear of machine.
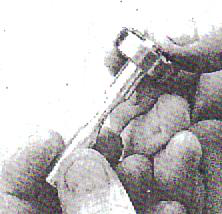
4. The extensometer should be handled with care. It is a fragile, and expensive (~$3,000) piece of equipment.
2. BACKGROUND
Material selection is a central task of the overall design process. Engineers must decide which materials are the most appropriate for a particular design. Physical properties such as thermal, magnetic, electrical, optical, acoustical, and mechanical properties such as tensile behavior, toughness, ductility, hardness, along with cost, availability and durability are the most common selection criteria used in design of mechanical systems.
uniaxial test, i.e.
| E | = | σaxial | |||
|---|---|---|---|---|---|
| The Poisson’s ratio relates the lateral strain, |
|
εaxial | |||
| εlateral | , to the axial strain, | ||||
| υ= − | |||||
Most metals exhibit a Poisson’s ratio around 0.3.
The magnitude of these properties is of fundamental importance in the design of mechanical components since they relate the deformation of a material with the magnitude of the applied load.
elongation data are recorded, allowing the determination of the material load stress and strain
characteristics. Stress vs. strain curves for the metals to be tested are shown in Figure 1b. Additional
(b) Examples of engineering stress vs. strain curves for the materials to be tested.
2
The second moment of area for a circular cross-section beam is
| I | = | πD | 4 | |
|---|---|---|---|---|
| x | 64 |
These results combine to give the standard bending equation for the specimen.
3. LABORATORY EQUIPMENT
The most relevant parts of the equipment available in the Materials Testing Laboratory are listed below:
The test will be run at loads of approximately 80 N, 70 N, 60 N, and 50 N in that order.
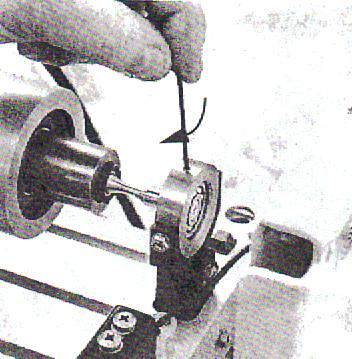
1. Choose a test specimen and check that it is straight and not damaged. You can check this by rolling the specimen along a flat surface.
4
5
12. Gently support the load arm so the load display shows zero and press the motor start button on the Control and Instrumentation Unit.
13. Slowly turn the motor speed up until the cycle rate is 60 Hz.
5. PROCEDURE FOR TENSILE TEST
The steps described below should be followed closely.
Words in square brackets (i.e. [ENTER]) indicate physical buttons on the Instron computer keyboard, or radio buttons on the computer screen (activated by pressing the left mouse button with the cursor placed over the button).
5.2 Initializing the Equipment
6
5.3 Using the Instron Series IX program
1. Select the test specimen and place it in the center of the jaw grips.
The top grip should be tightened first. Make sure the
specimen is tightly secured before proceeding. For the first run, ask
your TA to check for correct placement before proceeding.
2. Add a 5 pound preset to remove the slack from the sample by pressing the up arrow (not the up jog) on the Instron followed quickly by [STOP].
5. For the load, press [BAL] then [ENTER] to zero the load. Do the same for the strain.
7
Sample ID: your file name.mrd
Operator Name: mae431
The indicator beside Tensile should be selected at the top of the screen
Test Method Description: 31 Tensile Test for Materials Testing Lab (MAE 431) Choose Test Method: 31 Tensile Test for Materials Testing Lab (MAE 431) highlighted Live Displays: checked
Auto Sample ID: unchecked
Change any settings that are incorrect and press [OK]
10. In the file dialog screen that appears automatically (ASCII test data file name), enter the name and folder to store the ASCII data. Under Folders: select the same folder as before c:\mae431\ your section # \ your group letter. Under Filename: enter a file name that will identify your data (an extension of .TXT will automatically be added to the name you set so you can use the same name as before which is the default value). Press [SAVE] after the information is entered.
14. The Instron machine will take out the residual force on the specimen by tightening the gripper and automatically zeroing the extensometer. A message will appear briefly on the screen “Unloading and balancing extensometer. Click <cancel> to stop” Don’t press any buttons.
15. A plot will be shown on the screen as the tensile test progresses.
19. Press [End Sample] on the top menu of options. Press [Continue] on the top menu of options.
20. A report dialog box will appear. Verify the following settings.
22. Press the [IEEE 488] button to restore control to the Instron machine and repeat steps 1 to 21 for the other specimens.
5.4 Before Leaving the Laboratory
1. Press the [Exit] button in the Home Screen and press
[OK] to exit the Series IX program.
-A header section, where all test conditions are recorded and a data section where the information from the test itself is organized in 3 columns. The first column corresponds to the point number, the second to the strain [in/in] (or displacement based on a one inch gauge length), and the third to the applied load [lbf]. Since this is an ASCII file, any text editor can easily edit it. Also, it can be read directly into a spreadsheet program or imported to a graphic program. The data from each specimen is recorded sequentially and separated by horizontal lines.
-A second file with a .RLT extension containing calculated results generated by the Instron program (ultimate stress, maximum strain, yield stress, etc.). It should be noted that the displacement and strain are based on a 2.5 inch gage length so the values may be slightly different from those in the raw data file, which are based on a one-inch gage length from the extensometer. All data is in ASCII format and may be
1. Definitions of the following terms, including a description of how they are calculated from the stress vs. strain data, and what information they provide about the material:
Proportional limit
0.2% conventional yield stress
Ultimate stress
Fracture stress
Elongation to fracture
Young’s modulus
Modulus of resilience
Modulus of toughness
a. Finding Young’s modulus for each material.
b. Identification of the 0.2% conventional yield stress.
numerically integrating the appropriate area under the stress-strain curve. The equations and methodology
utilized to obtain the results should be shown, and the values obtained should be tabulated for each
9. Based on the property values of each specimen describe some possible different uses of each of the materials in the design of mechanical components.
10. Sample calculations for all computed results.
| Aluminum Alloy 2011 T6 | Tensile Strength: 395 MPa | L= 28 mm | ||
|---|---|---|---|---|
| Min. Yield Stress: 220 MPa | D = 4 mm | |||
| Test # | Load | Cycle Rate | Cycle Count | |
| 1 | ||||
| 2 | ||||
| 3 | ||||
| 4 | ||||
| 5 | ||||
 |
|---|