
Rynel Inc. Foam Analysis
Due to the success of the product and increasing ingredient cost, last year an internal project team started focusing on improving the process performance and AI consistency. We believe that the major contributor to the problem is thickness variability. Since our material is a reactive substance there are many factors that contribute and are linked to thickness (ex. Flow Rate, Line Speed, Density, etc.), therefore thickness control has been the main focus of their efforts. We would like your company to analyze our production data to see if we are producing foam with decreased variation over the length of the project and if the system is capable of operating at a 1.33 cPk for the given specification limits.
Process/Data Collection:
Customer Specification Limits:
Thickness: 4.35mm – 5.65mm, Target 5.00mm
Concentration: 2.0% – 2.7%, Target 2.4%
Surface Weight: 400g/M2 – 600g/M2. 500g/M2
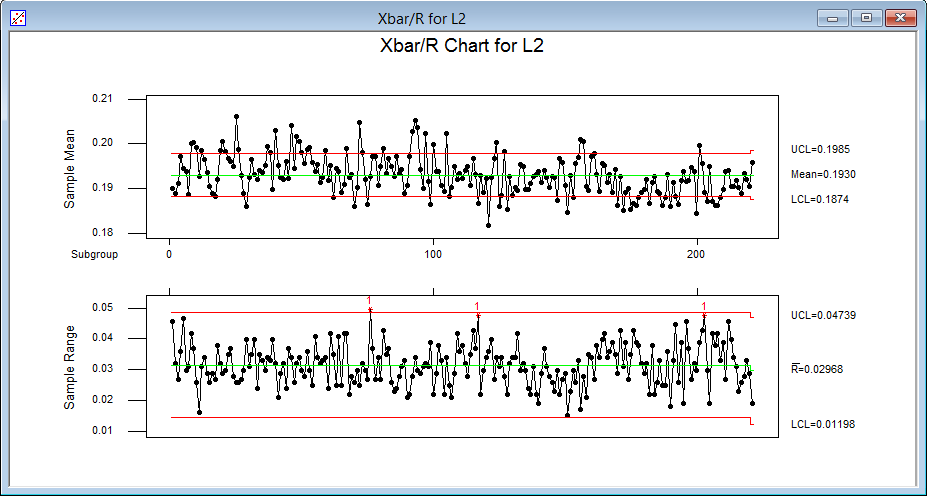
For above x-bar and R control chart, the x-bar control chart shows that the process is in statistical control but for the R control chart, some points are out of control. This means, the R control chart is out of control. This means, overall process is out of control for the variable thickness L2.
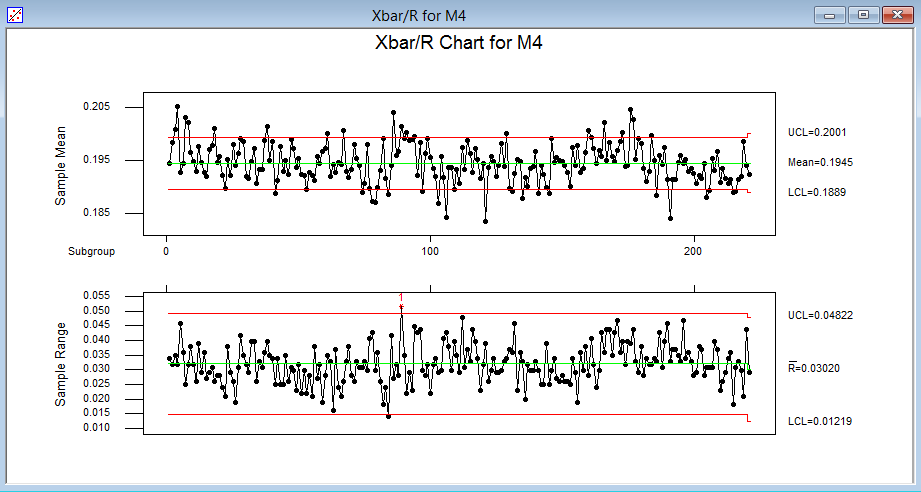
The above x-bar chart shows that the process is in statistical control but for the R control chart, one point is out of control. So process is not in a statistical control. By deleting this point, we can keep the process is in statistical control.
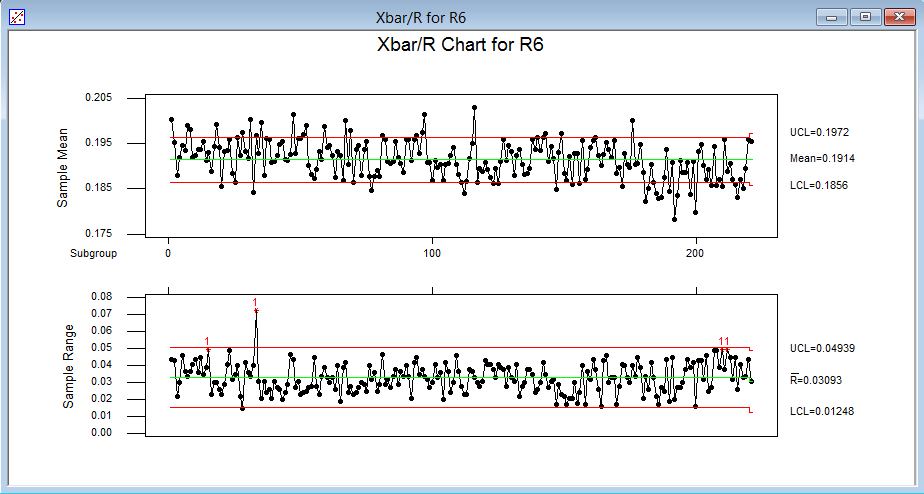
The above x-bar control chart shows that process is in statistical control but the R control chart does not show that the process is in statistical control. There are about four points are out of control. This means, the overall process for the variable thickness R6 is out of statistical control.
For all above x-bar and R control charts have variable specification limits. The processes for all these sample weights are not in a statistical control.