
Statista marketline the wall street journal angela doland
1
Abstract
3
6. Other Brand Valuation Approaches ..................................................................................22
6.10 McKinsey Brand Valuation Model ...........................................................................26 6.11 Icon Research and Consulting Brand Trek Approach ................................................27 7. Formulary Approaches .....................................................................................................27 7.1 Financial World Magazine Method .........................................................................27 7.2 Brand Equity Ten Method .......................................................................................27 7.3
Brand Finance Limited ...........................................................................................28 8. Composite economical and behaviourally-oriented brand valuation models .....................28
|
|---|
5
1.Introduction
takeover or of a merger. Finally, it could be the value that is needed in order to estimate the price of licenses. Many definitions of brand value are therefore reflected in different brand valuation approaches and methods. All in all, depending on the valuation objective and
method, the final result will be more or less reliable, more or less subjective, based on historical or forward-looking.
Model of Organizational and Behavioural Implications of Brand Value Accounting- Chris Guilding and Richard Pike
The Model of Organizational and Behavioural Implications of Brand Value Accounting by Chris Guilding and Richard Pike clearly shows the different objectives and consequences of brand valuation.
| Dysfunctional behavioural | ||
|---|---|---|
|
implications |
Reduction in ambiguity of brand
management function (2)
| Political | ||
|---|---|---|
|
||
|
||
Figure 1: Source: Chris Guilding and Richard Pike, “Brand Valuation: a Model and Empirical study of Organisational Implications”
7
Therefore, the first cause of complexity arises from the fact that more than one element may be present in a purchase. At the beginning of a brand valuation it must be determined whether there is a single unit of account, i.e. an all-inclusive brand asset or multiple separate units requiring individual valuations.
Technical issues such as separating brand equity from other intangibles and assessing the brand’s useful life and the required rate of return on intangible assets, further increase the difficulty of valuing brands. We will go into more detail regarding the discount rate determination and the brand lifetime in paragraphs 3.1 and 3.2.
On the same reasoning, even the unlevered cost of equity suggested by Smith and Parr (2005) cannot perfectly represent the required return on intangible assets. Even if we can assume that in most cases intangible assets are funded with equity, thus the unlevered cost of equity could be a good starting point, the unlevered cost of equity reflects, as the WACC, the business risk of the enterprise as a whole.
When the levered cost of equity is used, the additional risk due to debt financing by the company is also charged on to the intangible assets. However, the required return on intangible assets should only reflect the required compensation for the systematic business risk of the intangible assets.
Schauten separates the Tax Shield from the other assets in order not to underestimate the discount rate of the intangible assets as he uses the residual method to compute the value of intangible assets. The residual method considers the tax shield as part of the intangible assets if not otherwise stated, so the discount rate of the intangible assets would include the risk of tax shield (which is usually approximated by the cost of debt), thus would be underestimated.
At the same time, applying the WACC after taxes leads to an underestimation of the discount rate of all the assets, intangibles included.
VL is the market value of the levered company, thus the sum of RNWC, RTFA, RIA and RPVTS.
|
||
|---|---|---|
| 𝑊𝐴𝐶𝐶 − 𝑅𝑁𝑊𝐶𝑁𝑊𝐶 𝑉𝐿 | ||
| 𝑅𝐼𝐴 = | ||
9
3.2 Brand Lifetime1
The Consumer-based school of thoughtsconsiders that brand value exists whenever customers' preferences expressed for a brand are greater than what the simple assessment
of the utility of the product’ attributes would have suggested. Brand equity is therefore defined as a residual:
= 𝑓(𝑐𝑢𝑠𝑡𝑜𝑚𝑒𝑟 𝑐𝑜𝑛𝑡𝑟𝑖𝑏𝑢𝑡𝑖𝑜𝑛 𝑚𝑎𝑟𝑔𝑖𝑛, 𝑖𝑛𝑖𝑡𝑖𝑎𝑙 𝑐𝑢𝑠𝑡𝑜𝑚𝑒𝑟 𝑏𝑎𝑠𝑒, 𝑐ℎ𝑢𝑟𝑛 𝑟𝑎𝑡𝑒, 𝑖𝑛𝑡𝑒𝑟𝑒𝑠𝑡 𝑟𝑎𝑡𝑒, 𝑡𝑖𝑚𝑒)
1 Roger Sinclair, ”A rationale and proposed set of principles for brand valuation”, 2011
10
4.1 Models
5. Financial-based Approach to brand valuation
The Financial-based approachprompts the idea of brand as a conditional asset. In order for a brand to produce a profit or EVA (Economic Value Added), a tangible base and product or service are needed. The brand is seen as an added value after having allowed for the capital required for its production and for the cost of other intangible assets that have contributed to the business. Once all the directly valuable assets have been factored in, the residual derived will create the economic value of the brand and of other intangibles that cannot easily be evaluated directly.
11
2. Market-based Approach: the brand value is estimated by reference to open market values. This analysis is based on estimates or hard facts about the present.
5.1.1 Historical Cost of Creation Method
The Historical Cost of Creation Method uses the historical cost of creating the brand as the actual brand value. It is often used at the initial stages of brand creation when specific market application and benefits cannot yet be identified.
The Cost to Recreate Method uses current prices in order to estimate the cost of recreating the brand today. As the Historical Cost of Creation Method, the Cost to Recreate Method is optimal to obtain a minimum value and when dealing with a newly created brand.
6 Reilly and Schweihs (1999)
5.1.3 Replacement Cost Method
The Replacement Cost Method values the brand considering the expenditures and investments necessary to replace the brand with a new one that has an equivalent utility to the company. Contrary to the Cost of Recreation Method, the value computed through the Replacement Cost Method excludes obsolescent intangible assets.
The Residual Value Method8states that the value of the brand is the discounted residual value obtained subtracting the cumulative brand costs from the cumulative revenues attributable to the brand.
𝐵𝑟𝑎𝑛𝑑 𝑣𝑎𝑙𝑢𝑒 = 𝑃𝑉(∑ 𝐵𝑟𝑎𝑛𝑑 𝑟𝑒𝑣𝑒𝑛𝑢𝑒𝑠 − ∑ 𝐵𝑟𝑎𝑛𝑑 𝑐𝑜𝑠𝑡𝑠)
5.2.1 Brand Sale Comparison Method
The Brand Sale Comparison Method values the brand by looking at recent transactions involving similar brands in the same industry and referring to comparable multiples.
Firstly, Simon and Sullivan (1993) compute the value of intangible assets by subtracting the replacement value of the firm's tangible assets from the firm's cash flow.
Afterwards, they divide intangible assets into three categories:
1) the value of brand equity,
2) the value of non-brand factors that reduce the firm's costs relative to competitors (R&D, patents, technology and know-how),
3) the value of industry-wide factors which permit monopoly profits (regulation).
5.2.3 Residual Method
The Residual Method10 values intangibles as the residual value obtained when the net asset value is subtracted from the market capitalization. So when shares trade below their net asset value, a negative value for intangibles is derived and a negative brand equity value is implied.
The Price Premium Methodcalculates the brand value by multiplying the price differential of the branded product with respect to a generic product by the total volume of branded sales. It assumes that the brand generates an additional benefit for consumers, for which they are willing to pay a little extra. There are, at least, two ways to calculate the price premium statistically:
1) Conjoint Analysis: It is a statistical technique that is used to determine the importance that consumers assign to different product characteristics. By asking to consumers how much of a certain attribute they would give up in order to obtain more of another attribute, an indication of consumers' willingness to pay for specific product characteristics is obtained. Being the brand one of the product characteristics, the brand value can be computed.
considering the specific brand expenses is then possible to compute the net income attributable to the brand.
The Hedonic method is said to be very complex and the process of selecting the product’s variables risks bringing back the subjectivity that statistical models should eliminate.
Absolute or Relative techniques can be used to estimate the brand’s contribution to profit generation. Absolute techniques consider the proportion of brand-related factors relative to the total number of factors considered during the buying process.
Relative techniques either consider the brand as a quality that influences all the product’s attributes or consider the brand as an independent attribute. More specifically, the first type of relative technique ranks the demand drivers according to their importance and then determines the brand contribution to each of them. The second type of relative technique determines the importance of each demand driver, where the brand is a separate demand driver.
5.3.3 Gross Margin Comparison or Economy of Scale Technique
The Gross Margin Comparison or Economy of Scale Techniquecomputes the brand value by multiplying the gross margin difference between the branded product and the average gross margin of competitors by the sales of the branded company.
The Royalty Relief Method computes the value of the brand by discounting back to present the stream of royalty fees that the company should pay if it did not own the brand. The process works as follow:
1. Estimate the branded net sales for the next 3 to 5 years.
17
5. Estimate the brand’s perpetual growth rate, economic useful life and discount rate and discount the after tax royalty fees to present.
Royalty rates are estimated by looking at the industry while brand strength is measured comparing its attributes to of the relevant competitors. Smith and Parr (2000) question “whether the royalty rates at the bottom of the bracket really correspond to brands with low margins, low awareness and low growth or merely to disadvantageous contracts”.
2) Operating Margin Differential
4) Cluster or Group Analysis
It consists in collecting data on licensing contracts and grouping them according to different contractual characteristics and measures of profitability. The royalty rate is determined using the cluster with data on the brand and its competitors. Royalty Rates might be quite difficult to assess, hence the need to make some sensitivity analysis.
The Excess Cash Flow Method estimates the free cash flows attributable to the brand by deducting all the cash flows related to other tangible and intangible assets from the free cash flow of the firm. The discounting rate is adjusted for risk and future expected inflation and is also subject to sensitivities.
Kapferer (2012) identifies a nine steps method to evaluate the brand.
5. Calculate the excess profit attributable to the brand for each cash-generating unit and for every year.
6. Evaluate risks through a thoughtful strategic analysis on market growth, long-term expectations on the brand, competition, commoditization, elasticity to prices, brand innovation and brand R&D development.
The Marginal Cash Flow Modelvalues the brand looking at the marginal cash flows that are generated by its exploitation, compared to an unbranded firm. Unfortunately, it is difficult to find a perfectly comparable company so the cash flow differentials cannot reasonably be attributed exclusively to the brand. In practice, in fact, the unbranded comparable company might even have higher cash flows than those of the branded company.
19
Salinas (2007) affirms that “in the case of companies with strong brands and many obsolete tangible assets, the brand would be undervalued due to the high technical yield that would be allocated to the tangible and financial assets of the company”.
There are three variations of this technique:
c) Analysis of required return on investment
Once the intellectual property earnings are estimated, it isolates the ones relating to the brand.
The Corebrand Value plus the Value of Other Related Assets Method calculates the brand value as the sum of the value of the core brand and the value of the product brands. On the one hand it recognizes the two main areas of value of the corporate brand, but on the other hand it is quite subjective.
5.3.12 Customer Lifetime Value method
5.3.14 Differential of Price to Sale ratios Method
The Differential of Price to Sale ratios Method calculates brand value as the difference between the estimated price to sales ratio for a branded company and the price to sales ratio for an unbranded company and multiplies it by the sales of the branded company.
The Interbrand Approach determines the brand's earnings by defining the "Brand Index" seven factors:
1. Market (with weight of 10%): considers whether the market is growing and if there are strong barriers to entry.2. Stability (15%): values customer loyalty.
22
6.3 Formula Based on Accounting Data Method
The Formula Based on Accounting Data Method, only relying on publicly available information, computes the brand value discounting the brand earnings in perpetuity with no growth. Brand earnings depend on prestige, expansion and loyalty and contain an intrinsic risk: for this reason, using a risk free rate is a pitfall of this method.
The Percentage of Market cap Attributable to the Brand Methodderives the brand value looking at financial data and making surveys to corporate executives. It may be the only method that do not solely rely on customers.
6.6 Real Options Method
The valuation through real option is composed of two parts: a basic value and the value of the option itself. The value of the cash flows deriving from the licensing contract represents the underlying asset, while the cost of developing the brand is the strike price. Since this method considers the value inherent in the uncertainty of cash flow and in future opportunities, it is valuable for management decision making regarding extension and expansion of the brand.
The Expanded Brand Equity Value (EBEV) is:
𝐸𝐵𝐸𝑉 = 𝑃𝐵𝑉 + 𝐸𝐸𝑋𝑃+ 𝐸𝐸𝑋𝑇
There are two ways of applying the real option method:
a) Binomial method (time as a discrete variable)
The Binomial Method creates a decision tree for a specified amount of time, and assumes that at each node the asset can have two possible prices, either following a constant upward trend or following a constant downward trend. Each node is characterized by a probability of occurrence and an utility function. The branch with the highest value on every decision node is discounted at WACC to find the value of the option. Considering that the risk of the asset fluctuates over time, the WACC must be adjusted to the varying risk.
And
| So |
|
|
|---|---|---|
| K | ||
| r | ||
| T | Contract horizon |
|
| σ | Return Volatility |
|
The Stock Price Movements Methodcalculates the brand value as the part of the company stock value that is derived from it. The value obtained is then equated to the value of advertising expenses, time in market and present and past ad share.This method is usually usedto value single brand companies. It assumes strong efficient markets.
6.8 Valuation Model based on the Capital Asset Pricing Model
Being based on scanner data on purchase histories, this technique is not comparable to customer-based models which rely on customers' surveys. However, being based on past and present purchase patterns, it does not necessarily forecast future brand profits.
6.10 McKinsey Brand Valuation Model
TheIcon Research and Consulting Brand Trek Approach is based on behavioural science15 and
determines brand value from brand image and brand assets.Brand image is composed of the short-term characteristics of the marketing mix that are visible to consumers, such as the product and packaging design, advertising, promotions and events. Brand assets represent longer-term changes in consumer attitudes but even though they have a direct connection with the success of a brand, they can only be influenced through the brand image.
The Brand Equity Ten Method17 measures brand equity through 5 dimensions:
1. Loyalty
a. Price premium
b. Customer satisfaction
2. Perceived Quality or Leadership Measures
3. Other customer-oriented associations or differentiation measures a. Perceived value
b. Brand personality
c. Organizational associations
4. Awareness measures
27
5. Market behaviour measures
a. Market share
b. Market price and distribution coverage
models
8.1 Semion Brand Value Approach
28
8.3 Portfolio Models of Brand Value
The Integrated Model of Brand Valuation joins together the economical, psychographic, behavioural, composite economical and behavioural brand valuation models.
The factors, marked out by authors, grouped into 3 groups: the strength of brand value, brand image, defence and conflict factors. All these factors are ranked by points. According to the importance of each group of factors the weighted index is given.
Brand potential valuation
| X Coeffbr.img | X Coeffbr.def.conf | Economic brand | X | ||
|---|---|---|---|---|---|
| X Coeffbr.str | |||||
| Brand Value, in points | value, when | or | |||
| nbr=1 |
|
Brand value in point of view of customer
and company equity, when nbr=1
Economical and Behaviorally-oriented Brand Valuation Models. Being proprietary methods, we do not have
enough information on their implementation procedures to give them such classification.
| Approach | Method | Principle | Ease of application |
Subjectivity | Time Perspective | Reliability |
|---|---|---|---|---|---|---|
| Medium | Medium | Present | Medium/High | |||
|
|
Low | Low | Present | Medium | |
| High | Low | Present | Medium/High | |||
| High | Low | Present | Medium | |||
|
|
Medium | Low | Present | High | |
| Medium | Medium | Future | Medium/High | |||
| Low | Low | Future | Medium | |||
|
|
Low | Medium | Future | Medium | |
| Medium | Medium | Future | Medium | |||
| Medium | Medium | Future | Medium | |||
|
|
Low | High | Future | Low | |
| Low | Medium | Future | Low | |||
| High | Low | Present | Medium | |||
|
|
High | Low | Present | Medium |
Table 2: Summary of the Brand Valuation Methods analysed. Source: own analysis
33
Statistics confirm the explosive pace at which the industry has developed as worldwide B2C e-commerce sales amounted to more than $1.2 trillions in 201322. Current e-commerce statistics state that 40% of worldwide internet users have bought products online. This represents more than 1 billion online buyers and is projected to grow.
Electronics represent the largest segment of the global online retail sector with a share of 22.5% of the total value. The Apparel/accessories/footwear segment is the second larger with a share of 19.1%.23
America represents 37% of the sector value, Europe 34.3%, Asia Pacific 28.2% and Middle-East and Africa 0.9%.In 2019 the Chinese online retail sector is forecast to have a value of $515.1bn, an increase of 218% since 2014.
22 Source: HEC Paris, Statista
Alibaba’s dimensions
Alibaba is the world’s fastest growing e-commerce market24. Transactions on its online sites totalled $248bn last year, more than those of eBay and Amazon.com combined. Currently, 80% of China’s online shopping market is dominated by Alibaba.Alibaba’s value
10.3 Alibaba - Overview and History
The Alibaba group was founded in 1999 by Jack Ma and 17 other co-founders. Their objective was to help small Chinese exporters, manufacturers and entrepreneurs to sell internationally.
24 Source: The Wall Street Journal
35
| China | International | |
|---|---|---|
| Retail |
|
|
| Wholesale |
|
Strengths
•Market position: Strong market position, with the world’s largest online and mobile commerce business based on 2013 GMV;
•Mobile Commerce: Leadership in mobile commerce in China (86% of total mobile retail gross merchandise volume in China);
•Network Effects: Network effects of Taobao and Tmall are difficult to replicate;
•Customers’ attraction: Thanks to its dominant user base, Alibaba has accumulated the largest number of customers' reviews. This attracts new customers;
•Absence of direct sales: Alibaba does not have inventory expenses on its P&L: it operates as an intermediary for third-party sellers;
•Small asset base: Having a little asset base, Alibaba can have a strong cash-flow generation.Threats
•China’s growth rate: Slowing growth of the Chinese economy;
•Intense competition: Yahoo!, 360buy, Tencent, Gome Electricals are exercising fierce competition. However, Alibaba also competes with catalogue and mail order retailers and online/offline auctioneers;
•Challenging environment for SMEs: Small and Medium enterprises, Alibaba's main customers are encountering difficulties in fundraisings and because of rising labour costs; •Rapid technological changes: the adoption of new industry standards may impact the company's competitive position;
•Regulation: Increased regulation over online and mobile payment.
| 2012A | 2013A | 2014A | ||
|---|---|---|---|---|
| 3,179 | 5,523 | 8,401 | ||
|
(1,041) | (1,555) | (2,139) | |
| 2,139 | 3,968 | 6,262 | ||
| (460) | (611) | (815) | ||
| (486) | (588) | (727) | ||
| (351) | (470) | (675) | ||
| 203 | 428 | (207) | ||
|
639 | 1,870 | 4,252 | |
|
(157) | (178) | (265) | |
| 796 | 1,751 | 3,987 | ||
| 82 | (102) | 301 | ||
| 878 | 1,618 | 4,288 | ||
| (134) | (233) | (511) | ||
|
15% | 14% | 12% | |
| 741 | 1,385 | 3,777 | ||
| (69) | (19) | (14) | ||
| 0 | (21) | (71) | ||
| 671 | 1,345 | 3,692 |
Balance Sheet- Economic View
Source: Brokers report and own calculations
(in $millions except for per share data. FY ends March,31
Alibaba’s sales have considerably increased in the last two years. Growth has been of 74% in 2013 and of 52% in 2014. Having Costs of Goods Sold increased at a lower pace (49% and 38% in the two years respectively), the Gross Margin has registered an impressive surge. Alibaba has been invested in its brand by expanding Product Development Expenses and Sales and Marketing Expenses by approximately 30% each year. Overall, keeping Operating Costs growth monitored, EBITDA has tripled in 2013 and then doubled in 2014, being 20% of Sales in 2012 and 51% of Sales in 2014. The limited depreciation that characterises the e-commerce business has allowed EBIT to increase by 120% in both years. EBIT Margin was 25% in 2012 and became 47% in 2014. Finally, the Net Profit of the group has doubled in 2013 and tripled in 2014. EPS increased from 3.66 in 2013 to 10.61 in 2014.
Being Alibaba in the retail business, it can benefit of Negative Working Capital. The group’s success in the last two years has increased its bargaining power against suppliers and the Working Capital is more and more financing the activities of the company.
The Market to Book Value ratio is at 32.2 at the end of April 2015.
All in all, the company’s performance appears solid and in steady increase. It is quite reasonable to have positive expectations for the near future of the group.
The leader: Jack Ma is a charismatic leader guiding the company to build trust internally and with foreign investors26. The employees believe in his objectives and follows his guidance.
The objective: Joseph Baladi, head of consulting at the Leo Burnett Institute of Behaviour in Singapore, found that “making money” was the common response when he interviewed more than 100 CEOs from Asian companies and asked about the purpose of their businesses. On the contrary, Mr Ma was able to create a business model that makes money by exploiting and fulfilling the human fundamental need to connect.
JD.com is a major B2C online retailer in China, founded in 2004 and internationally expanded since 2012. JD.com offers product of different categories including electronics, home appliances and general merchandise on is direct sales and third-party marketplace platforms.
In 2013 it launched cloud computing services, internet financial credit payment products and was granted a license to resell mobile telecom services. In 2014 JD.com created a partnership with Tencent, another leading company in China, maker of WeChat. Being WeChat the second most popular mobile platform in the world (for online gaming, online
JD.com is the main competitor of Tmall, and as Alibaba it is internationally oriented and has been listed on the US stock exchange in 2014.
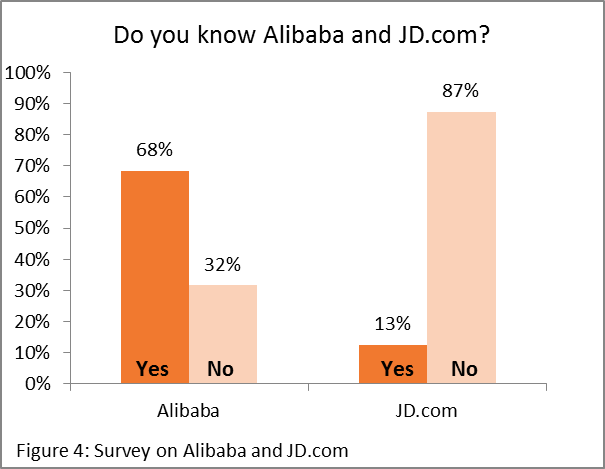
However, JD.com can be considered Alibaba’s unbranded comparable. A survey run on a sample of 100 business students reports that 68% of them know the brand Alibaba and have a clear idea of its business model. However 87% of the people have never heard of JD.com.
| 5) | |
41
Equity risk premium= 7.96%31. Again, being Alibaba's revenues concentrated in China for 81.6%, we take the Chinese equity risk premium.
Cost of debt= 5%32.
| Value |
|
|---|
|
|---|
29 IPO Prospectus
30 Source: UBS Brokers Report
42
Growth rate: 32% which corresponds to the expected 2016 GMV growth rate according to Bernstein Research.
| • | ||
| • |
|
|
|
||
| • | ||
| Asset | ||
Table 7: Discount rate Calculation based on WARA Theories
Table 8: Benchmark Valuations
As can be seen from the table, the valuation of the Alibaba brand is very controversial and ranges between $11bn to $60bn according to Brand Valuation Agencies.
|
|||||
|---|---|---|---|---|---|
| Year |
|
Licensor | Details |
| 3% |
|
|---|
Table 9: Royalty Rates of Comparable Companies
Availability Services Capital, Inc. is based in Wayne, Pennsylvania.
44
| 2,182 | 4,374 | 6,653 | 9,788 | 13,063 | 16,601 | 20,263 | 23,716 | 26,567 28,427 |
|---|
| 12% | ||||||||||
|---|---|---|---|---|---|---|---|---|---|---|
| 951 | 1,134 | 1,286 | 1,402 | 1,465 | 1,465 | 1,400 | ||||
| 9,103 | ||||||||||
|
59,130 | |||||||||
|
| 39,061 | |||||||||||
|---|---|---|---|---|---|---|---|---|---|---|---|
| $M |
|
||||||||||
| 39061 | 8.0% | 9.0% | 10.0% | 11.0% | 12.0% | 13.0% | 14.0% | 15.0% | |||
| Discount Rate | |||||||||||
|
|||||||||||
|
|||||||||||
|
|||||||||||
Mecox Lane Limited (Mecox Lane) is a holding company that operates online platform for apparel and accessories. It offers a selection of products on ir. M18.com e-commerce Website. Mecox Lane’s online platform offers products under its own brands, such as Euromoda and Rampage and under selected third-party brands, including established international and Chinese brands, such as Adidas, Daphne, Kappa and Li Ning, as well as independent and emerging brands.
China Digital Mobile Television Co., Ltd. Operates a technology that sends signals from a base station to TV sets in public areas such as shopping malls and buses. China Digital Mobile TV Co., Ltd. operates as a subsidiary of China Digital Technology Consulting (Shenzhen) Co., Ltd.
| $M | Royalty rate | |||||||||
|---|---|---|---|---|---|---|---|---|---|---|
| 39061 | 8.0% | 9.0% | 10.0% | 11.0% | 12.0% | 13.0% | 14.0% | 15.0% | 16.0% | |
| Growth Rate | ||||||||||
|
||||||||||
|
||||||||||
|
||||||||||
|
||||||||||
|
||||||||||
However, recently JD.com has been trying to increase the value and attractiveness of its marketplace, following the example of Alibaba. Transactions and advertising fees paid by retailers to JD.com have reached $377 millions37 in the last quarter of 2014, up 199% from the same period the year before.
JD.com is currently a loss-making company because its direct sales requires it to finance and manage a large inventory, while maintaining a capital-intensive logistics and infrastructure network of 123 warehouses and 3,210 delivery stations in China. For this reason, JD.com is trying to imitate the marketplace business model of Alibaba, leveraging on the delivery network and warehouses that it can offer to its merchants and that distinguish it.
Table 13: Comparison Alibaba-JD.Com
We use the number of merchants on the marketplace as the volume variable and multiply the difference in the expected number of merchants in Alibaba and JD.com marketplaces per the Alibaba’s price to find the Volume Premium of Alibaba.
We subtract the expenses related to brand management that Alibaba has in excess of JD.com to arrive to Brand Earnings.
| Values/range |
|---|
|
2.9% |
|---|
| 1,040,044,000 | ||||
|---|---|---|---|---|
| 3.00% | 10.00% | |||
|
960 |
|
||
| 16,000,000,000 | ||||
| 60,000 | ||||
| Yearly increase in Number of merchants | 58% |
|
Table 14: Price Premium Method Inputs
Table 15: Computation of Alibaba and JD.com Prices
| (558) | (741) | (947) | (1,142) | (1,206) | (1,274) | (1,354) | (1,461) | (1,609) | |
|
(12%) | (15%) | (18%) | (20%) | (20%) | (20%) | (20%) | (20%) | (20%) |
|
(611) | (831) | (1,126) | (1,376) | (1,453) | (1,534) | (1,632) | (1,761) | (1,939) |
| (13%) | (17%) | (21%) | (25%) | (25%) | (25%) | (25%) | (25%) | (25%) | |
| (1,169) | (1,572) | (2,073) | (2,518) | (2,659) | (2,808) | (2,986) | (3,222) | (3,548) | |
| (256) | (600) | (641) | (679) | (717) | (757) | (806) | (869) | (957) | |
|
(5%) | (12%) | (12%) | (12%) | (12%) | (12%) | (12%) | (12%) | (12%) |
|
(160) | (300) | (320) | (340) | (359) | (379) | (403) | (435) | (478) |
| (3%) | (6%) | (6%) | (6%) | (6%) | (6%) | (6%) | (6%) | (6%) | |
| (416) | (900) | (961) | (1,019) | (1,076) | (1,136) | (1,208) | (1,304) | (1,435) | |
| (753) | (672) | (1,112) | (1,499) | (1,583) | (1,672) | (1,778) | (1,918) | (2,112) | |
| 143 | 128 | 211 | 285 | 301 | 318 | 338 | 364 | 401 |
| (610) | (544) | (901) | (1,214) | (1,282) | (1,354) | (1,440) | (1,554) | (1,711) |
|---|
| 4,376 | 3,912 | 3,689 | 3,478 | 3,303 | 3,182 | 3,128 | |||
|---|---|---|---|---|---|---|---|---|---|
| 12% | |||||||||
| 1.5% | |||||||||
|
|||||||||
|
59,677 | ||||||||
| $M |
|
|||||
|---|---|---|---|---|---|---|
| ### | 0.5% | 1% | 1.5% | 2% | 3% | |
9% 70,594 73,544 76,888 80,709 85,118
Considering that in the Notes to the Financial Statements in 2011 Brand Earning growth rate was estimated to be between 2.5% and 4%, we took a more conservative view because Alibaba has recently already expanded considerably. We assumed a brand earning growth rate of 1.5% and then computed sensitivities. The brand value obtained is $55,302.
49
|
|
12,358 | 16,494 | 20,961 | 25,585 | 29,945 | 33,544 | 35,893 |
| 47% | 33% | 27% | 22% | 17% | 12% | 7% | ||
| Operating Margin Premium Cash Flow befo | re Taxes | 4,450 | 6,828 | 8,691 | 11,379 | 12,747 | 13,639 | |
| (758) | (845) | (1,297) | (1,651) | (1,847) | (2,162) | (2,422) | (2,591) | |
| 19% | 19% | 19% | 19% | 19% | 19% | 19% | 19% |
| 3,230 | 3,604 | 5,530 | 7,040 | 7,875 | 9,217 10,325 11,048 |
|---|
| 64,484 |
|---|
Table 18: Margin Comparison Method
| $M | ||||||||||
|---|---|---|---|---|---|---|---|---|---|---|
| ### |
|
38.0% | 40.0% | 42.0% | 44.0% | 46.0% | 48.0% | |||
| 18- | ||||||||||
| (20 |
|
|||||||||
| ins | ||||||||||
| arg | ) |
|
||||||||
| M | 02 | |||||||||
| BIT | 2 |
|
||||||||
| m E | ||||||||||
| co |
|
|||||||||
| JD. | ||||||||||
Table 19: Sensitivities: Alibaba and JD.com 2018-2021 EBIT Margins
| Value |
|
Source |
|---|
Table 20: Excess Cash Flow Method Assumptions
|
| 2,217 | 3,403 | 5,226 | 6,606 | ||||||
|
53% | 54% | 26% | ||||||
|
(2.1%) | (1,469) | (2,161) | ||||||
| 5.8% | 3,644 | 3,644 | 3,644 | 3,644 | |||||
| 10.5% | 893 | 1,662 | 2,613 | 3,735 | |||||
|
13.0% | 1,887 | 1,887 | 1,887 | 1,887 | ||||
|
12.0% | 571 | 313 | 311 | 323 | ||||
| 651 | 715 | 830 | 966 | ||||||
| 1,567 | 2,688 | 4,396 | 5,640 | 6,858 | 7,880 | 8,526 | 8,653 | ||
| 72% | 64% | 28% | 22% | 15% | 8% | 1.5% | |||
| 2,688 | 3,925 | 4,496 | 4,881 | 5,008 | 4,838 | 4,384 | |||
|
12% | ||||||||
|
30,219 | ||||||||
| 42,380 | 83,650 | ||||||||
Table 22: Excess Cash Flow Method - Sensitivity Analysis - Growth and Discount rate
51
Table 24: Excess Cash Flow Method - Sensitivity Analysis - Goodwill & Intangibles Required Return
Given the fact that it is a recent business, we also took into account in the Historical Cost of Brand building what has been invested by the company since its creation.
52
| (80) | (85) | (89) | (94) | (104) | (116) | (129) | (143) | (201) | (279) | (393) | (521) | (593) |
|
|||
|
23 | 497 | 795 | 511 | 534 | 1,203 | 874 | 284 | 1,050 | |||||||
| 474 | 298 | 0 | 24 | 669 | 0 | 0 | 766 | |||||||||
| 2,230 |
The Historical Cost method gives a value of $10,715m.
53
| (80) | (85) | (89) | (94) | (104) | (116) | (129) | (143) | (201) | (279) | (393) | (521) | (593) | (1,342) | (1,756) | (2,560) | |
|
|
0.40% | 0.70% | 1.20% | 3.90% | 1.80% | 1.50% | 4.80% | 5.90% | 3.30% | 5.40% | 2.65% | 2.62% | 2.28% | ||
| 0.986 | 1.004 | 1.007 | 0.992 | 1.012 | 1.039 | 1.018 | 1.015 | 1.048 | 1.059 | 0.993 | 1.033 | 1.054 | 1.026 | 1.026 | 1.023 | |
| 1.335 | 1.349 | 1.345 | 1.338 | 1.346 | 1.334 | 1.295 | 1.277 | 1.262 | 1.214 | 1.155 | 1.162 | 1.129 | 1.075 | 1.049 | 1.023 | |
| (107) | (114) | (120) | (125) | (140) | (155) | (167) | (183) | (254) | (338) | (454) | (606) | (670) | (1,443) | (1,842) |
|
|---|
| (587) | (557) | (523) | (489) | (488) | (480) | (463) | (453) | (561) | (668) | (800) | (953) | (941) | (1,811) | (2,063) |
|---|
| 14,456 |
|---|
54
| $M | |||||||||
|---|---|---|---|---|---|---|---|---|---|
| #### |
|
75% | 80% | 85% | 90% | 95% | 100% | ||
|
|||||||||
To apply the Transaction Multiple Method we looked at recent acquisitions of e-commerce companies done by Alibaba’s main competitors. We selected one acquisition done by e-Bay, two acquisitions done by Amazon and one acquisition done by Baidu. In the four acquisitions, the acquirer was taking control of 100% of the target (for the Nuomi Holding Inc. acquisition, Baidu was buying the remaining 41% stake, having bought already 59% of the company four months before).
In the cases of GSI Commerce Inc and Zappos.com Inc, the acquired brand value was explicitly reported in the acquiror’s annual report. However, for the other two transactions, we had to estimate the brand value of the target based on the information available in the annual reports of the acquirer. In particular, for Quidsi Inc, considering that the enterprise value
| 4,326 | ||||||||
| 5 | 21,631 |
|---|---|
| 6 | 25,957 |
| 7.0 | 30,284 |
| 8 | 34,610 |
| 9.0 | 38,936 |
| 10 | 43,262 |
| 11.0 | 47,589 |
Table 29: Sensitivities -
Transaction Muliple Mehod
| 2,898 |
|---|
2) Alibaba brand strength score computation
Leadership
Alibaba is the dominant leader in China e-commerce with 80% market share. It is the largest online and mobile commerce company in the world in terms of GMV in 2013, according to the technology research firm IDC. At the same time, iResearch defines Taobao Marketplace 57
Market
Marketline states that the strong market growth in the online retail industry alleviates the rivalry caused by the large number of players and low switching costs for consumers. The sector is very competitive because customers can easily make comparisons between different prices but at the same time many consumers are concerned about the security of online transactions, which increases loyalty to well-known retailers. Barriers to entry are low due to low fixed costs, little regulation and easy access to suppliers. Small companies may enter the market by providing specialized or niche products. We give a score of 5/10.
Support
During the last decade, Alibaba has highly sustained its brand investing on average 47% of its revenues in Sales and Marketing and Product Development Expenses. In the last three years, having its brand recognition increased considerably, 26% of revenues have been dedicated to brand-related expenses. We consider that Alibaba can give all the necessary support needed to further expand the awareness and loyalty to its brand. We therefore give a score of 8/10.
|
25 | 15 |
|---|---|---|
| 15 | 7 | |
| 10 | 5 | |
| 25 | 8 | |
| 10 | 7 | |
|
10 | 8 |
|
5 | 3 |
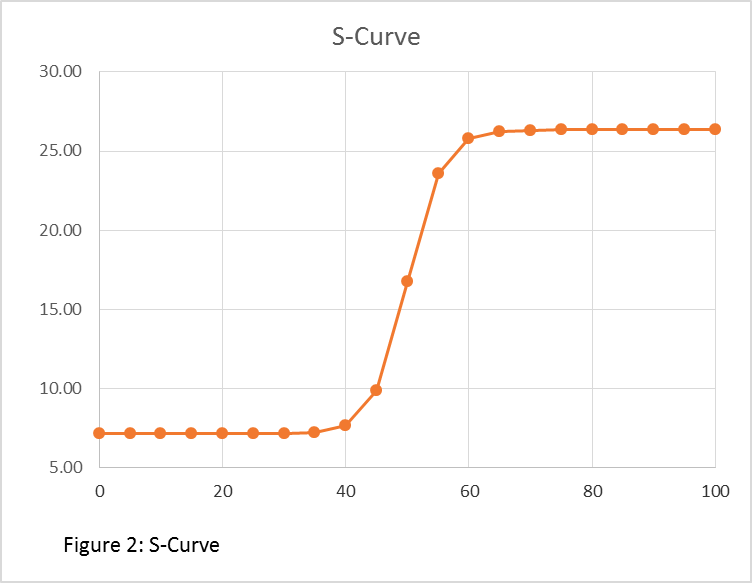
| 0 | 7.12 |
|---|---|
| 5 | 7.12 |
| 10 | 7.12 |
| 15 | 7.12 |
| 20 | 7.12 |
| 25 | 7.13 |
| 30 | 7.14 |
| 35 | 7.21 |
| 40 | 7.63 |
| 45 | 9.85 |
| 50 | 16.73 |
| 55 | 23.61 |
| 60 | 25.82 |
| 65 | 26.24 |
| 70 | 26.32 |
| 75 | 26.33 |
| 80 | 26.33 |
| 85 | 26.33 |
| 90 | 26.33 |
| 95 | 26.33 |
| 100 | 26.33 |
38 Source: F-1 Pag.170
59
| Table 33: Demand Driver Approach Final Result |
|---|
| 4,374 | 6,653 | 9,788 | 13,063 | 16,601 | 16,601 | 16,601 | 16,601 |
|
|---|
|
12% | ||||||||
|---|---|---|---|---|---|---|---|---|---|
|
951 | 1,134 | 1,286 | 1,149 | 1,025 | 916 | 818 | ||
| 7,279 | |||||||||
| 6,813 |
Table 34: Real Option Method - 0% growth
|
30% | 1,276 | |||||
|---|---|---|---|---|---|---|---|
|
30% | 1,276 | |||||
| 20% | 850 | ||||||
| 20% | 850 |
61
Table 36: Real Option - US
| $M |
|
|||||||||||
|---|---|---|---|---|---|---|---|---|---|---|---|---|
| 11,227 | 2.0% | 2.5% | 3.0% | 3.5% | 4.0% | 4.5% | ||||||
|
|
|
|
|||||||||
| ent |
|
|
|
|
||||||||
| stm |
|
|
|
|
||||||||
| nve |
|
|
|
|||||||||
| I | 1,701 | 4,670 | 6,715 | 8,773 | 10,837 | 12,902 | 14,969 | 17,036 | ||||
|
|---|
Table 39: Real Option - Europe
|
|
|||||||||||
|---|---|---|---|---|---|---|---|---|---|---|---|---|
| 5,946 | 30% | 35% | 40% | 45% | 50% | 55% | ||||||
|
6,337 | 6,337 | 6,339 |
|
|
|||||||
| ent |
|
6,137 | 6,138 |
|
|
|||||||
| stm |
|
5,939 |
|
|
||||||||
| nve |
|
|
|
|
||||||||
| I | 1,701 | 5,536 | 5,539 | 5,548 | 5,566 | 5,592 | 5,627 | 5,670 |
Table 41: Europe Real Option - Sensitivities
63
| Objective 2019 |
| 15,256 |
|
24,329 | ||
|---|---|---|---|---|
|
12.37% |
| 0% | 0.9% | |||
|---|---|---|---|---|
| 0 |
|
219 | ||
|
850 | |||
| Sales if no investments | 0 | |||
| 101 | 219 | |||
| 12.18% | 12.18% Source: investing.com - Russia 10r Gv Bond yield | |||
|
1.07 | 1.07 Source: UBS Brokers Report | ||
|
8.60% | |||
| 21.38% | ||||
| 0% | 0% Negative Net Debt | |||
| 21.38% | ||||
|
||||
|
101 | |||
| 850 | ||||
| 4 | ||||
| 12% | ||||
| 40% | ||||
|
-1.6558 | |||
|
-2.4558 | |||
| 0.0489 | ||||
| 0.0070 | ||||
|
|||||||||||||
|---|---|---|---|---|---|---|---|---|---|---|---|---|---|
| 1 |
|
30% | 35% | 40% | 45% | 50% | 55% | ||||||
|
|
|
|
||||||||||
| ent |
|
|
|
|
|||||||||
| stm |
|
|
|
|
|||||||||
| nve | 0.00 |
|
|
|
|||||||||
| I | 1,276 | 0.00 | 0.01 | 0.09 | 0.35 | 1.89 | 3.34 |
Table 44: Russia Real Option - Sensitivities
| Objective 2019 |
|
20,663 |
|
26,203 | |
|---|---|---|---|---|
| 6.12% |
| 0% | 0.5% | |||
|---|---|---|---|---|
|
0 |
|
131 | |
| 850 | ||||
| Sales if no investments | 0 | |||
| 78 | 131 | |||
|
4.49% |
|
||
| 1.07 | 1.07 Source: UBS Brokers Report | |||
| 8.60% | 8.60% Source: Damodaran for Brazil | |||
| 13.69% | ||||
| 0% | 0% Negative Net Debt | |||
|
13.69% | |||
|
||||
| 78 | ||||
| 850 | ||||
| 4 | ||||
| 4% | ||||
|
40% | |||
|
-2.3551 | |||
| -3.1551 | ||||
| 0.0093 | ||||
| 0.0008 | ||||
Table 45: Real Option - Brazil
| $M | |||||||||||||
|---|---|---|---|---|---|---|---|---|---|---|---|---|---|
| 0 |
|
30% | 35% | 40% | 45% | 50% | 55% | ||||||
|
|
|
|
||||||||||
| ent |
|
|
|
|
|||||||||
| stm |
|
|
|
|
|||||||||
| nve |
|
0.00 |
|
|
|||||||||
| I | 1,276 | 0.00 | 0.00 | 0.00 | 0.03 | 0.13 | 0.37 | 0.83 |
65
The final value of the brand is the sum of the brand value without growth and the four options values.
| 14,091 | |
|---|---|
| 11,227 | |
| 5,946 | |
|
1.26 |
|
0.16 |
| 31,265 |
|---|
|
Brand Value |
|---|
|
|---|
66
| 2009 | 2010 | 2011 | 2012 | 2013 | 2014 |
67
Bibliography
|
|---|
and Geoffrey Bick University of the Witwatersrand
1993), pp. 28-52
• “Brand Valuation: a Model and Empirical study of Organisational Implications”, Chris
• Roger Sinclair, ”A rationale and proposed set of principles for brand valuation”, 2011
• Sam Dias, Lynette Ryals, “ Options theory and options thinking in valuing returns on
• Indré Jucaityté, Regina Virvilaite, “Integrated Model of Brand Valuation”, 2007
• Brands: What’s in a name? Careful consideration of brand value issues can improve