
Task 2.1 identify change requirements and opportunities
BSBLDR601

◻ I have correctly referenced all resources and reference texts throughout these assessment tasks.
◻ I have read and understood the assessment requirements for this unit
Table of Content
Task 2 – Develop a change management strategy
| Task summary and instructions | |
|---|---|
| What is this assessment task about? |
You are required to address the following:
Although the assessment requires group collaboration to simulate a work environment, the assessment submission is individual, and it will be marked as such. |
| What do I need to do to complete this task satisfactorily? |
|
| Specifications |
You must submit to GOALS
Summary of changes to the Change Management Plan |
| Resources and equipment |
|
| Re-submission opportunities | You will be provided feedback on your performance by the Assessor. The feedback will indicate if you have satisfactorily addressed the requirements of each part of this task. If any parts of the task are not satisfactorily completed, the assessor will explain why, and provide you written feedback along with guidance on what you must undertake to demonstrate satisfactory performance. Re-assessment attempt(s) will be arranged at a later time and date. You have the right to appeal the outcome of assessment decisions if you feel that you have been dealt with unfairly or have other appropriate grounds for an appeal. You are encouraged to consult with the assessor prior to attempting this task if you do not understand any part of this task or if you have any learning issues or needs that may hinder you when attempting any part of the assessment. |
Task 2.1 Identify change requirements and opportunities
Develop a draft report to summarise your analysis concerning change requirements and opportunities for the company.
Consult with pertinent stakeholders to gather critical inputs into the finalisation of the report and prioritise change requirements in collaboration with relevant managers.
Draft a change initiative opportunity report (Template 1).
You will finalise the report after consulting with relevant stakeholders (see Task 2.1B).
Purpose of the Report and Background
Write a brief statement on the purpose of the report.
Internal business environment (organisational structure, leadership, the status of operations, known issues and opportunities)
External business environment (for example industry status, review of current client base, suppliers, any relevant change and trend in technology, legislation and society)
Complete the sections below.
PESTLE Analysis – Overview
| SWOT Analysis | |
|---|---|
| Strengths | |
| Weaknesses | |
| Opportunities | |
| Threats | |
Perform a review of the current policies and practices in the organisation. (Are the policies and practices relevant and current? Would you change any work practice? Would you add or improve any existing policy?).
Summarise the outcome of the review and evaluate existing policies and practices.
The PESTLE and SWOT analysis
The company's policies and practices
What opportunities the business could harvest
What problems the business should resolve
Summarise the current state of the company based on your business situation analysis. - Four (4) items.
Identify what gaps are there between the desired future state and the company's current state (for example, current inadequate/insufficient capabilities and resources, obsolete technology, operational issues, lack of organisational leadership, ineffective organisational culture etc.).
| Desired future state | Current state | Gaps |
|---|---|---|
Five (5) changes.
Based on your evaluation, provide recommendations on the top 3 change opportunity initiatives, ranked in order of urgency/importance. It is recommended that you consider cost Vs benefits for each recommended change initiative to inform decision-making when prioritising the change initiatives. Explain the reasons for prioritisation.
in simulated work conditions.
This is a Role-Play.
Prepare the draft Change Initiative Opportunity Report
Prepare a list of questions to ask the stakeholders to gather inputs and feedback
Review and prioritise the change requirements in collaboration with the group of stakeholders
Communicate effectively using techniques such as summarising, rephrasing, questioning and active listening
Compromise, collaborate, compete or accept
Be prepared to negotiate and identify the non-negotiable
After the consultation
Complete the meeting minutes (Template 2) according to instructions.
| Date | |
|---|---|
| Participants | |
| Locaton | |
| Discussion Items | |
| Items | Summary of discussion |
(30-50 words) |
|
Change requirements |
|
(2-3) |
|
Summarise the changes to the Change Initiative Opportunity Report agreed on during the consultation. Record the changes in the space provided below.
Task 2.2 Develop a change management strategy
Obtain approval from relevant authorities to confirm the change management process
Change Management Plan
Purpose
Key roles and responsibilities
Communication strategy to promote the benefits of the plan and to keep stakeholders informed on progress regarding the change initiative
Organisational readiness for change analysis
Reporting Protocol
Costs
Purpose of the plan
Write a brief statement on the purpose of the change management plan (20-30 words).
(50-100 words)
Scope and objectives of the change initiative
Resources
Address the following:
Budget and cost-benefit analysis
List of key benefits with a total $ benefits
Formula: Total $ Benefits- Total $ Costs
For each stakeholder, provide a brief summary of your strategy to engage them in the change initiative.
Develop a strategy to communicate the benefits of the change initiative and the progress towards implementing the plan. The strategy will contribute to promote the benefits of the change to the organisation and to minimise loss.
| Communication need | Target Audience | Medium of communication | Frequency |
|---|---|---|---|
| Example: reports on expenses | Example: Financial Team and Senior Management Team | Example: Report sent via email | Example: Fortnightly |
Remember:
Responsible R: a person who performs an activity or does the work.
Schedule and Operational Activities
Develop a schedule for the implementation of the change plan that includes:
The use of a Gannt chart is recommended, but a table in a word is also acceptable (one is provided below).
Four key (4) deliverables with two actions/deliverables must be identified.
| Deliverable | Actions (at least 2/deliverable) | Timeline for completion | |
|---|---|---|---|
Identify seven (7) risks. Use the table below to document your analysis.
Identify and describe what support and training activities will be provided to staff to:
Support them through the change process (think about fatigues, stress, keep them motivated and involved)
|
|
|||
|---|---|---|---|---|
Monitoring and control - Evaluation
Identify ad describe the key monitoring and control activities for the implementation of the change plan.
How the monitoring activities will be reported to the project (change) manager.
Identify how the implemented changes will be evaluated concerning the planned objectives, when the evaluation will occur, and how evaluation outcomes will be circulated and promoted to stakeholders.
Discuss the plan gathering feedback and inputs into the plan
Agree on changes/refinements/adjustments to the plan
If you are absent from class, it is your responsibility to make alternative arrangements with the trainer and assessor to perform the Role-Play.
Before the meeting
Seek feedback and inputs from stakeholders
Determine and agree on any change/refinements/adjustments to the plan
Use negotiation techniques:
Compromise, collaborate, compete or accept
Offer and expect commitment
After the meeting
References
(Please refer to this referencing guide if needed or speak to your trainer for any specific referencing requirements for this assessment) |
|---|
Appendix 1 – Scenario
The company
Administration and Management Offices (including the main boardroom, 2 meetings rooms and a computer lab with 20 PCs) on Level 45
15 Classrooms, kitchenette, client lounge room and a trainers' room on Level 46
Non-accredited courses are business courses that have been highly customised to meet clients' training needs.
The current organisational structure is as follows:
Mr Eli Brown – Non-executive Director
Taylor Magenta – Non- executive Director
Marketing Team: Manager (full time) and 1 x marketing officer (part-time)
Summary of duties: promotion; design of marketing collaterals for events; social media; market research; public relations
front of office and back of office customer service activities (to include reception and response to enquiries)
support to academic staff
IT services: outsourced to an external company
Summary of duties: network service; database administration (inventory and staff files); maintenance and update of communication system including CRM (Customer Relationship management system); data management and security.
40% of the shares are held by an external corporation since late 2017, as a silent business partner
The remaining 9% is owned by other members of the Brown's family
We strive to provide exceptional business training that focuses on quality of teaching, practical learning, and successful outcomes
 Values
Respect for diversity
Innovation
ISO 31000 Risk Management
Australian Business Excellence Framework
Become market leader
Increase value for shareholders and clients
To increase revenue by 10% annually for the next 3 years
To increase profits by 10% annually for the next 3 years
To expand the offering to international students by repackaging accredited business courses to add an internship component during the course
Current positioning
MMI does not currently deliver courses overseas
The company is financially stable and sustainable
Learning Management System (Moodle)
Accounting Management System (MYOB) – does not interface with MMI system
Trainers work both on-site in Melbourne and around Australia
Senior management to stay in Melbourne: campus director and team leaders to be employed to manage and supervise Sydney's operations
Develop and implement sustainability policy and practices across the organisation, and sustainability has not been on the top five priorities of the company so far
All trainers are based in Melbourne; this impacts on financial costs when having to move trainers to other Australian capitals to conduct corporate training. Trainers who deliver corporate training receive a generous daily allowance when outside Melbourne ($250/day), all travel and accommodation expenses are paid for by MMI. This generous package impacts an average of 20% on the profit margin for each corporate course that is sold
(Source: https://popinnow.com/four-types-organizational-culture/ )
The organisation is top-heavy, and there are concerns that this may not suit the strategic objectives for growth and the opening of a second campus in Sydney.
The increased number of complaints due to lack of cultural sensibility of trainers when dealing with students from the non-Australian background (15% increase in the last 6 months alone)
All trainers are based in Melbourne; this impacts on financial costs when having to move trainers to other Australian capitals to conduct corporate training. Trainers who deliver corporate training receive a generous daily allowance when outside Melbourne ($250/day), all travel and accommodation expenses are paid for by MMI. This generous package impacts an average of 20% on the profit margin for each corporate course that is sold
Marketing
MMI has not heavily invested in marketing activities, relying mainly on word of mouth.
Heavy use of text
Infrequent updates
Yearly marketing budget: $75,000
The marketing team is small and not experienced in digital and social media marketing
Workforce Overview
Recruitment is done externally, few opportunities for advancement are offered to existing staff
A recent staff survey outlined the following:
Lack of well-defined sustainability policy
Diversity policy is very generic
Remuneration (average) for each role is as followed:
Board of Director – 25-50 k/year
Officers (including team members in the Marketing dept) $ 65k/year
Team Leader $ 78k/year
Superannuation is excluded and should be added at 10% to employee's ordinary earnings
Superannuation is paid to contractors (business trainers)
| Finance Department | ||||
|---|---|---|---|---|
| Job Role | Employment Status | Gender | Age | Notes |
| CFO | Ongoing – full time | M | 62 | |
| Financial Officers | Ongoing -full time | F-M | 24;32 | |
| Marketing Team | ||||
| Job Role | Employment Status | Gender | Age | Notes |
| Manager | Ongoing -full time | M | 58 | |
| Marketing Officer | Ongoing- part time; 0.5 FTE | M | 22 | |
| Social Media Officer | Ongoing- part time; 0.5 FTE | M | 21 | |
| Content Writer | Contractor | M | 24 | |
| HR Team | ||||
| Job Role | Employment Status | Gender | Age | Notes |
| Manager | Ongoing -full time | M | 54 | |
| HR Officer | Ongoing- part time; 2.5 FTE | M-F | 35;38 | |
| Client Services | ||||
| Job Role | Employment Status | Gender | Age | Notes |
| Manager | Ongoing-full time | F | 59 | |
| Receptionist | Ongoing part time (0.6 FTE) | F; M | 21;22 | |
| Client Service Officer | 1 F |
26,22,25,24 | ||
| Team Leader | Ongoing-full time | M | 31 | |
| Maintenance officer | Contractor | M | 42 | |
| Academic Services | ||||
| Job Role | Employment Status | Gender | Age | Notes |
| Manager | Ongoing-full time | M | 54 | The contractors also run their own business. |
| Contract Business Trainers | Contractors | 3 x M; 2 x F | Average 42 | |
| Business Trainers | Ongoing – full time | 2xM; 2x F | Average 36 | |
The Industry and the market
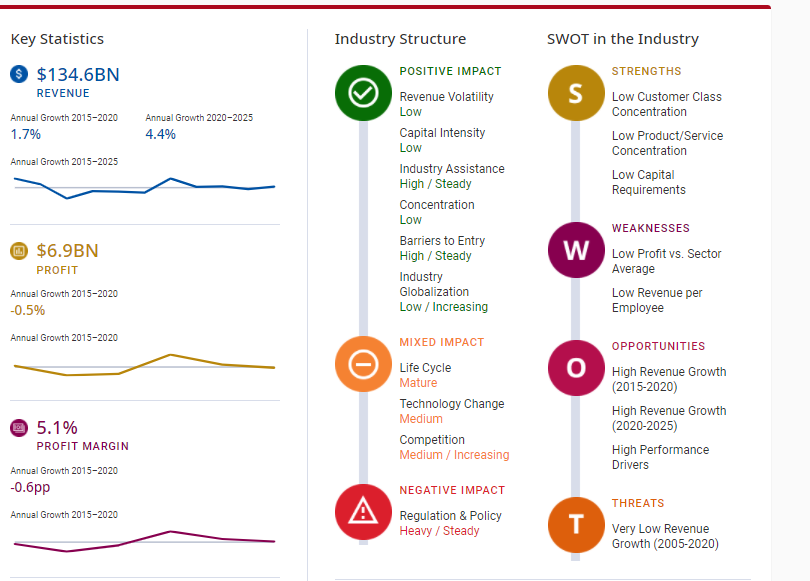
The Education and Training division has grown over the past five years.
Several factors have influenced the division's performance, including population growth, changes to government policy and funding, international student enrolments and labour trends. Population growth is the main demand driver for education, particularly in the demographic aged five to 18. Strong private school enrolment and tuition fee increases have also contributed to the division's expansion over the period. Furthermore, underlying demand for tertiary education has increased as more people upskill to compete in a tough job market. Overall, division revenue is expected to grow at an annualised 1.7% over the five years through 2019-20, to $134.6 billion. This trend includes an expected rise of 1.3% in the current year. Subdued growth in the current year is expected because of a forecast decline in international student enrolments, due to travel restrictions imposed after the COVID-19 outbreak in China.
The Preschool Education industry has grown significantly over the past five years, partly due to increased Federal Government funding from the Universal Access to Early Childhood Education scheme. The Council of Australian Governments (COAG) implemented the National Partnership Agreement on Early Childhood Education in 2008. This agreement aimed to provide all four-year-old children with access to 15 hours of preschool education for 40 weeks per year. COAG endorsed the second National Partnership Agreement on Early Childhood Education in 2013, reaffirming its commitment to universal access to preschool education. Over 2016 and 2017, the Federal Government allocated $840.0 million to the state and territory governments to support this goal. The Federal Government allocated a further $428.0 million to continue funding the Universal Access to Early Childhood Education program in 2018. An additional $453.1 million has also been allocated to extend Universal Access to Early Childhood Education until the end of 2020.
International student enrolments
Industry trends
Most industries in the division operate either using government funds or on a non-profit basis.
Classrooms and lecture theatres have increasingly incorporated new technology over the past five years, and digital platforms for learning and administration are now commonplace in the division. Increased technology adoption has boosted capital costs for division operators and caused depreciation expenses to rise as a share of revenue for many providers over the period. Use of new technology is expected to be ramped up in the current year, as operators aim to allow students unable to enter Australia to participate in classes remotely.
Industry Outlook
This model allocates funding according to a base rate per student, with additional funding provided to assist students with disabilities, low English proficiency, Aboriginal and Torres Strait Islander heritage, or socio-educational disadvantage. Loadings will also depend on a school's size and location. This additional funding is forecast to increase the resources available to public schools over the next five years, making them more competitive compared with private schools. The Quality Schools package is also projected to constrain revenue growth for some private schools over the period. Under the package, the base amount received per student will be discounted based on the capacity to contribute assessment for each school. This assessment measures a school's socio-economic status, calculated using the local socio-economic index derived from the most recent Australian Census data and students' residential addresses. Higher assessment scores will reduce the base amount of funding provided. Therefore, many elite private schools are projected to receive less government funding. However, increasing household discretionary incomes are forecast to support a continued rise in private school tuition fees over the next five years. Enrolments in preschools, and public and private schools, are anticipated to increase over the period, supporting division revenue growth.
In January 2017, the VET Student Loans scheme replaced the previous VET FEE-HELP program. The VET scheme is forecast to reduce the funding available to the VET sector over the next five years. This trend is due to a decreasing number of subsidised courses, stricter course eligibility requirements for students and lower caps for student loans. Research initiatives undertaken by universities will likely receive more funding over the period, supporting division revenue. However, the Federal Government has imposed a cap on funding for bachelor's degrees from January 2018 until 2020. From 2020 onwards, funding increases for bachelor's degrees will be linked to university performance, as well as growth in the population aged 18 and 64. These changes are anticipated to restrict growth in the University and Other Higher Education industry over the next five years.
Demand for tertiary education is anticipated to grow over the next five years, driven by increases in the population aged between 18 and 25, and a rising secondary school retention rate.
Formal qualifications are increasingly required for entry-level positions in the national workforce, supporting future enrolments in tertiary education. However, profitability is forecast to decline for the Art and Non-Vocational Education industry over the next five years, limiting growth in division profit margins.
The chart has 1 X axis displaying Year. Range: 2019.95 to 2025.05.
The chart has 1 Y axis displaying Percentage (%). Range: 0 to 8.
Industry Life Cycle
LIFE CYCLE REASONS
Industry value added is growing primarily due to increasing government funding
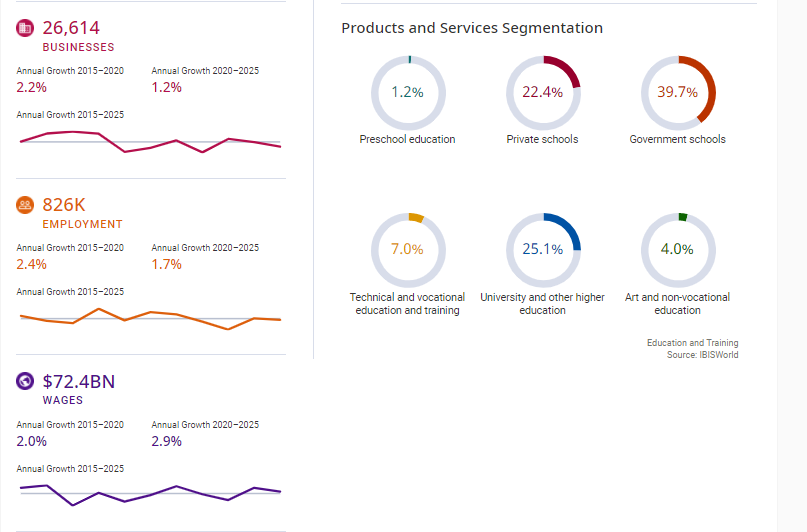
Education levels range from preschool to university and other higher education. The Government Schools industry is the largest industry operating in the division and the Sports Instructors industry is the smallest.
Government schools
This segment shifted to a demand-driven model with the removal of caps on undergraduate course places in 2012, causing domestic student enrolments to rise. However, enrolments in postgraduate diplomas and undergraduate courses other than bachelor's degrees have declined, placing downward pressure on revenue for this industry. Growth in international student numbers have driven this segment higher as a share of division revenue over the past five years. However, the decline in international student enrolments in the current year because of the travel restrictions implemented to halt the spread of COVID-19 are expected to reduce the segment's contribution to division revenue in the current year.
Private schools
An influx of registered training organisations and online providers has caused industry competition to intensify over the past five years, placing downward pressure on prices for technical and vocational education courses. Additionally, in 2017 the Federal Government replaced the VET FEE-HELP system with the more stringent VET Student Loans program. This program reduced the number of subsidised VET courses and introduced stricter eligibility requirements for students and providers. The Technical and Vocational Education and Training industry's share of division revenue has fallen over the past five years, due to revenue declines in this industry.
Art and non-vocational education
These programs educate children aged three through five, and are conducted by public, private and community providers. The Preschool Education industry's share of division revenue has slightly increased over the past five years, primarily due to growth in government funding. The Universal Access to Early Childhood Education program has worked to improve the quality and consistency of preschool education by setting compulsory national standards. As part of the program, the Federal Government aimed to have all children aged four attend 15 hours of preschool education for 40 weeks each year. Increased government funding and rising enrolment numbers have boosted revenue for preschool education over the past five years.
Sports instruction
To a lesser extent, demand for educational services is also affected by exchange rate movements and immigration policy, which influence international student enrolment. Schooling for children aged between six and 16 is compulsory, with some variation among the states and territories. The population's age distribution affects demand for different levels of education. An increase in births raises the demand for preschool and primary school services in the following four to five years. As these individuals grow older, demand for education shifts to the secondary level.
In an increasingly knowledge-based economy, more occupations now require higher education qualifications. This trend has boosted demand for TAFE and university courses over the past five years. Changes in the mix of skills and occupations required by various industries influence demand for education. Mature-age individuals are returning to education due to shifting workforce skill requirements. A growing skills mismatch and poor supply of labour in certain industries have prompted government responses to close the labour gap. The introduction of technology into many different fields of work has stimulated demand for training in new processes. This trend has particularly benefited TAFEs over the past five years. Government support for students in post-school education, such as TAFE and university, also encourages students to stay in school. Conversely, a low and falling unemployment rate may encourage high school students to enter the workforce after exiting high school instead of undertaking further study.
Imports Low and Steady
While the Education and Training division does not directly participate in international trade, fees paid by international students represent export revenue for education providers. This revenue derives from education services delivered both onshore at Australian campuses and offshore via the internet, correspondence, or Australian institutions located overseas. Universities and TAFEs are most vulnerable to declining international student numbers as they heavily rely on this market for revenue. International enrolments in Australian education surged at the beginning of the decade but started to decline in 2010. Various factors were responsible for the weaker demand, including the effects of the global financial crisis, an appreciating Australian dollar, visa and immigration changes and more aggressive recruitment from competitor markets, such as the United States, the United Kingdom and Canada. However, the number of international students has risen over the past five years, due to a relaxation of student visa requirements and the depreciation of the Australian dollar.
The Education and Training division exhibits low level of market share concentration, with the four largest operators expected to account for less than 40% of industry revenue in the current year. Industries in the Education and Training division typically feature many small operators that do not have a dominant market share. The division's three largest players are the NSW Department of Education, the Department of Education and Training Victoria, and the Queensland Department of Education and Training. The Private Schools industry exhibits higher concentration than the Government Schools industry, as private schools typically charge higher fees and tuition, boosting their revenue and market share. The Preschool Education industry displays low market share concentration as it mainly consists of community-based organisations.
The University and Other Higher Education industry's market share concentration is low, but high compared with the rest of the division. This higher concentration is due to government policy and historical development. In comparison, the Technical and Vocational Education and Training industry is dominated by the different state governments which run separate TAFE systems. This industry's market share concentration has fluctuated over the past five years in response to changing government funding structures and revenue from international student fees.
In 2016, training activity was reported by 4279 training providers, with registered training organisations accounting for nearly all training activity
it is estimated there were 4.2 million clients enrolled in VET with an Australian training provider in 2016, a 4.9% increase from an estimated 4.0 million in 2015
Workplace training and assessment was another area of job ad growth for December, with SEEK ads up by 17% year-on-year. "That area of our business has certainly been busy and we're seeing a lot of in-house workplace training roles," says Jones. "Training is still quite high on the agenda for many organisations at the moment, which is good news for candidates across most industries."
Jo ads for early childhood teaching roles were also up by 12% year-on-year and adult education was on the rise. Tertiary teaching roles grew by 11% compared to the same time last year and vocational teaching increased by 2% over the same period.
One in two (50.5%) men participated in 2005, decreasing to 45.1% in 2013 and then to 39.4% in 2016-17. Women's participation rate was relatively stable between 2005 (47.2%) and 2013 (47.7%) but then fell to 42.3% in 2016-17.
Participation in formal and/or non-formal learning in 2016-17 was higher for people who were working or unemployed (in the labour force) (46.1%) than for those not in the labour force (28.1%). However, participation by people in the labour force has decreased from the rates recorded in 2005 (59.1%) and then in 2013 (53.1%) to 46.1% in 2016-17. In comparison, participation by people not in the labour force increased from 2005 (25.2%) to 2013 (29.9%) but then decreased in 2016-17 (28.1%).
Top 20 most-needed roles in Australia: https://www.seek.com.au/career-advice/article/australias-most-needed-jobs
20 Skills in Demand in Today's Workforce: https://www.indeed.com/career-advice/finding-a-job/in-demand-skills