
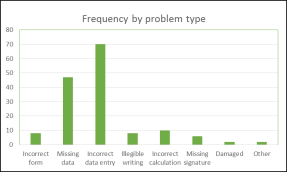
The check sheet custom designed the user
1
|
|---|
3
1
7 |
|---|
9
3
10
Location Diagram |
|---|
11
1/31/2021
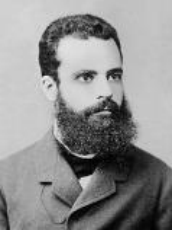


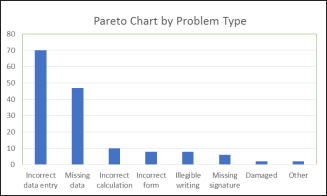
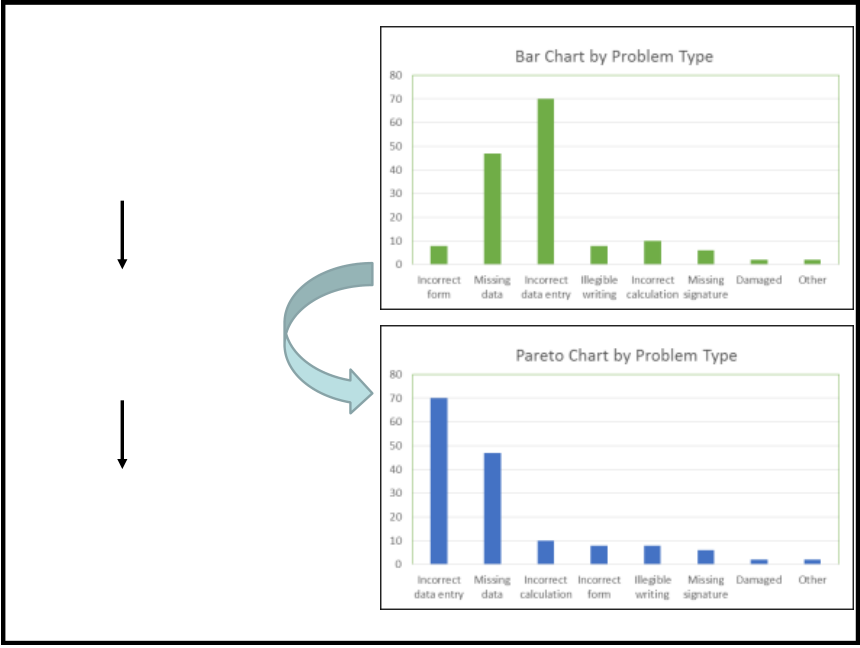
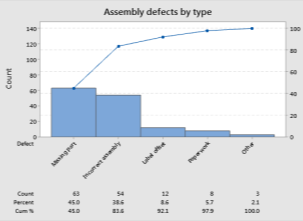
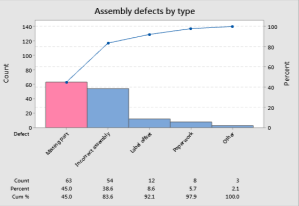
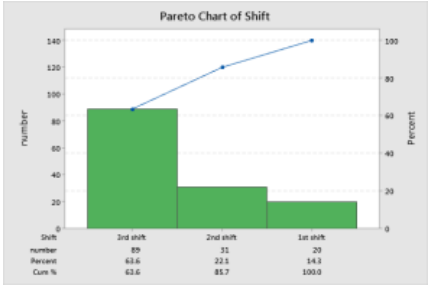
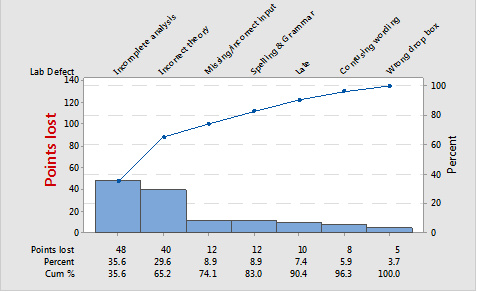
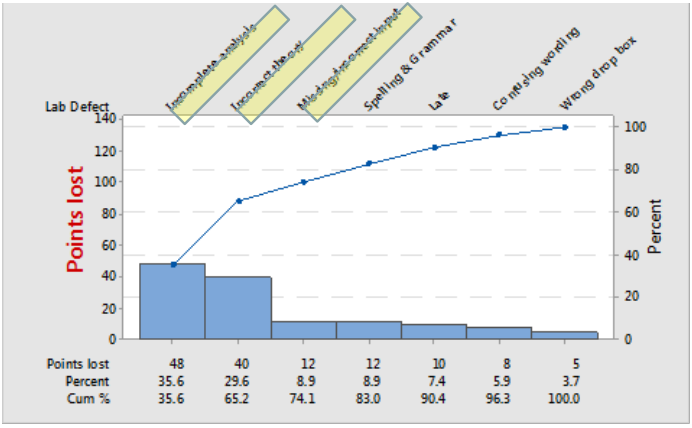
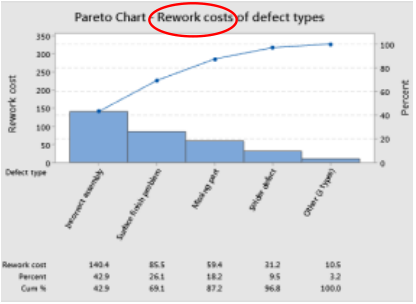
The Pareto Principle |
|---|
1/31/2021
Applications of the
| Trivial | 85% | |
|---|---|---|
| Many |
25% of
complaints
17 |
|---|
18 |
|---|
19
|
||||||||||||
|---|---|---|---|---|---|---|---|---|---|---|---|---|
|
|---|
1/31/2021
25
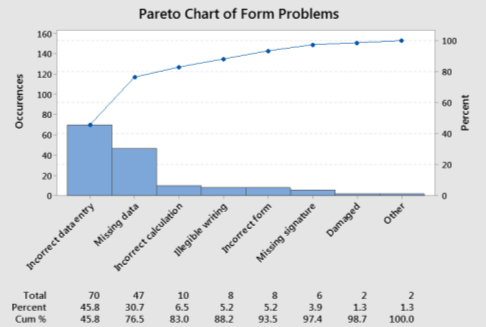
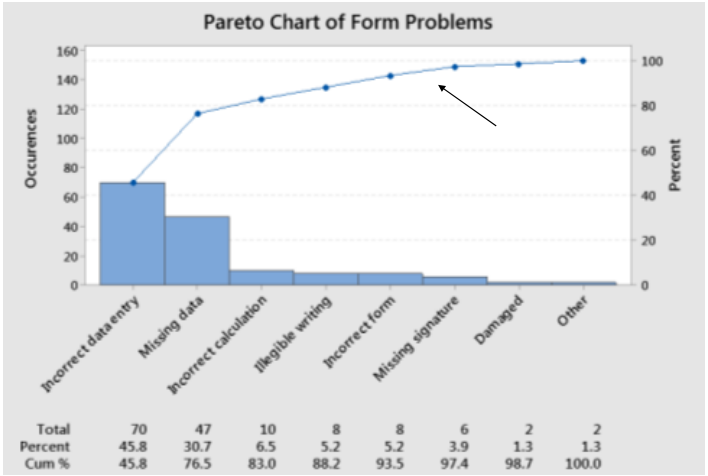
Cumulative line 27 |
|---|
Trivial Many 29 |
|---|
1/31/2021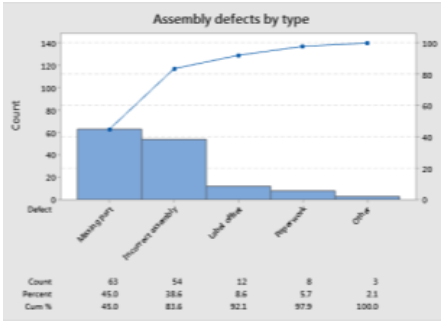


|
|---|
1/31/2021
34
|
|---|
|
|---|
37
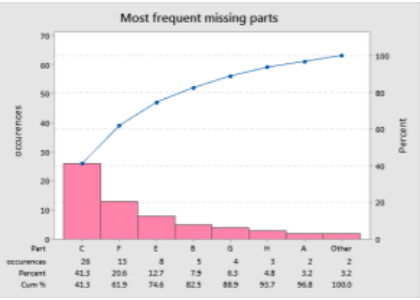
Use an appropriate measure 38 |
|---|
38
1/31/2021

|
|---|
|
|---|
43
| Please see Syllabus for related assignments. |
44