
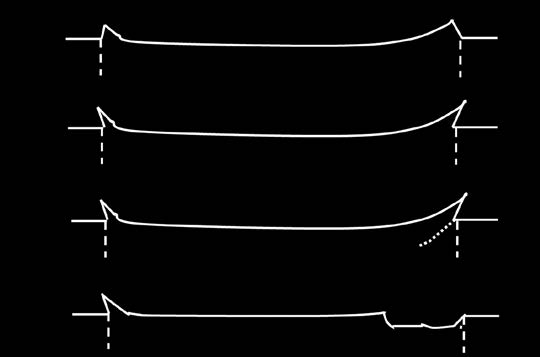
The sem images showthe similar grain-boundary shape ldi ero-sion
| EROSION OF A SOLID SURFACE can be | resulting in the generation of an expansion |
|
|---|
| (b) | Shock wave | Jetting |
|
(d) |
|
(e) | |||||||||
|---|---|---|---|---|---|---|---|---|---|---|---|---|---|---|---|
| the | material | surface | (Fig.15c | and | d |
|
|||||||||
|
|||||||||||||||
Liquid Droplet Impingement Erosion / 765
| LDI Erosion Rate | index n ranges from 6 to 7.4 in waterjet tests | |||||||
|---|---|---|---|---|---|---|---|---|
| (Ref 29) and from 6.6 to 7.0 in spray tests | ||||||||
| In predicting the lifetime of pipe-wall thin- | (Ref 30, 31), while it shows a lower value, n = | |||||||
| 2 to 6 (Ref 25, 27), for the spray test. One reason | ||||||||
| ning of nuclear/fossil power plants, the erosion | ||||||||
| for this difference is that power index n may | ||||||||
| rate is an important factor to be considered. | ||||||||
| come from the influence of the liquid film and | ||||||||
| Therefore, several experimental studies were |
|
|||||||
| the accuracy of the measurement of droplet | ||||||||
| carried out in the literature for various ranges |
|
|||||||
| velocity, while the experimental condition, such | ||||||||
| of droplet velocity, diameter, and wall materi- | ||||||||
| as the droplet diameter and material itself, may | ||||||||
| als, which are summarized in Table 1. It is | ||||||||
| change the power index (Ref 35). It is expected | ||||||||
| noted that the power index, n, in Table 1 comes | ||||||||
| that the experiments with relatively thicker liq- | ||||||||
| from the erosion-rate formulation Vm ~ Vn. | ||||||||
| uid film will result in a larger power index value. | ||||||||
| The rotating-disk test of LDI shows the power |
|
|||||||
| This result agrees qualitatively with the numeri- | ||||||||
| index n = 5.8 (Ref 22), which is approximately |
|
|||||||
| cal results (Ref 11), in which the power index | ||||||||
| equal to the theoretical value of 5 (Ref 23). How- | ||||||||
| increases from 5.3 to 7.7 with increasing liq- | ||||||||
| ever, a bit higher power index, n = 6 to 8, is | ||||||||
| uid-film thickness on the material surface. These | ||||||||
| observed in other rotating-disk testing (Ref 24). | pure | (A1070), | aluminum | |||||
| experimental erosion-rate results indicate that | ||||||||
| It is noted that the minor influence of the liquid |
|
|||||||
| power index n scatters in the range 2 to 8 due | ||||||||
| film can be observed in this type of experiment, | mild | steel | (SS400), | and |
|
steel | ||
| to the influence of experimental conditions | ||||||||
| because of the high centrifugal forces in the | ||||||||
| rotating-disk test. On the other hand, the power | ||||||||
| Crack | |||
|---|---|---|---|
|
|||
|
|||
| Fig. 2 | ||
|---|---|---|
| Table 1 |
Droplet velocity
| 6–8 (terminal stage) | Rotating disk | 1310, 1575 | 195–269 | 12Cr steel, cobalt-base alloy, titanium alloy | ||
|---|---|---|---|---|---|---|
| speed) | (rotating speed) |
sampling method
| 3.3–5 | 366–580 | 1200–1900 | 90 | X20Cr13, X5CrNiMoCuNb 14-5, | Ref 26 | |
|---|---|---|---|---|---|---|
| 5.5–6 (<100 m/s, or 330 ft/s)2–3 |
|
|
280–840 | Ref 27 | ||
| 45–130 | MgO, Al2O3, Si3N4, SiC, ZrO2, GS, TiN, | |||||
| 410J1 |
sampling method
Table 2 Power index, n, for droplet velocity dependence
| Material | n (D = 1.5 mm, or 0.06 in.) | n (D = 2.5 mm, or 0.10 in.) |
|---|---|---|
| A1070 | 7.0 (±0.4) | 7.4 |
| A5056 | 9.0 (±0.5) | 8.9 |
| C3604 | 5.6 (±0.9) | 4.9 |
| SS400 | 7.0 (±0.4) | 6.8 |
| S20C | 6.6 (±0.5) | 7.0 |
| Average | 7.0 | 7.0 |
Source: Ref 34
| erosion | depth, | the | erosion | rate |
|
|
Present (a = 3.52, b = 0.5) | |
|---|---|---|---|---|---|---|---|---|
| sharply, and the gradient of the erosion rate | ||||||||
| decreases gradually with further increasing of | ||||||||
| Sasaki et al. (2016) | ||||||||
| the erosion depth. In the asymptotic condition | ||||||||
| of erosion depth larger than 5 mm (0.2 in.), | Xiong et al. (2010) | |||||||
| the erosion rate approaches almost zero. This | Present (100 m/s) | |||||||
| indicates that erosion is highly damped by the | ||||||||
| Present (200 m/s) | ||||||||
| effect of the liquid pool in the deep cavity, | ||||||||
| and erosion cannot proceed further. | Present (300 m/s) | |||||||
| of surface roughness on LDI erosion and the | Fig. 5 | Variation of damping coefficient, Z, with nondimensional liquid-film thickness, k. Note that the range |
|---|---|---|
| complexity of the erosion mechanism of the | ||
| bar indicates the minimum to maximum of Z in Sasaki et al. (2016) in the velocity range from 100 to | ||
| wall material under the combined influence of | ||
| surface roughness and liquid film. However, |
| This result indicates that the influence of sur-face roughness is to reduce the incubation |
|---|
as the liquid-film thickness prevailing over
| the wall material. | Fig. 6 |
|
|---|---|---|
| Kirols et al. carried out an SEM observation |
| roughness (D/d = 0.5) of the V-groove is | Fig. 7 |
|---|
sandpaper grit number
| Sandpaper grit number | Dmax, mm |
|---|---|
| 30 50 100 500 1000 Smooth |
shown in Fig. 8, which shows SEM images of
| the V-groove after the start of the erosion test. | Fig. 8 | Scanning electron microscopy observation of single V-groove of small relative roughness (D/d = 0.5). |
|---|---|---|
| The groove depth is D = 15 mm and the width | ||
| is 30 mm, while the droplet diameter is d = 30 | ||
| mm (see the scale bars on the images). After |
| be mentioned that there were several microme- | ||
|---|---|---|
| ter-order grooves on the smooth surface due to | ||
| the milling machine surface tracers, although |
they did not influence the erosion pattern. This
| Flow meter |
|
|
T | P | T | Q | 2. Cooling system (wetness control) | ||
|---|---|---|---|---|---|---|---|---|---|
| Q |
|
||||||||
|
|||||||||
| Heat exchanger | |||||||||
| Wet steam |
|
|---|
placed downstream of the orifice. The diameter
of the bent pipe was approximately 150 mm
(6 in.), and the thickness was 7.1 mm (0.28
in.). The details of the piping geometry and
flow conditions of the vent line are summar-
| Table 4 |
|
|
|---|---|---|
| Equation of empirical model | Reference | |
| log(Re) = 4.8log(V) + 0.67log(d) � log(NER) + ch Re: rationalized erosion rate |
|
|
| ec: critical strain to fracture of oxide layer (Ref 61) T.R. = ci q
HV�2.75V2 q: droplet flow rate |
|
|---|
HV: Vickers hardness
V: velocity
Condenser
| 11 mm |
|---|
Orifice
| Morita and Uchiyama (2011) | Fig. 11 | Geometry of steam vent line in Japanese | |
|---|---|---|---|
|
power plant and erosion-hole geometry. | ||
| T.R. = cm qHV�2.75V2fm(h/d) |
|
||
| (Ref 56) |
770 / Wear Failures
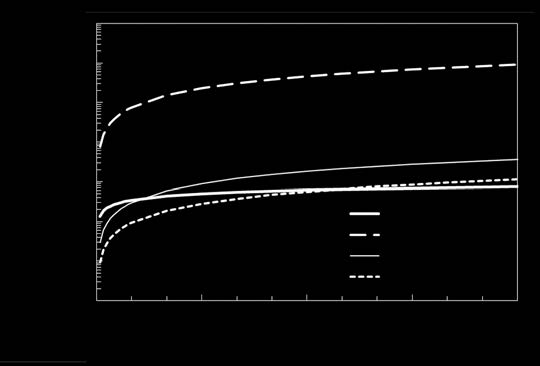
| or 920 ft/s) at the orifice, which is due to the | higher power index of the velocity and no liq- | |||||||||||
|---|---|---|---|---|---|---|---|---|---|---|---|---|
| entrainment of condensed water droplets from | uid-film effect. This resulted in much higher | |||||||||||
| the heater. These conditions resulted in erosion | erosion in the numerical prediction. The pre- | |||||||||||
| on the first elbow downstream of the orifice and | dictions by Morita and Uchiyama (Ref 56) | |||||||||||
| then led to the pinhole leak. An enlarged view | and Fujisawa et al. (Ref 36) showed a lower | |||||||||||
| in Fig. 11 shows the geometry of the erosion hole | erosion rate than the others. This may be due | |||||||||||
|
||||||||||||
| in the elbow. This hole was situated at an angle | to the influence of the liquid film, which was | |||||||||||
|
||||||||||||
| of 42�from the elbow inlet and had dimensions | ||||||||||||
| of 11 mm (0.43 in.) in the axial direction and | ||||||||||||
| 9 mm (0.36 in.) in the circumferential direction | ||||||||||||
|
||||||||||||
| of the elbow. Note that the inner surface around | ||||||||||||
|
||||||||||||
| the hole showed a sawtoothlike pattern spread | ||||||||||||
| over the outer bent wall. | ||||||||||||
| The numerical prediction of erosion in the | occur at the location of high-speed steam flow | |||||||||||
| pipeline was carried out by Fujisawa et al. | with a flow direction change, such as an elbow, | |||||||||||
|
||||||||||||
| (Ref 49), who showed the erosion-rate distri- | downstream of a valve and orifice, or at a | |||||||||||
|
||||||||||||
| butions of this flow geometry. The prediction | T-junction. Moreover, even if the flow is a sin- | |||||||||||
| was carried out using various empirical erosion | gle-phase water flow, droplet impingement | |||||||||||
| models, such as Heymann (Ref 22), Isomoto | may occur downstream of the valve or orifice | |||||||||||
| and Miyata (Ref 25), Morita and Uchiyama | due to flashing when the local pressure is | |||||||||||
| (Ref 56), and Fujisawa et al. (Ref 36). In the | lower than the vapor pressure. Erosion-rate | |||||||||||
|
||||||||||||
| numerical simulations, the flow fields were | prediction is becoming an important tool | |||||||||||
|
||||||||||||
| because | it | can | provide | the | location | and | ||||||
| evaluated from three-dimensional single-phase | ||||||||||||
| expected erosion depth in advance. How to | ||||||||||||
| numerical simulations with the aid of a stan- | ||||||||||||
| avoid erosion initiation and further develop- | ||||||||||||
| dard k-e turbulence model, and the droplet | ||||||||||||
| ment of the erosion rate in the pipeline is the | ||||||||||||
| parameters, such as the droplet velocity, num- | ||||||||||||
|
||||||||||||
| ber density, and impingement angle, were | ||||||||||||
|
||||||||||||
| evaluated from the flow computation. It is | ||||||||||||
| velocity (flow rate) is highly effective, because | ||||||||||||
| noted that the influences of droplet velocity | ||||||||||||
| the velocity (flow rate) is the most influential | ||||||||||||
| dependency, material hardness, and liquid-film | ||||||||||||
| parameter on the erosion rate. This can be car- | ||||||||||||
| thickness are major differences among these | ||||||||||||
| ried out by increasing the pipe diameter. |
|
|||||||||||
| empirical models, and all are considered in | ||||||||||||
| Decreasing the steam wetness (number density | ||||||||||||
| the models of Morita and Uchiyama (Ref 56) | ||||||||||||
| and Fujisawa et al. (Ref 36). | of the droplet) by installing a separator or | |||||||||||
| Figure 12 shows a comparative study of the | heater is another effective suppression method |
|
||||||||||
| prediction results of maximum erosion depth | for LDI erosion; this is because of the decrease | |||||||||||
| in the elbow for various empirical models. | in droplet collision frequency. For a practical | |||||||||||
| All of the results indicate that the erosion | countermeasure, a change in piping layout near | |||||||||||
| depth | increases | gradually | with | increasing | the collision location, for example, installation | |||||||
| elapsed time; however, the absolute values | of a target plate or thicker piping element, is | |||||||||||
|
||||||||||||
| clearly deviate from each other. Heymann’s | effective in decreasing the leak frequency due | |||||||||||
|
||||||||||||
| model (Ref 22) indicated an erosion rate that | to LDI erosion. A change of material can also | |||||||||||
| was much higher than those of the other mod- | act to decrease the erosion rate; however, it is | |||||||||||
| els, which may be due to the assumption of a | ||||||||||||
and Prof. M. Medraj (Concordia University)
is also acknowledged. This work was carried
out during the first author’s stay at Brown Uni-
Book of ASTM Standards, ASTM Interna-
| Fig. 12 |
|
|---|
| 46. V.N. Varavka and O.V. Kudryakov, Regu- |
|
|||||||||||||||
|---|---|---|---|---|---|---|---|---|---|---|---|---|---|---|---|---|
|
||||||||||||||||
|
||||||||||||||||
|
52. M.H. Keegan, D.H. Nash, and M.M. Stack, | |||||||||||||||
| J. Friction Wear, Vol 36, 2015, p 71–79 | ||||||||||||||||
| 47. V.N. Varavka and O.V. Kudryakov, Regula- |
|
|||||||||||||||
|
D, Appl. Phys., Vol 46, 2013, p 383001 | |||||||||||||||
| 53. A. Sareen, C.A. Sapre, and M.S. Selig, | IEEE Power | 1987, | ||||||||||||||
|
|
|||||||||||||||
| Friction Wear, Vol 36, 2015, p 153–162 | ||||||||||||||||
| 48. R. Morita, K. Yoneda, and F. Inada, |
|
|||||||||||||||
|
54. A. Castorrini, A. Corsini, F. Rispoli, P. | |||||||||||||||
| Liquid | Droplet | Impingement | Erosion, | |||||||||||||
|
60. F.A. | McClintock | and |
|
Argon, | |||||||||||
| 49. N. Fujisawa, K. Wada, and T. Yamagata, |
|
|||||||||||||||
| Numerical | Analysis | of | Wall-Thinning | 55. B. Amirzadeh, A. Louhghalam, M. Raessi, |
|
|||||||||||
|
|
|||||||||||||||
| Mechanical | ||||||||||||||||
| 50. Y.M. Ferng, Predicting Local Distribu- |
|
|
||||||||||||||
| 56. R. Morita and Y. Uchiyama, Development |
|
|||||||||||||||
|
||||||||||||||||
| Droplet | Impingement | Erosion, | ASME | |||||||||||||
| 51. K. Yoneda, R. Morita, K. Fujiwara, and F. |
|
|
||||||||||||||