
This analysis helps determine the total quantity and total sales all products the basis state
Sales Transactions Analysis
Report Q2: Amount spent on each shopping week
| CUST_LIFESTAGE | TOTAL SPEND |
|---|---|
| $17,194.16 | |
| OA | $5,805.45 |
| OF | $3,097.99 |
| OT | $12,821.90 |
| PE | $3,123.07 |
| YA | $5,987.48 |
| YF | $9,547.96 |
Report Q3: Total quantity sold and total sales of each product in each state
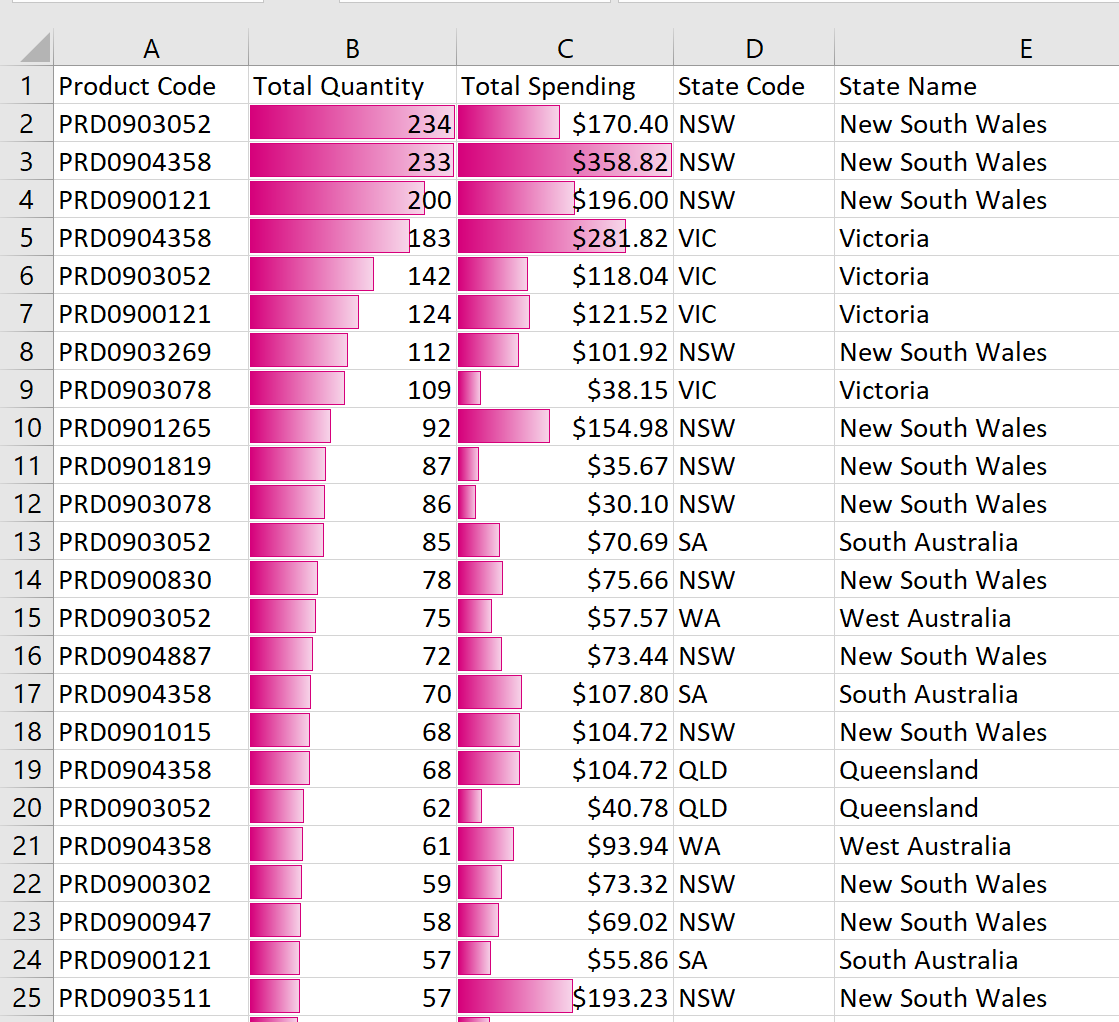
Analysis of total quantity and total sales (or spending) of each product in each state with 12785 products. This analysis helps to determine the total quantity and total sales of all products on the basis of state. The figure above only represents top 25 of the quantities sold and the total sales for the product in accordance to states. Additionally, it indicates that the majority of sale of among the top 25 items were in New South Wales as compared to other states. It can be determined that PRD0903052 had the highest quantity sold (234) meanwhile PRD904358 generated the highest sales ($358.82) both in New South Wales. However, if we take a look at the detailed report 5913 items was sold only once.
Transactions: Sample
Sales Transactions Analysis
Transactions: Sample
Sales Transactions Analysis
| Row | Unique Customers | STORE_REGION |
|---|---|---|
| 1 | 1857 | W01 |