
Total maximum daily load for phosphorus lake macatawa
PROJECT CLARITY
2020 Annual Monitoring Report
(Dec. 2019 – Nov. 2020)
January 2021
Project Clarity is a large-scale, multidisciplinary, collaborative watershed remediation project aimed at improving water quality in Lake Macatawa. A holistic approach that includes wetland restoration, in-stream remediation, Best Management Practices (BMPs), and community education is being
implemented as part of a multimillion-dollar public-private partnership. The project is expected to have many economic, social, and ecological benefits – while achieving the ultimate goal of improved water quality in Lake Macatawa.Lake Macatawa is the terminus of a highly degraded watershed and has exhibited the symptoms of a hypereutrophic lake for more than 40 years (MWP 2012, Holden 2014). Extremely high nutrient and chlorophyll concentrations, excessive turbidity, low dissolved oxygen, and a high rate of sediment deposition has made it one of the most hypereutrophic lakes in Michigan (MWP 2012, Holden 2014).
2
additional information generated by AWRI that is related to the
monitoring program (A: fish monitoring in Lake Macatawa; B: iron slag
filter study; C: the Lake Macatawa dashboard; and D: wetland
monitoring).
Water quality monitoring in the lake was conducted at 5 sites during spring, summer, and fall 2020 (Table 1, Fig. 1). Although spring sampling historically occurs in early to mid-May, 2020 spring sampling was delayed until mid-June due to COVID-19. The sampling sites correspond with Michigan Department of Environment, Great Lakes & Energy (EGLE formerly MDEQ) monitoring locations to facilitate comparisons with recent and historical data. At each sampling location, general water quality measurements (DO, temperature, pH, specific conductivity, TDS, ORP, turbidity, chlorophyll a [chl a], and phycocyanin [cyanobacterial pigment]) were taken using a YSI 6600 sonde at the surface, middle, and near bottom of the water column. Water transparency was measured as Secchi disk depth. Water samples were collected from the surface and near-bottom of the water column using a Van Dorn bottle and analyzed for SRP, TP, NO3-, NH3, TKN, and chl a. Samples also were taken for phytoplankton community composition and archived for possible future analysis.
Water for SRP and NO3- analyses was syringe-filtered through 0.45-μm
membrane filters into
scintillation vials; SRP was refrigerated at 4°C and NO3- frozen until
analysis. NH3 and TKN were acidified with sulfuric acid and kept at 4°C
until analysis. SRP, TP, NH3, NO3-, and TKN were analyzed on a SEAL AQ2
discrete automated analyzer (U.S. EPA 1993). Chl a samples were
filtered through GF/F filters and frozen until analysis on a Shimadzu
UV-1601 spectrophotometer (APHA 1992). Any values below detection were
calculated as ½ the detection limit for the purposes of analysis.
High Sensitivity, which is not as sensitive an assay as using
High-Performance Liquid Chromatography (HPLC) but serves as a useful
screening tool if microcystin is present in the lake. This kit has a
greater detection limit than the QuantiTubes that were used in 2017 but
still ranks below the HPLC for sensitivity. Advisories for microcystin
consumption have been developed by the World Health
Organization (WHO) and US EPA. For drinking water, the WHO advisory is
triggered when microcystin concentrations >1 μg/L and the EPA
advisory is >1.6 μg/L; for recreational use, WHO is >20 μg/L and
EPA is >2 μg/L. Since Lake Macatawa is used only for recreation, we
applied the latter two criteria.
Table 1. Location and 2020 water column seasonal mean depth at Lake Macatawa long-term monitoring locations.
| Site | Latitude | Longitude | Depth (m) |
|---|---|---|---|
| 1 | 42.7913 | -86.1194 | 8.8 |
| 2 | 42.7788 | -86.1525 | 5.9 |
| 3 | 42.7872 | -86.1474 | 4.4 |
| 4 | 42.7755 | -86.1822 | 10.9 |
| 5 | 42.7875 | -86.1820 | 5.2 |
4
intensive) watershed models are often used for this kind of analysis, but developing those models was outside our scope of work. Rather, we took a coarse-level approach to look at how TP concentrations near the Middle Macatawa restored wetland and in Lake Macatawa compared with precipitation amounts from the Tulip Airport in Holland using data from NOAA’s National Centers for Environmental Information (NCEI, formerly the National Climatic Data Center), and Weather Underground. Linear regressions on P and precipitation amount were conducted in Microsoft Excel.
Figure 2. Locally weighted scatterplot smoothing (LOWESS) trend analyses of summer DO site data from Lake Macatawa. Only the most recent 7 years of data (2014-2020) are used for each seasonal LOWESS due to regression-fitting software limitations; excluded data (2013) are noted as hollow circle symbols. Sites 1, 2, and 4 (panel A) represent the main flow of Lake Macatawa via the Macatawa River watershed and additional sites (panel B) incorporate conditions in the lake’s northern Big Bay and Pine Creek Bay.
Surface water SRP was highest in spring at site 1 (21 μg/L) and at near-bottom depth in summer at sites 1 and 4 (28 and 33 µg/L; Fig. 3A,B). Measured TP concentrations often exceeded the 50 μg/L TMDL recommendation at surface depth and showed a slightly increasing seasonal trend, generally ranging 47-112 μg/L (Table 3, Fig. 3C). The seasonal increase was stronger for Bottom TP, with spring ranging 15-42
Table 2. Lake-wide means (1 SD) of select general water quality parameters recorded during 2020 monitoring year. Within 2020, “n” is the number of lake sites composing the seasonal mean at each depth. Data are shaded for readability. Dates of sampling events: 6/19/2020; 7/23/2020; 10/20/2020. Total dissolved solids (TDS) sensor was inoperative during Spring 2020 sampling.
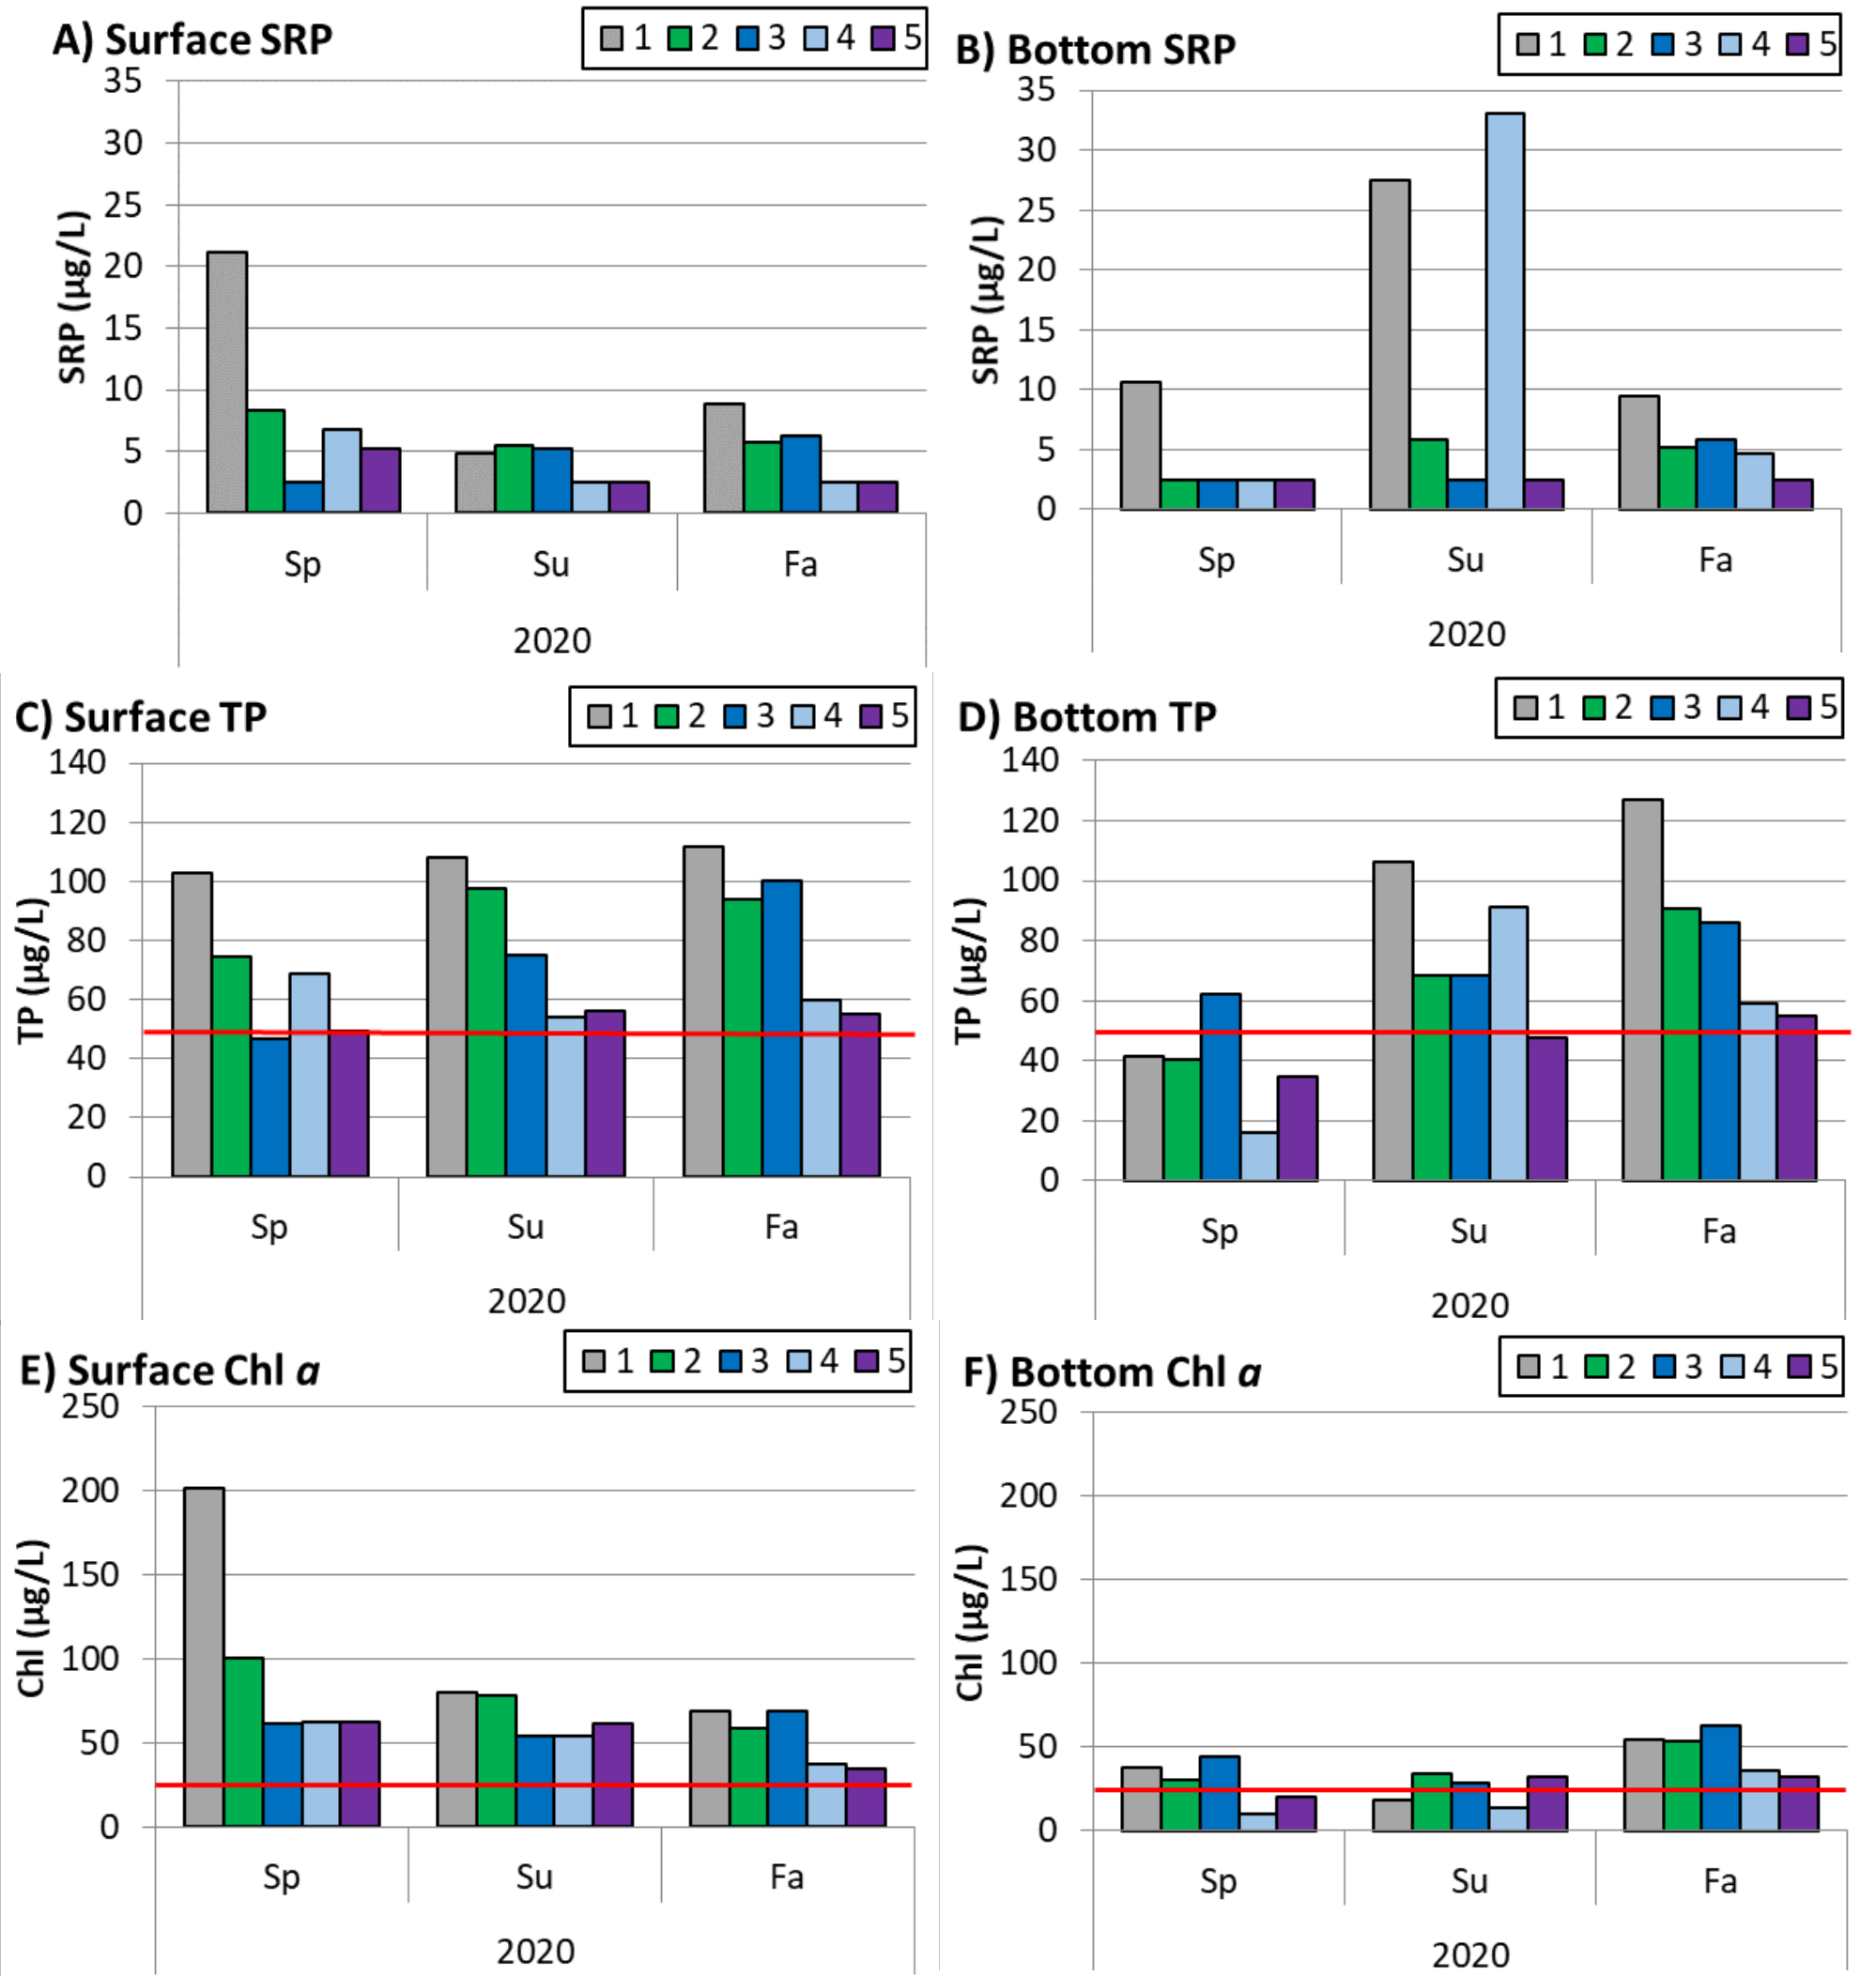
Figure 3. Soluble reactive phosphorus ([SRP]: A, B); total phosphorus ([TP]: C, D); and chlorophyll a ([chl a]:E, F) concentrations measured at the 5 monitoring stations in Lake Macatawa during 2020. The red horizontal lines on TP figures (C, D) indicate the interim total maximum daily load (TMDL) goal of 50 μg/L (Walterhouse 1999). The red horizontal lines on chl a figures (E, F) indicate the hypereutrophic boundary of 22 μg/L used by EGLE for assessing chl a in Lake Macatawa (Holden 2014). Note scales change on y-axes. COVID-19 delayed Spring 2020 sampling from May until June.
See Table 2 for dates of sampling events. Note different units for the analytes.
| Season | Depth | n |
|
NO3- (mg/L) | NH3 (mg/L) | TKN (mg/L) | Secchi Depth (m) |
||
|---|---|---|---|---|---|---|---|---|---|
| Surface | 5 | 9 (7) | 68 (23) | 0.78 (0.19) | 0.01 (0.01) | 1.49 (0.63) | 98 (61) | 0.7 (0.1) | |
| Bottom | 5 | 4 (4) | 39 (17) | 0.72 (0.18) | 0.15 (0.13) | 0.86 (0.37) | 29 (13) | ||
| Summer | Surface | 5 | 4 (1) | 78 (24) | 0.28 (0.08) | 0.15 (0.24) | 1.26 (0.38) | 66 (13) | 0.6 (0.1) |
| Bottom | 5 | 14 (15) | 76 (23) | 0.20 (0.07) | 0.44 (0.40) | 1.07 (0.41) | 25 (9) | ||
| Surface | 5 | 5 (3) | 84 (25) | 0.26 (0.13) | 0.31 (0.32) | 1.00 (0.32) | 54 (17) | 0.6 (0.2) | |
| Bottom | 5 | 6 (3) | 84 (29) | 0.27 (0.13) | 0.34 (0.36) | 1.03 (0.40) | 48 (13) |
3.2 Pre- vs. Post-Restoration Comparison
As noted in prior reports, it is likely that it will take a considerable period of time before lake water quality responds on a consistent basis to actions taken in the watershed. This is because lakes have a built-in resistance to change (cf. Abell et al. 2020), which is influenced by: 1) the lake’s hydraulic residence time (those with shorter residence times respond faster); 2) the quantity, quality, and location of implemented management interventions in the watershed; and 3) the importance of internal nutrient loading in the lake. Given that watershed-based management changes are both recent and at a relatively small scale in the Macatawa watershed, it is not expected that Lake Macatawa water quality will respond quickly. Nonetheless, it is important to begin measuring change to establish baselines and evaluate trends.
Chl a at the surface has increased during the post-restoration period based on our limited sampling (P=0.05; Table 4, Figs. 5E, 7E), although no differences were detected in the near bottom samples (P=0.573; Figs. 5F, 7F). The increase in surface chlorophyll is consistent with a reduction in sediment loading, as greater light transmittance in the water column will allow more photosynthesis and algal growth. Of course, as algae bloom, they eventually will reduce water clarity due to the abundance of their own cells in the water column, but until that point, water transparency will improve.
10
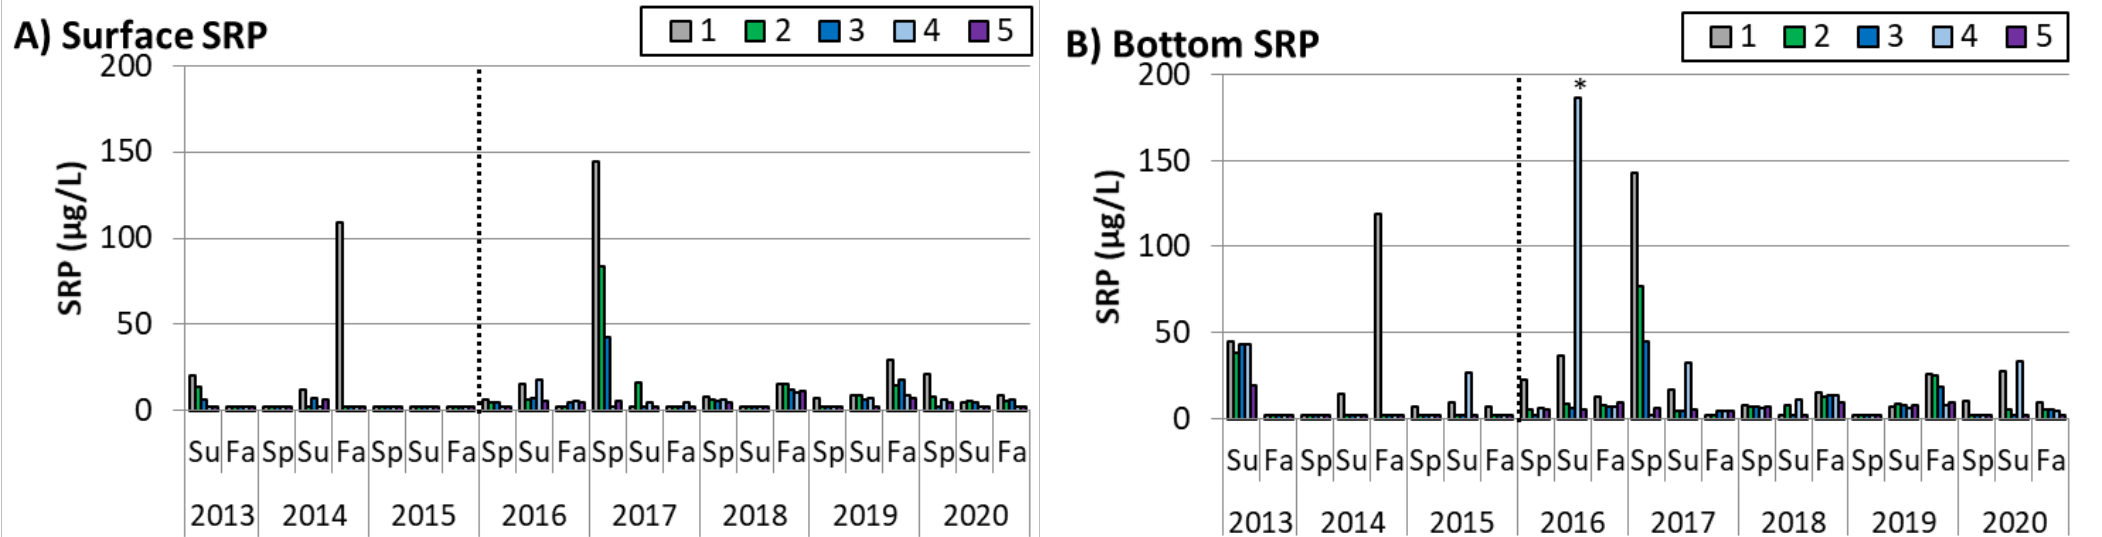
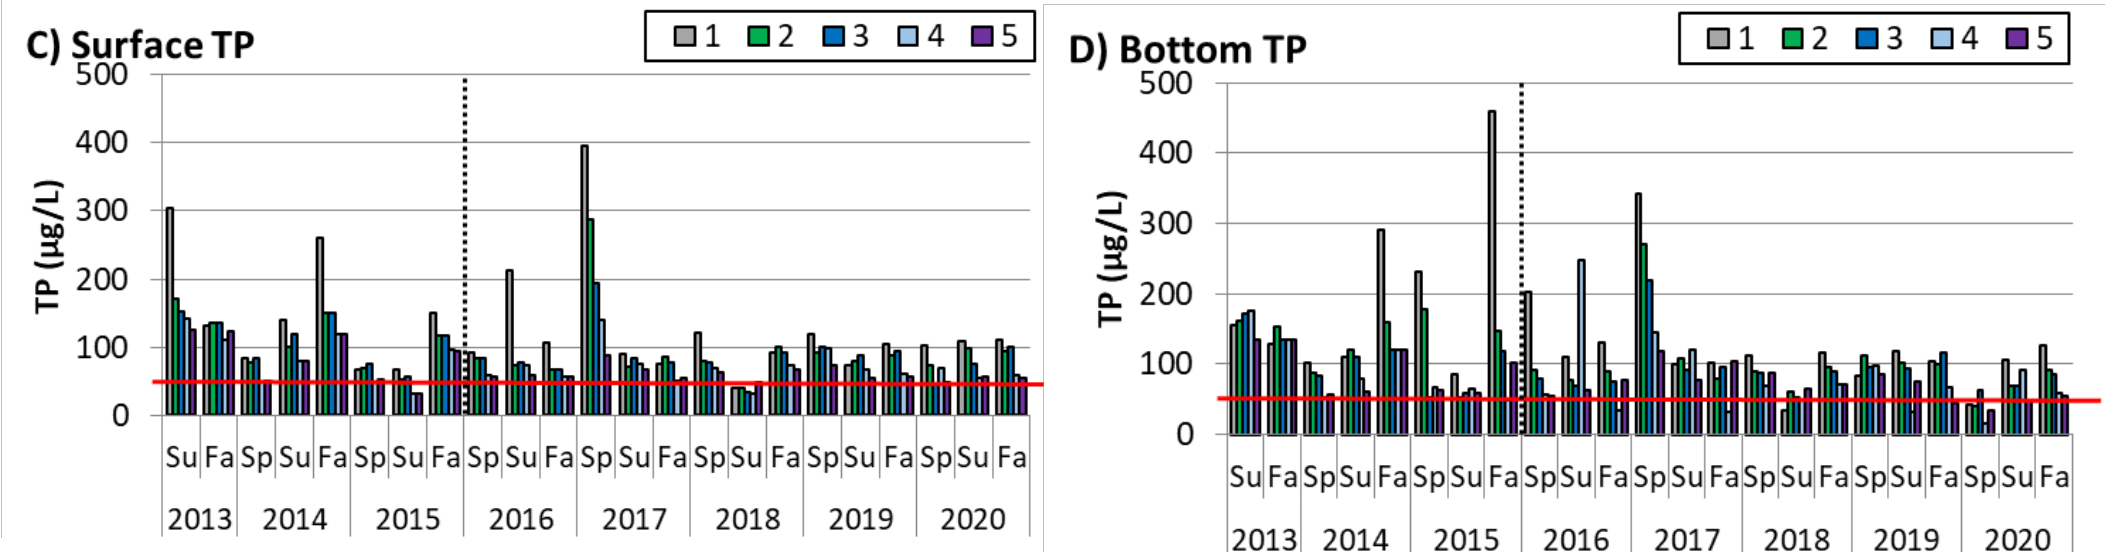
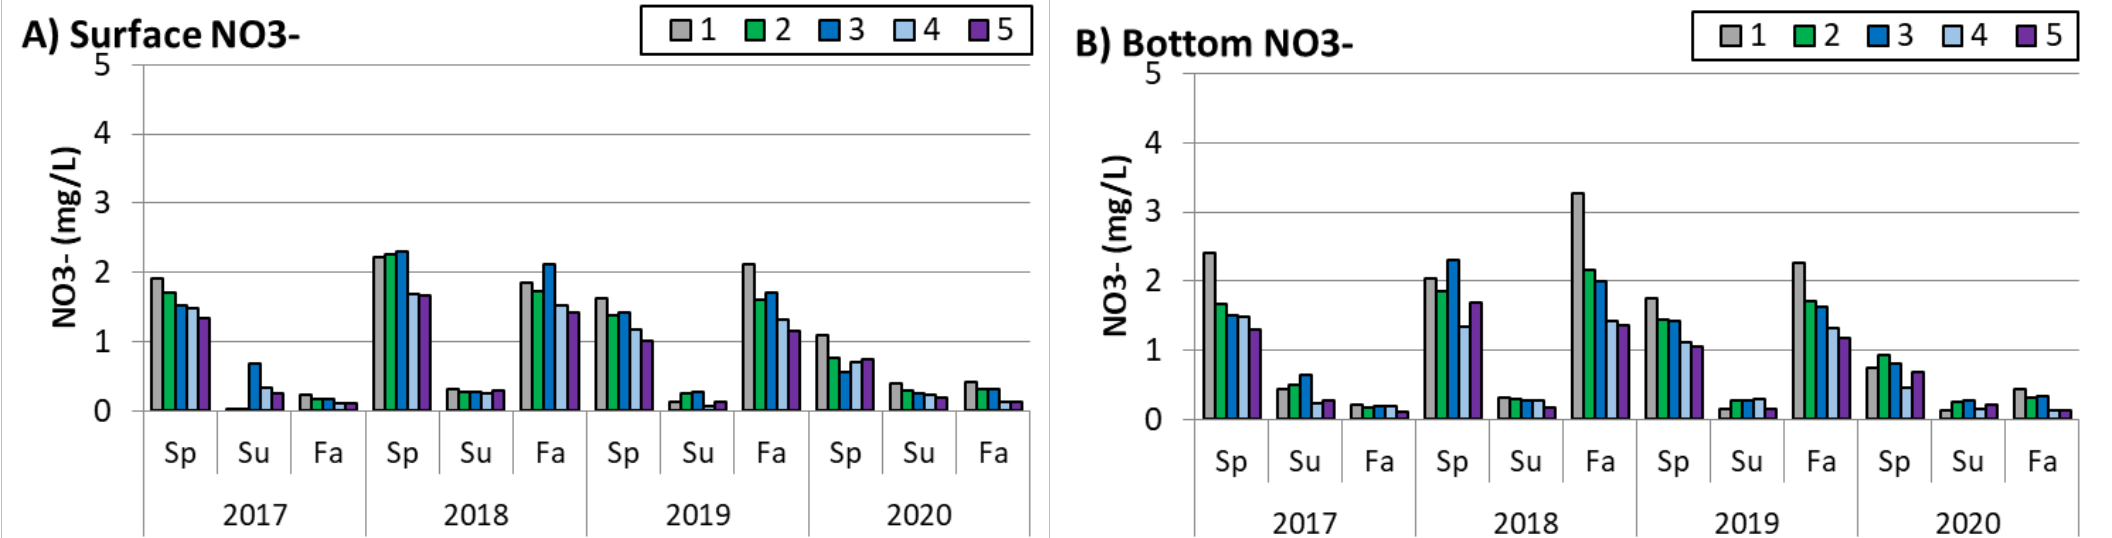
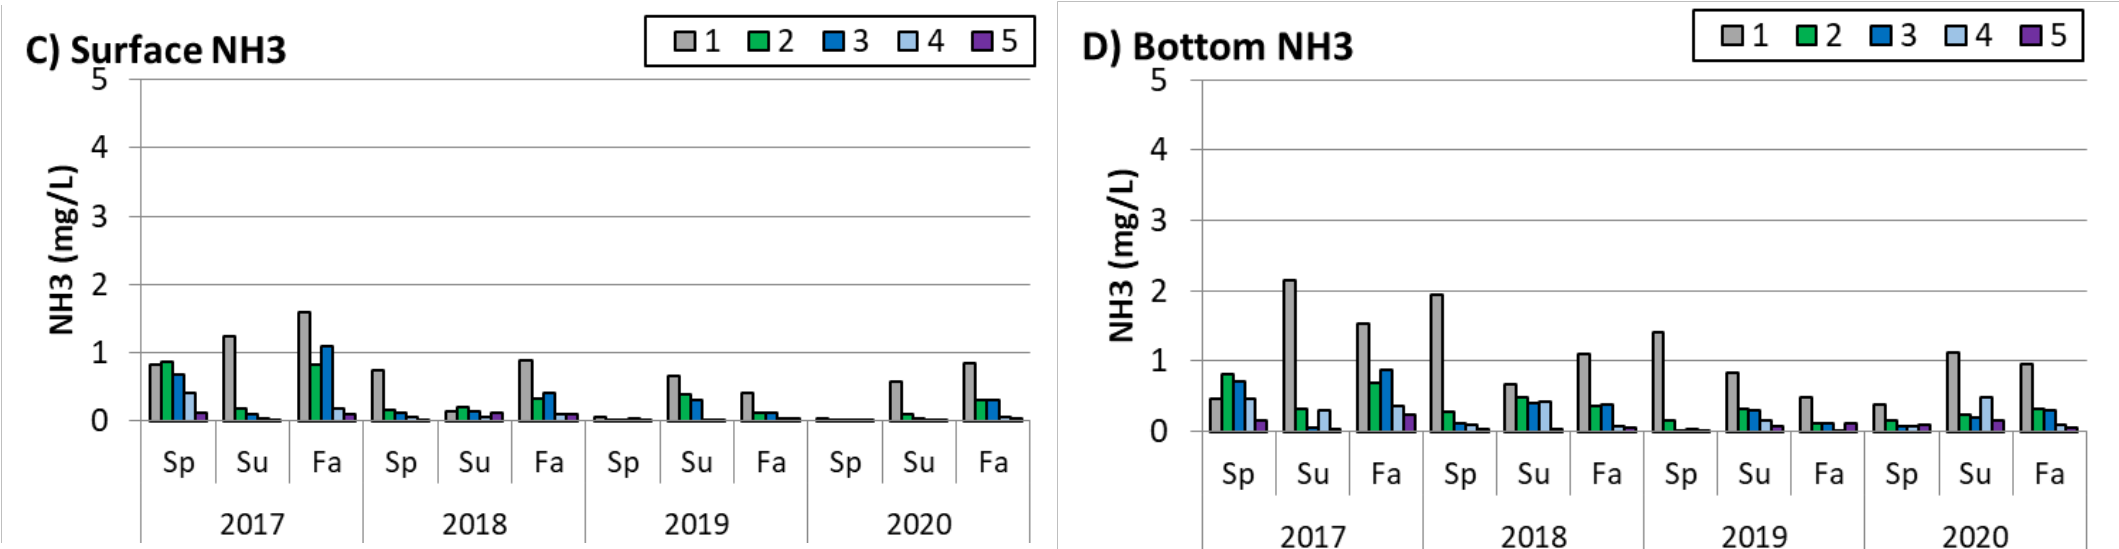
Figure 7. Box plots of soluble reactive phosphorus ([SRP]: A, B); total phosphorus ([TP]: C, D); chlorophyll a ([chl a]:E, F; and Secchi disk depth: G) levels measured at the 5 monitoring stations in Lake Macatawa during all pre-restoration sampling dates (summer 2013 – fall 2015) and an equal and seasonally corresponding number of post-restoration sampling dates (summer 2018 – fall 2020). Boxes represent the middle 50% of data; the horizontal line crossing the box is the median data value; whiskers represent the upper 25% and lower 25% of data, excluding outliers; points outside of the box and whiskers are considered outliers. P-values are results of Mann-Whitney rank sum tests of pre- vs. post-restoration data. Note scales change on y-axes.
14
Figure 8. Linear regressions plotting annual precipitation vs. mean total phosphorus (TP) concentration in Lake Macatawa. Historical TP data sources include U.S. EPA (1972; STORET), MDEQ/EGLE (1982, 1997-2012; S. Holden, personal communication), and AWRI (since 2013). Precipitation data sources include the National Climatic Data Center/National Centers for Environmental Information (2005-2020; NOAA) and Weather Underground (1972-2004; The Weather Channel Company).
In order to gauge whether smaller and more closely associated spans of time would have a stronger relationship with seasonally-sampled Lake Macatawa phosphorus data, daily precipitation from 2013-
| Linear Regression R2 values | ||||
|---|---|---|---|---|
| SRP | TP | |||
| Surface | Bottom | Surface | Bottom | |
|
0.04 | 0.09 | 0.36 | 0.55 |
|
0.04 | 0.01 | 0.00 | 0.00 |
| 0.21 | 0.18 | 0.00 | 0.08 | |
| 0.11 | 0.05 | 0.00 | 0.08 | |
| 0.38 | 0.28 | 0.00 | 0.01 | |
| 0.47 | 0.32 | 0.02 | 0.15 | |
|
0.36 | 0.39 | 0.06 | 0.25 |
|
0.28 | 0.48 | 0.08 | 0.26 |
| 0.39 | 0.54 | 0.00 | 0.09 | |
| 0.46 | 0.39 | 0.00 | 0.03 | |
| 0.36 | 0.28 | 0.03 | 0.01 | |
| 0.41 | 0.25 | 0.04 | 0.01 | |
|
0.45 | 0.15 | 0.01 | 0.07 |
| 10-month | 0.23 | 0.12 | 0.02 | 0.27 |
| 11-month | 0.15 | 0.14 | 0.04 | 0.29 |
| 12-month | 0.14 | 0.14 | 0.05 | 0.30 |
16
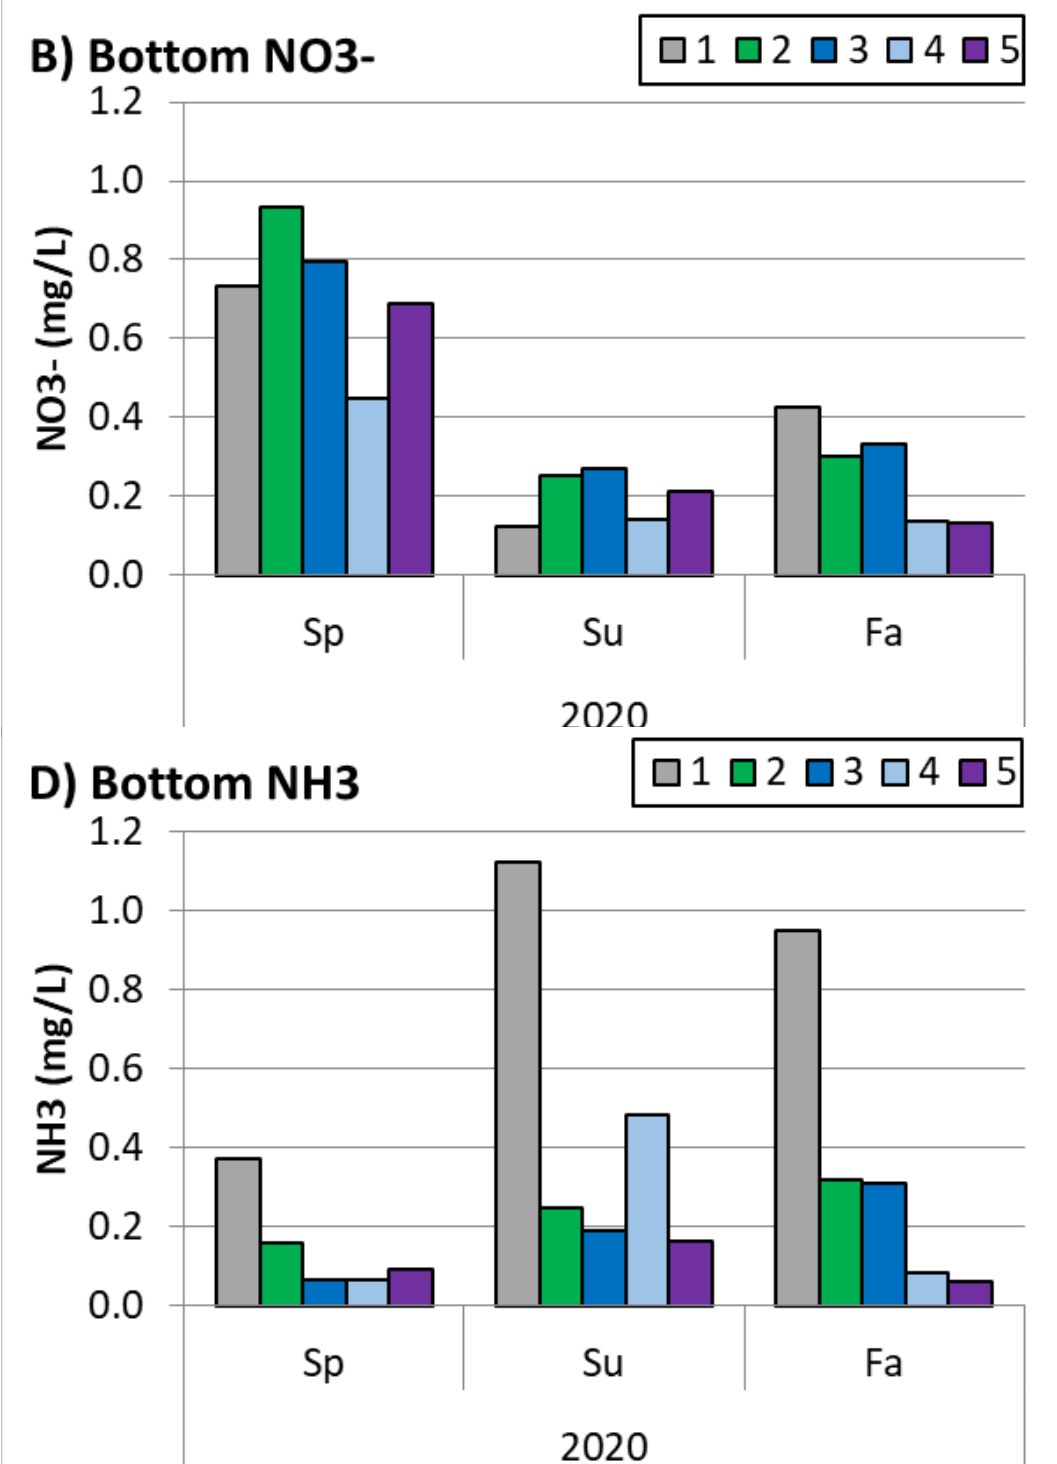
Prior year concerns over high nitrate levels in spring and fall are somewhat allayed based on the 2020 concentrations, which were considerably lower than in the past few years. This may be a reflection of best management practices in the watershed having a beneficial effect with respect to nitrate application and retention. Future monitoring will help us make that determination.
Chlorophyll concentration (indicative of algal biomass) and Secchi disk depth (indicative of water clarity) in 2020 were little changed from the past few years, and have either remained similar (chlorophyll), or have improved (secchi depth), compared to pre-restoration values.
that the littoral fish assemblage showed both positive and negative indicators of the lake’s ecological health. Yellow perch, bluegill, and pumpkinseed were common species captured in our surveys, and they are indicators of good water quality, whereas commonly found gizzard shad and spotfin shiner are often associated with poor water quality.
The iron slag filter project (Appendix B), funded through MDARD, has been effective at reducing P concentrations, but their optimal effectiveness is in regions with very high SRP concentrations in the tile drain effluent. There appears to be no concern over their leaching toxic substances. Given their cost, their impact in reducing P will be localized at high P “hot spots”.
5. Acknowledgements
Funding was provided through Project Clarity funds; our thanks to Travis Williams, Dan Callam, Rob Vink, and David Nyitray of ODC for their help and knowledge of the area, as well as the other partners of Project Clarity including Kelly Goward and Steve Bulthuis of the MACC, Todd Losee and Steve Niswander of Niswander Environmental, and Dr. Aaron Best, Sarah Brokus, Randy Wade, and Carolyn Cooper of Hope College.
Baker, D.B., L.T. Johnson, R.B. Confesor Jr, J.P. Crumrine, T. Guo, and N.F. Manning. 2019. Needed: Early term adjustments for Lake Erie phosphorus target loads to address western basin cyanobacterial blooms. Journal of Great Lakes Research 45: 203-211.
Brennan, A.K., C.J. Hoard, J.W. Duris, M.E. Ogdahl, and A.D. Steinman. 2016. Water quality and hydrology of Silver Lake, Oceana County, Michigan, with emphasis on lake response to nutrient loading (No. 2015-5158). US Geological Survey.
19
Kunkel, K.E., T.R. Karl, D.R. Easterling, K. Redmond, J. Young, X. Yin, and P. Hennon. 2013. Probable maximum precipitation and climate change. Geophysical Research Letters 40: 1402-1408.
Steinman, A., Abdimalik, M., Ogdahl, M.E. and M. Oudsema, M. 2016. Understanding planktonic vs. benthic algal response to manipulation of nutrients and light in a eutrophic lake. Lake and Reservoir Management 32: 402-409.
Steinman, A.D., M. Hassett, and M. Oudsema. 2018. Effectiveness of best management practices to reduce phosphorus loading to a highly eutrophic lake. International Journal of Environmental Research and Public Health 15: 2111.