
Typical scg captures the mitral valve closure
CHI 2018 Honourable Mention CHI 2018, April 21–26, 2018, Montréal, QC, Canada
Seismo: Blood Pressure Monitoring using Built-in Smartphone Accelerometer and Camera
ABSTRACT
Although cost-effective at-home blood pressure monitors are available, a complementary mobile solution can ease the bur-den of measuring BP at critical points throughout the day. In this work, we developed and evaluated a smartphone-based BP monitoring application called Seismo. The technique re-lies on measuring the time between the opening of the aortic valve and the pulse later reaching a periphery arterial site. It uses the smartphone’s accelerometer to measure the vibration caused by the heart valve movements and the smartphone’s camera to measure the pulse at the fingertip. The system was evaluated in a nine participant longitudinal BP perturbation study. Each participant participated in four sessions that in-volved stationary biking at multiple intensities. The Pearson correlation coefficient of the blood pressure estimation across participants is 0.20-0.77 (µ=0.55, σ=0.19), with an RMSE of 3.3-9.2 mmHg (µ=5.2, σ=2.0).ACM Classification Keywords
H.5.m. Information Interfaces and Presentation (e.g. HCI): Miscellaneous; I.5.4. Image Processing and Computer Vision: Applications
© 2018 ACM. ISBN 978-1-4503-5620-6/18/04...$15.00
DOI:
In this work, we develop and evaluate Seismo, a BP measure-ment technique using the existing sensors on the smartphone. Seismo uses pulse transit time (PTT) – the time taken by the heart’s pulse to propagate between two arterial sites – which is inversely related to BP [9, 22, 25]. In particular, Seismo tracks the time when the blood is ejected from the heart as the aortic valve opens and when the pulse arrives at the fin-gertip. To perform this, Seismo relies on Seismocardiography (SCG), which uses the vibration caused by the movement of
Paper 425 Page 1
PTT vs PAT
Compared to cuff-based BP measurement approaches, PTT-based techniques provide continuous beat-to-beat BP measure-ments. A typical method for obtaining PTT [9, 16, 17, 23] is to use the R-wave of the ECG to mark the timing of the genesis of the pulse, and measure the pulse at the periphery (typically at the fingertip) using PPG. However, the ECG R-wave is not a reliable timing marker for the genesis of the pulse [3, 25, 16],CHI 2018, April 21–26, 2018, Montréal, QC, Canada
In this work, similar to [3, 10], we rely on SCG instead of ECG to capture the proximal timing of aortic valve opening in order to measure accurate PTT value (not PAT) for BP estimation (Figure 2). PTT-based BP estimation approaches suffer from a few limitations. PTT can only estimate relative changes in blood pressure, i.e., an absolute measure of PTT cannot be extrapolated to an absolute measure of BP. Also, the relationship between PTT and BP is dependent on the physiological properties of an individual. Both of these limi-tations can be addressed by performing per user calibration, and is an active area of research. Various methods have been proposed to determine the calibration between PTT and BP [16]. The most common is to perform a set of interventions that would perturb an individual’s blood pressure. Exercises such as running and biking are effective methods to drastically increase the blood pressure. Other methods include postural changes, valsalva maneuvers, and cold pressor [16]. Finally, another limitation of PTT is that it is most strongly influenced by diastolic blood pressure. As such, in our evaluation we focused only testing the correlation between PTT and diastolic blood pressure. However, because diastolic blood pressure changes and systolic blood pressure changes are often strongly correlated, PTT remains a highly useful for monitoring blood pressure fluctuation.
Paper 425 Page 2
These two positions provide proper ergonomics and access to the heart vibration, and also are less obstructed by body fat compared to other portions of the chest. The user can try placing the phone in both the positions, and our system Seismo will determine the subject-specific location depending on the quality of the signal received. The SCG morphology changes
CHI 2018, April 21–26, 2018, Montréal, QC, Canada
Figure 3. A series of three beeps is played through the phone’s speaker to synchronize the camera and accelerometer subsystems.
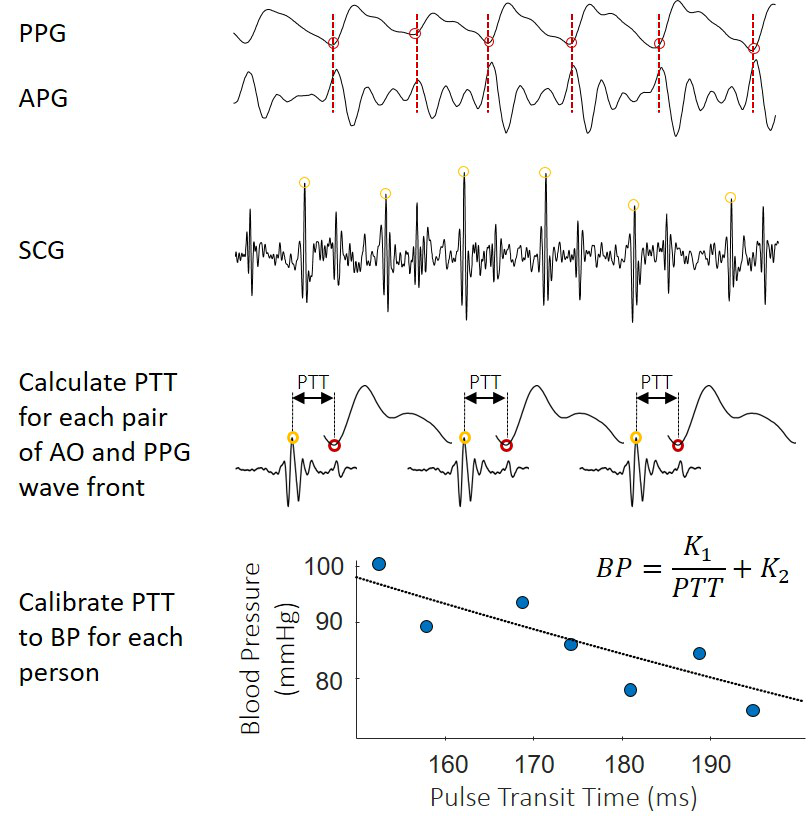
Figure 4. The SCG is produced by the consecutive mechanical move-ments during a heartbeat (MC, IM, AO, then MA). However, the rela-tive amplitude of each movement changes depending on the person and position of the accelerometer placement.
we calculate the heart rate by taking an FFT of the PPG, and retrieving the dominant frequency. The heart rate is then used to predetermine the minimum spacing between successive pulses. To calculate the actual timing of the pulse wavefront, we use the second derivative of the PPG signal, called acceler-ation photoplethysmogram (APG), instead of the original PPG waveform. The reason for this is the peak of the APG accentu-ates when the pulse shows up at the finger. By using the heart rate as the minimum spacing, we then apply a standard peak detection algorithm to capture the peak of the APG.
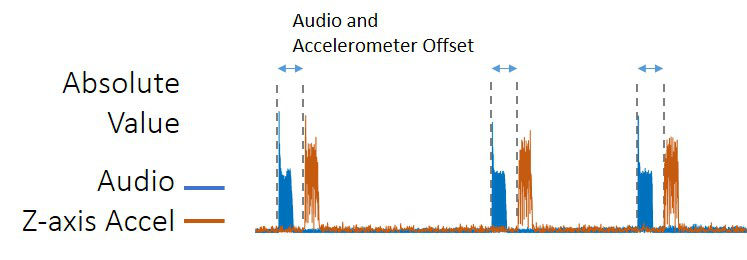
Figure 5. PPG and SCG signals are used to measure the PTT. The max-imal point of acceleration of the PPG (APG) is compared with the AO point of the SCG. To convert PTT to BP, an individualized calibration of PTT to BP is generated based on reference recording with a blood pressure cuff.
| CHI 2018, April 21–26, 2018, Montréal, QC, Canada | |||||||||
|---|---|---|---|---|---|---|---|---|---|
| ID | Age | Sex |
|
|
RMSE [mmHg] | R | |||
| 1 | 27 | F | 67 | 81 - 96 | 0.63 | ||||
| 2 | 61 | F |
|
65 | 92 - 114 |
|
0.52 | ||
| 3 | 26 | F | 64 | 68 - 79 | 0.68 | ||||
| 4 | 27 | M |
|
70 | 84 - 89 |
|
0.20 | ||
| 5 | 56 | M | 72 | 90 - 97 | 0.59 | ||||
| 6 | 55 | F |
|
64 | 62 - 85 |
|
0.77 | ||
| 66 | M | 72 | 79 - 92 |
|
0.45 | ||||
| 44 |
|
0.55 | |||||||
| 17 |
|
0.19 | |||||||
bike tasks. All participants were recruited from within the author’s institution, with an age range from 26 to 66 years (µ=44, σ=17). Participants were paid 50 USD/session and all protocols are approved by our institution’s IRB.
After removing the two participants, we have a total of n=196 (= 7 participants x 4 sessions x 7 measurements/session) blood
pressure and PTT measurement pairs for analysis. The av-erage diastolic blood pressure, and average blood pressure fluctuation per participant observed in the study is µ=88±11.5 mmHg. Individual breakdown is shown in Table 1.
Paper 425 Page 5
CHI 2018 Honourable Mention
DISCUSSION
Limitations
One of the main limitation of the evaluation is the reference blood
pressure. Although the Microlife bp3na1-1x used in the evaluation is
rated A/A under the BHS Standard, it is not designed for measuring
rapidly changing blood pressure. In comparison, other works [3, 10] that
have demonstrated high correlation between PTT and BP during BP
perturbation studies instead use a reference system that measures blood
pressure continuously, such as a ccNexfin finger cuff (Edwards
Lifesciences, Irvine, CA). Such a system can more reliably capture the
fast-changing blood pressure after exercise, but it is very expensive
and specialized. It is likely that some of the disparity between our
results and results from prior work [3, 10] can be attributed to using a
different system to measure ground truth. In fact, the participant with
the lowest correlation, Subject-4, has sessions where his/her reference
blood pressure remain unchanged even after intense biking. When PTT of
Subject-4 is measured, it reduces as expected. Figure 8 shows Subject-3
which has the expected trend of both – the reference blood pressure and
the inverse of pulse
We compare our system with prior work, using either ECG or SCG as a reference. Although widely used as a method for noninvasive blood pressure monitoring, ECG-based pulse ar-rival time measurements have been shown to poorly correlate with diastolic blood pressure due to the pre-ejection period [25, 3]. In contrast, techniques that can thus capture the ac-tual timing of aortic valve opening can accurately determine the pulse transit time and thus correlate with blood pressure more reliably. Previous studies using ECG and PPG posi-tioned at the finger/wrist found correlations between PAT and DBP to be 0.40±0.35 [12], 0.26-0.57 [14], and 0.41 [2]. In comparison, our average correlation between PTT and DBP is comparatively high at 0.55 (or 0.61 when removing the outlier Subject-4).
When compared to other methods that accurately capture the aortic opening time, our correlation results are comparable to 0.57±0.13 by [24], 0.62±0.16 by [10], but is comparatively lower than 0.84±0.09 by [3]. Although our system demon-strates a slightly lower accuracy compared with state-of-the-art in prior work, a main contribution of our work is in showing that a smartphone’s built-in SCG and PPG measurement can be used in measuring pulse transit time for tracking blood pressure. Compared with SeismoWatch [3], which uses a ultralow-noise accelerometer (ADXL354 with a noise floor 20µg/√Hz, instead of using a dedicated hardware system, Seismo relies on a built-in smartphone accelerometer (BST-BMI160 with a noise floor of 180µg/√Hz), which is a typical sensor for commodity phone hardware. To enable built-in sensors to perform PTT measurements, we came up with a synchronization technique that uses the built-in speaker that is always available on the phone as well.
Incorporating Smartphone Blood Pressure Monitoring to
Personal Health Tracking Applications
By only using the built-in sensors of the smartphone, Seismo can monitor blood pressure without any modifications to a smartphone with a camera and accelerometer. We envision such a smartphone based PTT measurement can be useful in a variety of scenarios depending on the availability of resources.
CONCLUSION
Seismo is a smartphone-based blood pressure monitoring tech-nique that uses the built-in accelerometer to measure SCG and the smartphone’s camera to measure PPG, in order to calculate pulse transit time to estimate blood pressure. In our evaluation with nine participants, we observed that two participants ex-hibited signals that were too noisy for our system to produce consistent SCG signals. Further investigation into different positioning of the phone may improve the motion artifacts that occur due to someone’s hand shaking. For participants with a weaker heart beat and more fat and muscle tissues between the accelerometer and the heart impedes the transduction of the SCG. In this case, the high noise floor of the built-in ac-celerometer suffered in acquisition of the SCG. Of the seven participants that produced clean SCG and PPG signals for further analysis, we found the group correlation to be between 0.20-0.77 with a mean of 0.55. Although this result is a bit lower than prior work that uses similar signal source to infer pulse transit time, upon further investigation, we noted that the participant with the lowest correlation exhibited unexpected reference blood pressure measurements. For this participant, even though their pulse transit time decreased with respect to increase biking effort, their blood pressure did not follow the expected trend of increasing with increased effort. When we look at the group correlation without the worst correlated subject, the correlation becomes 0.61, comparable with most of the related work. Through this evaluation, we show that the built-in sensors of a smartphone can acquire high quality signals for use in pulse transit time based blood pressure mon-itoring, while also revealing some of the short comings and improvements that can potentially mitigate them.REFERENCES
1. Rajiv Agarwal, Jennifer E. Bills, Tyler J.W. Hecht, and Robert P. Light. 2010. Role of Home Blood Pressure Monitoring in Overcoming Therapeutic Inertia and Improving Hypertension Control. Hypertension 57, 1 (2010), 29–38. DOI:Wearable Cuffless Blood Pressure Monitoring Using Pulse Transit Time. Proc. ACM Interact. Mob. Wearable Ubiquitous Technol. 1, 3, Article 40 (Sept. 2017), 16 pages. DOI:
4. V. Chandrasekaran, R. Dantu, S. Jonnada, S. Thiyagaraja, and K. P. Subbu. 2013. Cuffless Differential Blood
Pressure Estimation Using Smart Phones. IEEE
Transactions on Biomedical Engineering 60, 4 (April 2013), 1080–1089. DOI:Ballistocardiography and Seismocardiography: A Review of Recent Advances. IEEE Journal of Biomedical and Health Informatics 19, 4 (July 2015), 1414–1427. DOI:
8. A.Dias Junior, Srinivasan Murali, Francisco Rincon, and David Atienza. 2015. Estimation of blood pressure and pulse transit time using your smartphone. In Euromicro Conference on Digital System Design (DSD). 173–180.
CHI 2018, April 21–26, 2018, Montréal, QC, Canada
analysis. Psychophysiology. (Jan 1983).
HeartSense: Ubiquitous Accurate Multi-Modal
Fusion-based Heart Rate Estimation Using Smartphones. IMWUT 1 (2017), 97:1–97:18.16. R. Mukkamala, J. O. Hahn, O. T. Inan, L. K. Mestha, C. S. Kim, H. TÃ˝ureyin, and S. Kyal. 2015. Toward Ubiquitous Blood Pressure Monitoring via Pulse Transit Time: Theory and Practice. IEEE Transactions on
Biomedical Engineering 62, 8 (Aug 2015), 1879–1901.
19. Carla Sala, Erika Santin, Marta Rescaldani, Cesare Cuspidi, and Fabio Magrini. 2005. What is the accuracy of clinic blood pressure measurement? American Journal of Hypertension 18, 2 (2005), 244–248. DOI:
20. J. Talts, R. Raamat, K. Jagomägi, and J. Kivastik. 2011.
Paper 425 Page 8
CHI 2018 Honourable Mention
25. Guanqun Zhang, Mingwu Gao, Da Xu, N. Bari Olivier, and Ramakrishna Mukkamala. 2011a. Pulse arrival time is not an adequate surrogate for pulse transit time as a marker of blood pressure. Journal of Applied Physiology 111, 6 (2011), 1681–1686. DOI:
26. Y L Zhang, Y Y Zheng, Z C Ma, and Y N Sun. 2011b. Radial pulse transit time is an index of arterial stiffness. Hypertension research : official journal of the Japanese Society of Hypertension. (Jul 2011).