
Use colour identify the year released the album
MIS771
ASSIGNMENT 3

Group member:
| ACKNOWLEDGEMENT | 1 | |
|---|---|---|
|
||
|
||
AN INTERACTIVE DATA VISUALIZATION DASHBOARD
The purpose of this dashboard is to provide clear information of different Sony Music album to a famous Music blogger. It allow the Music blogger to give better suggestion to his member, about which music album they maybe interested in, what is the price of the album, whether it is available in the Streaming Services etc.
services
Chart D 2
3

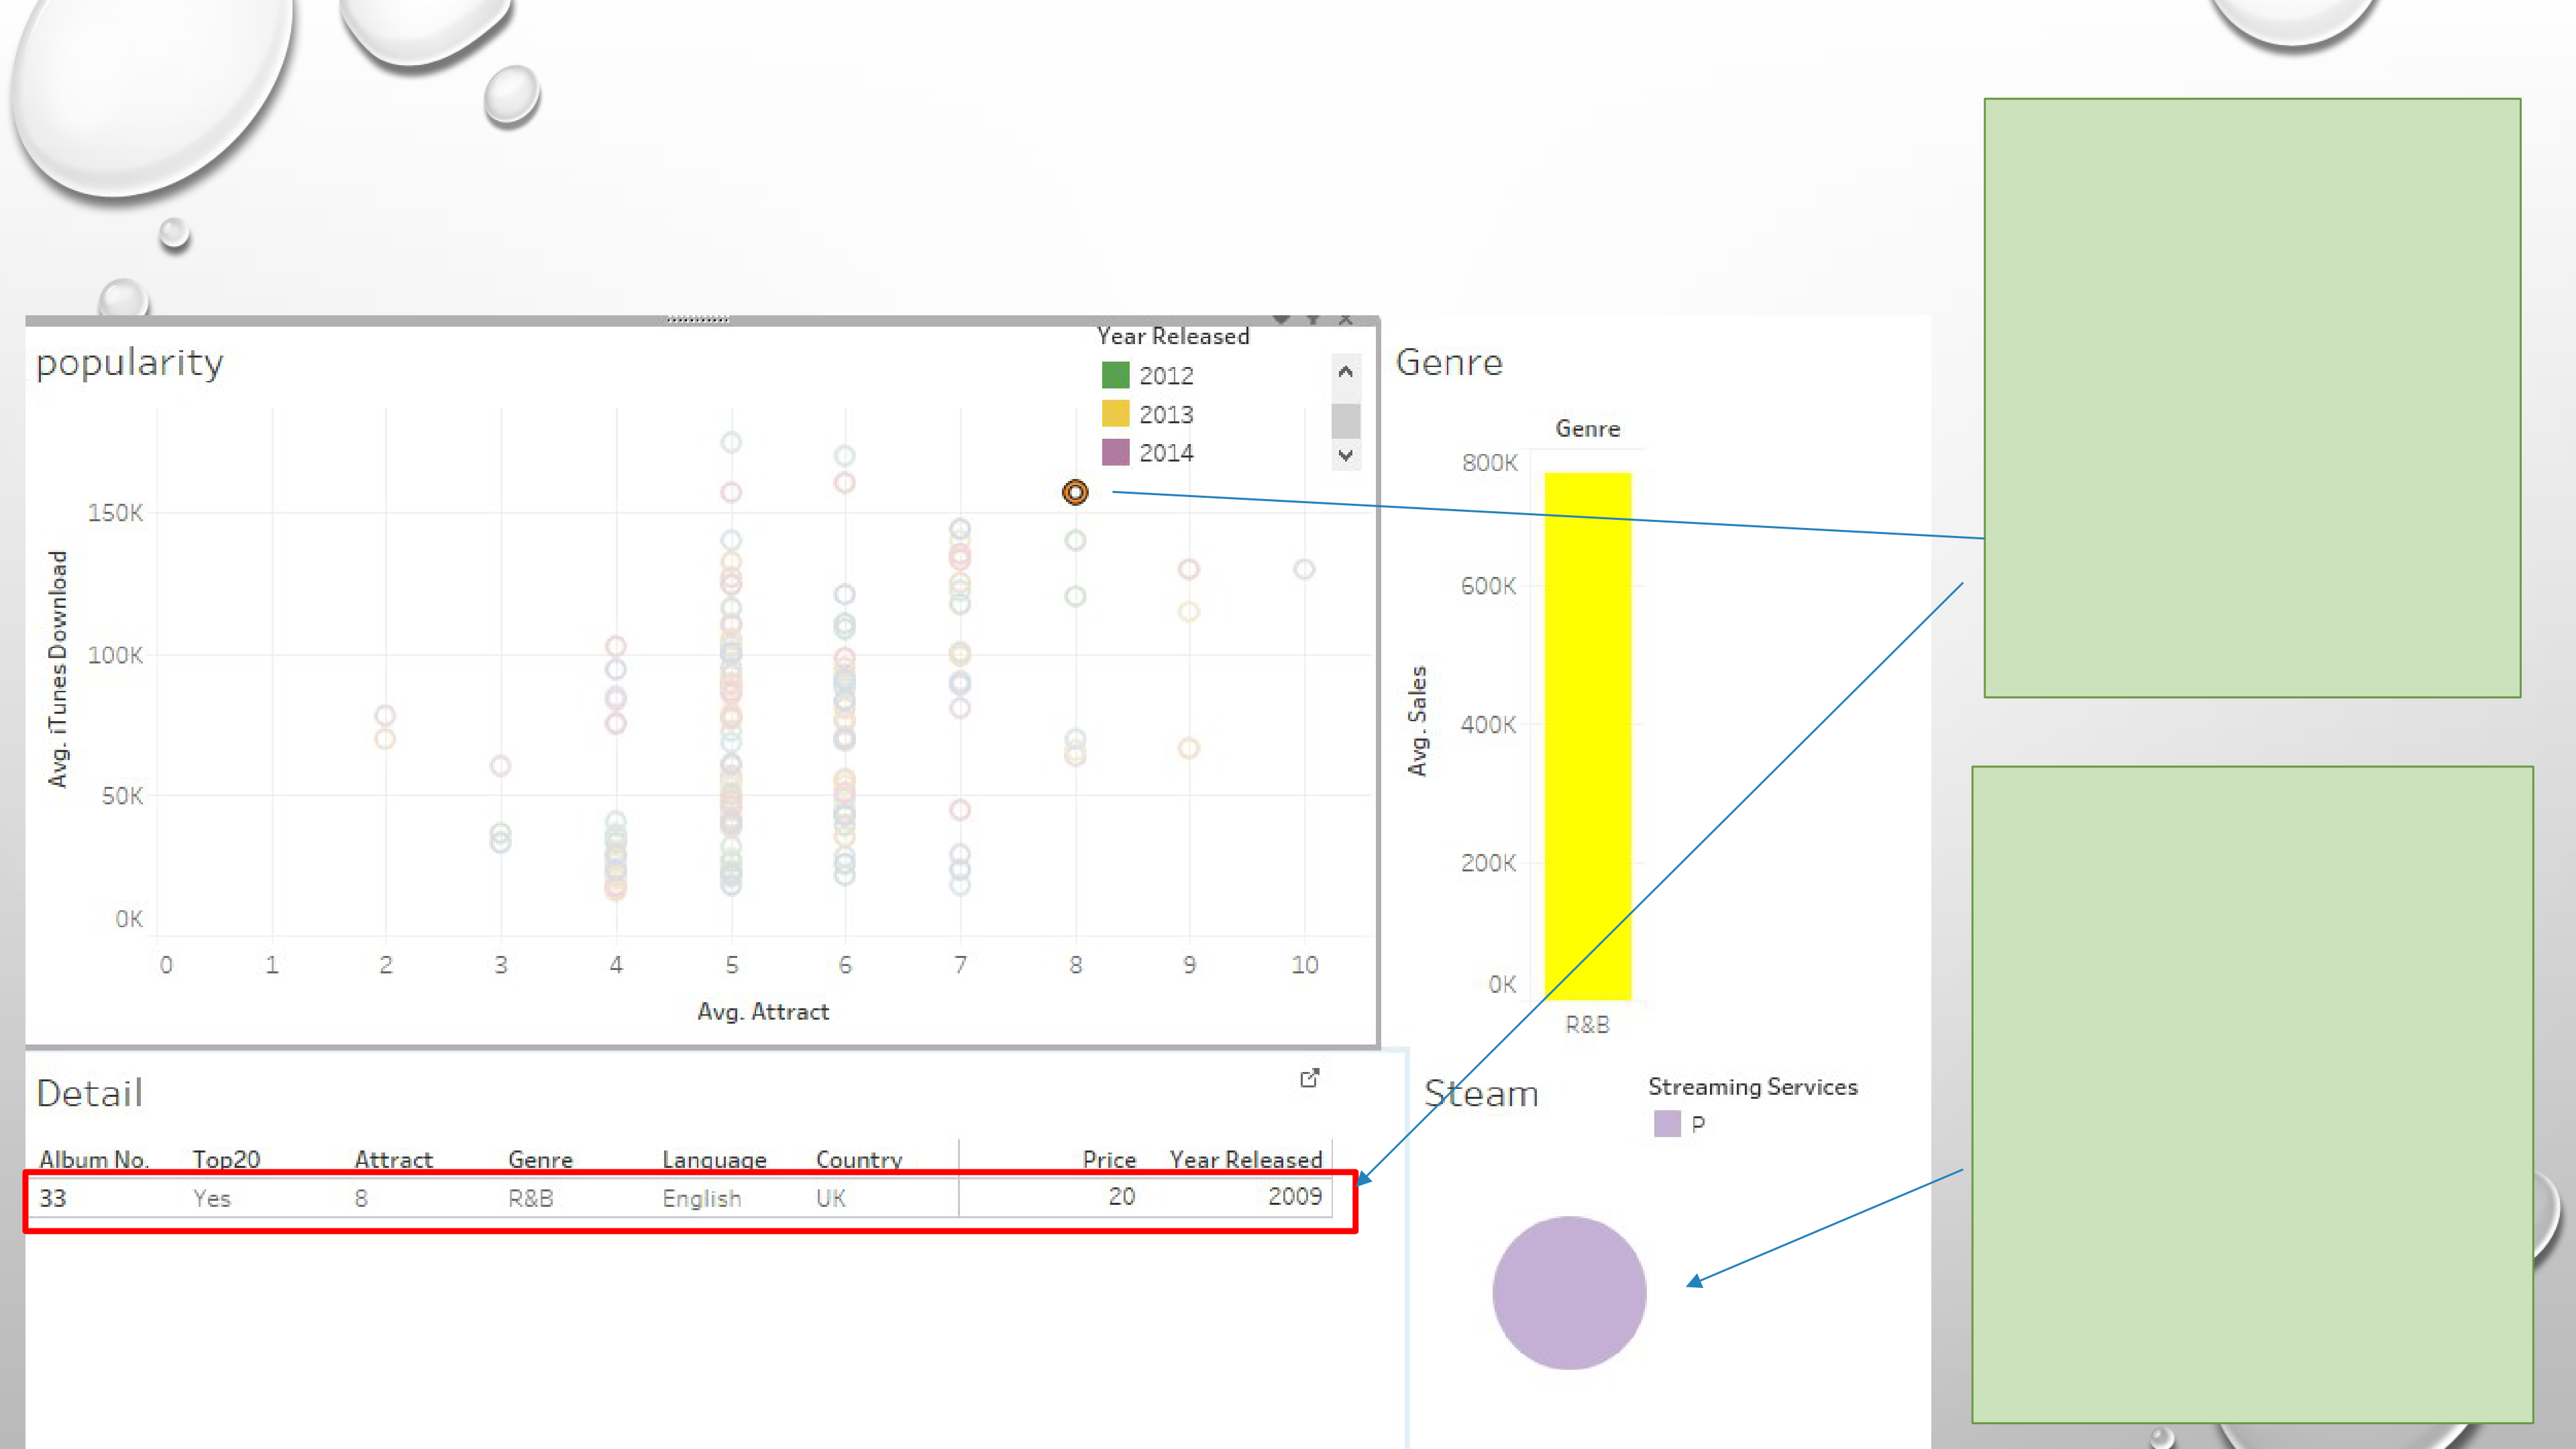
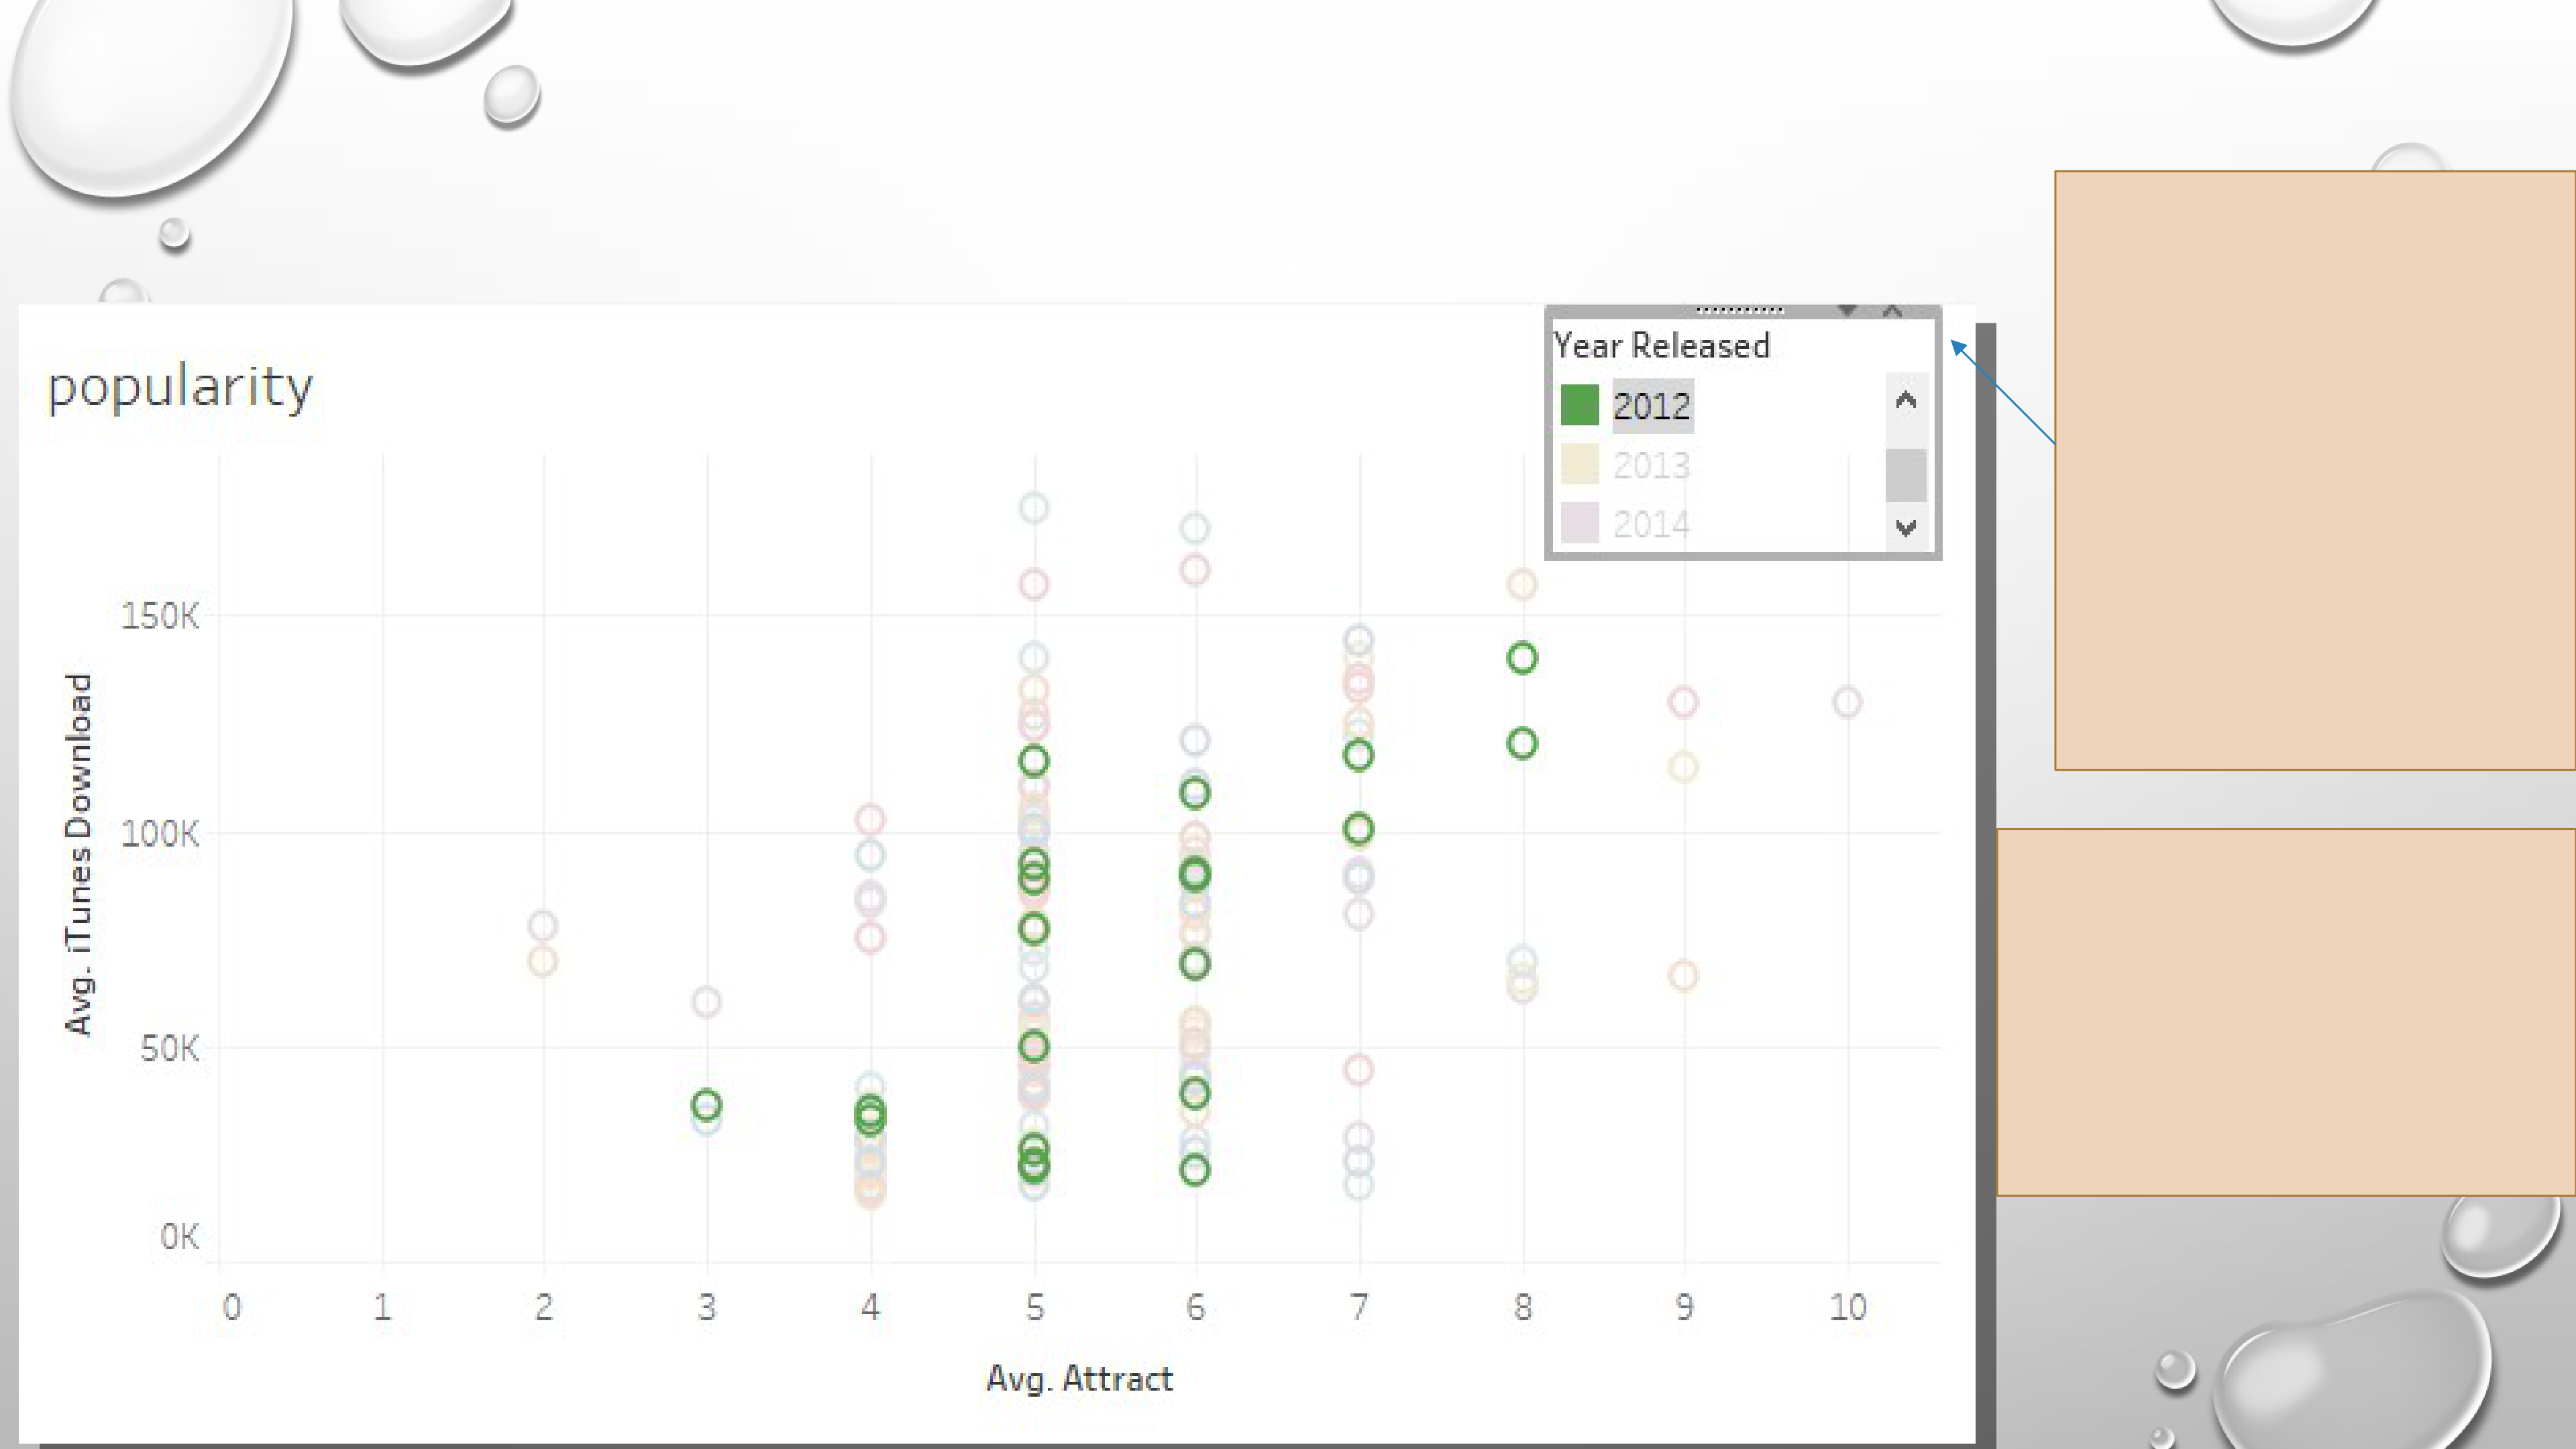

CHART A - CONTINUE
CHART B – BEST SALES GENRE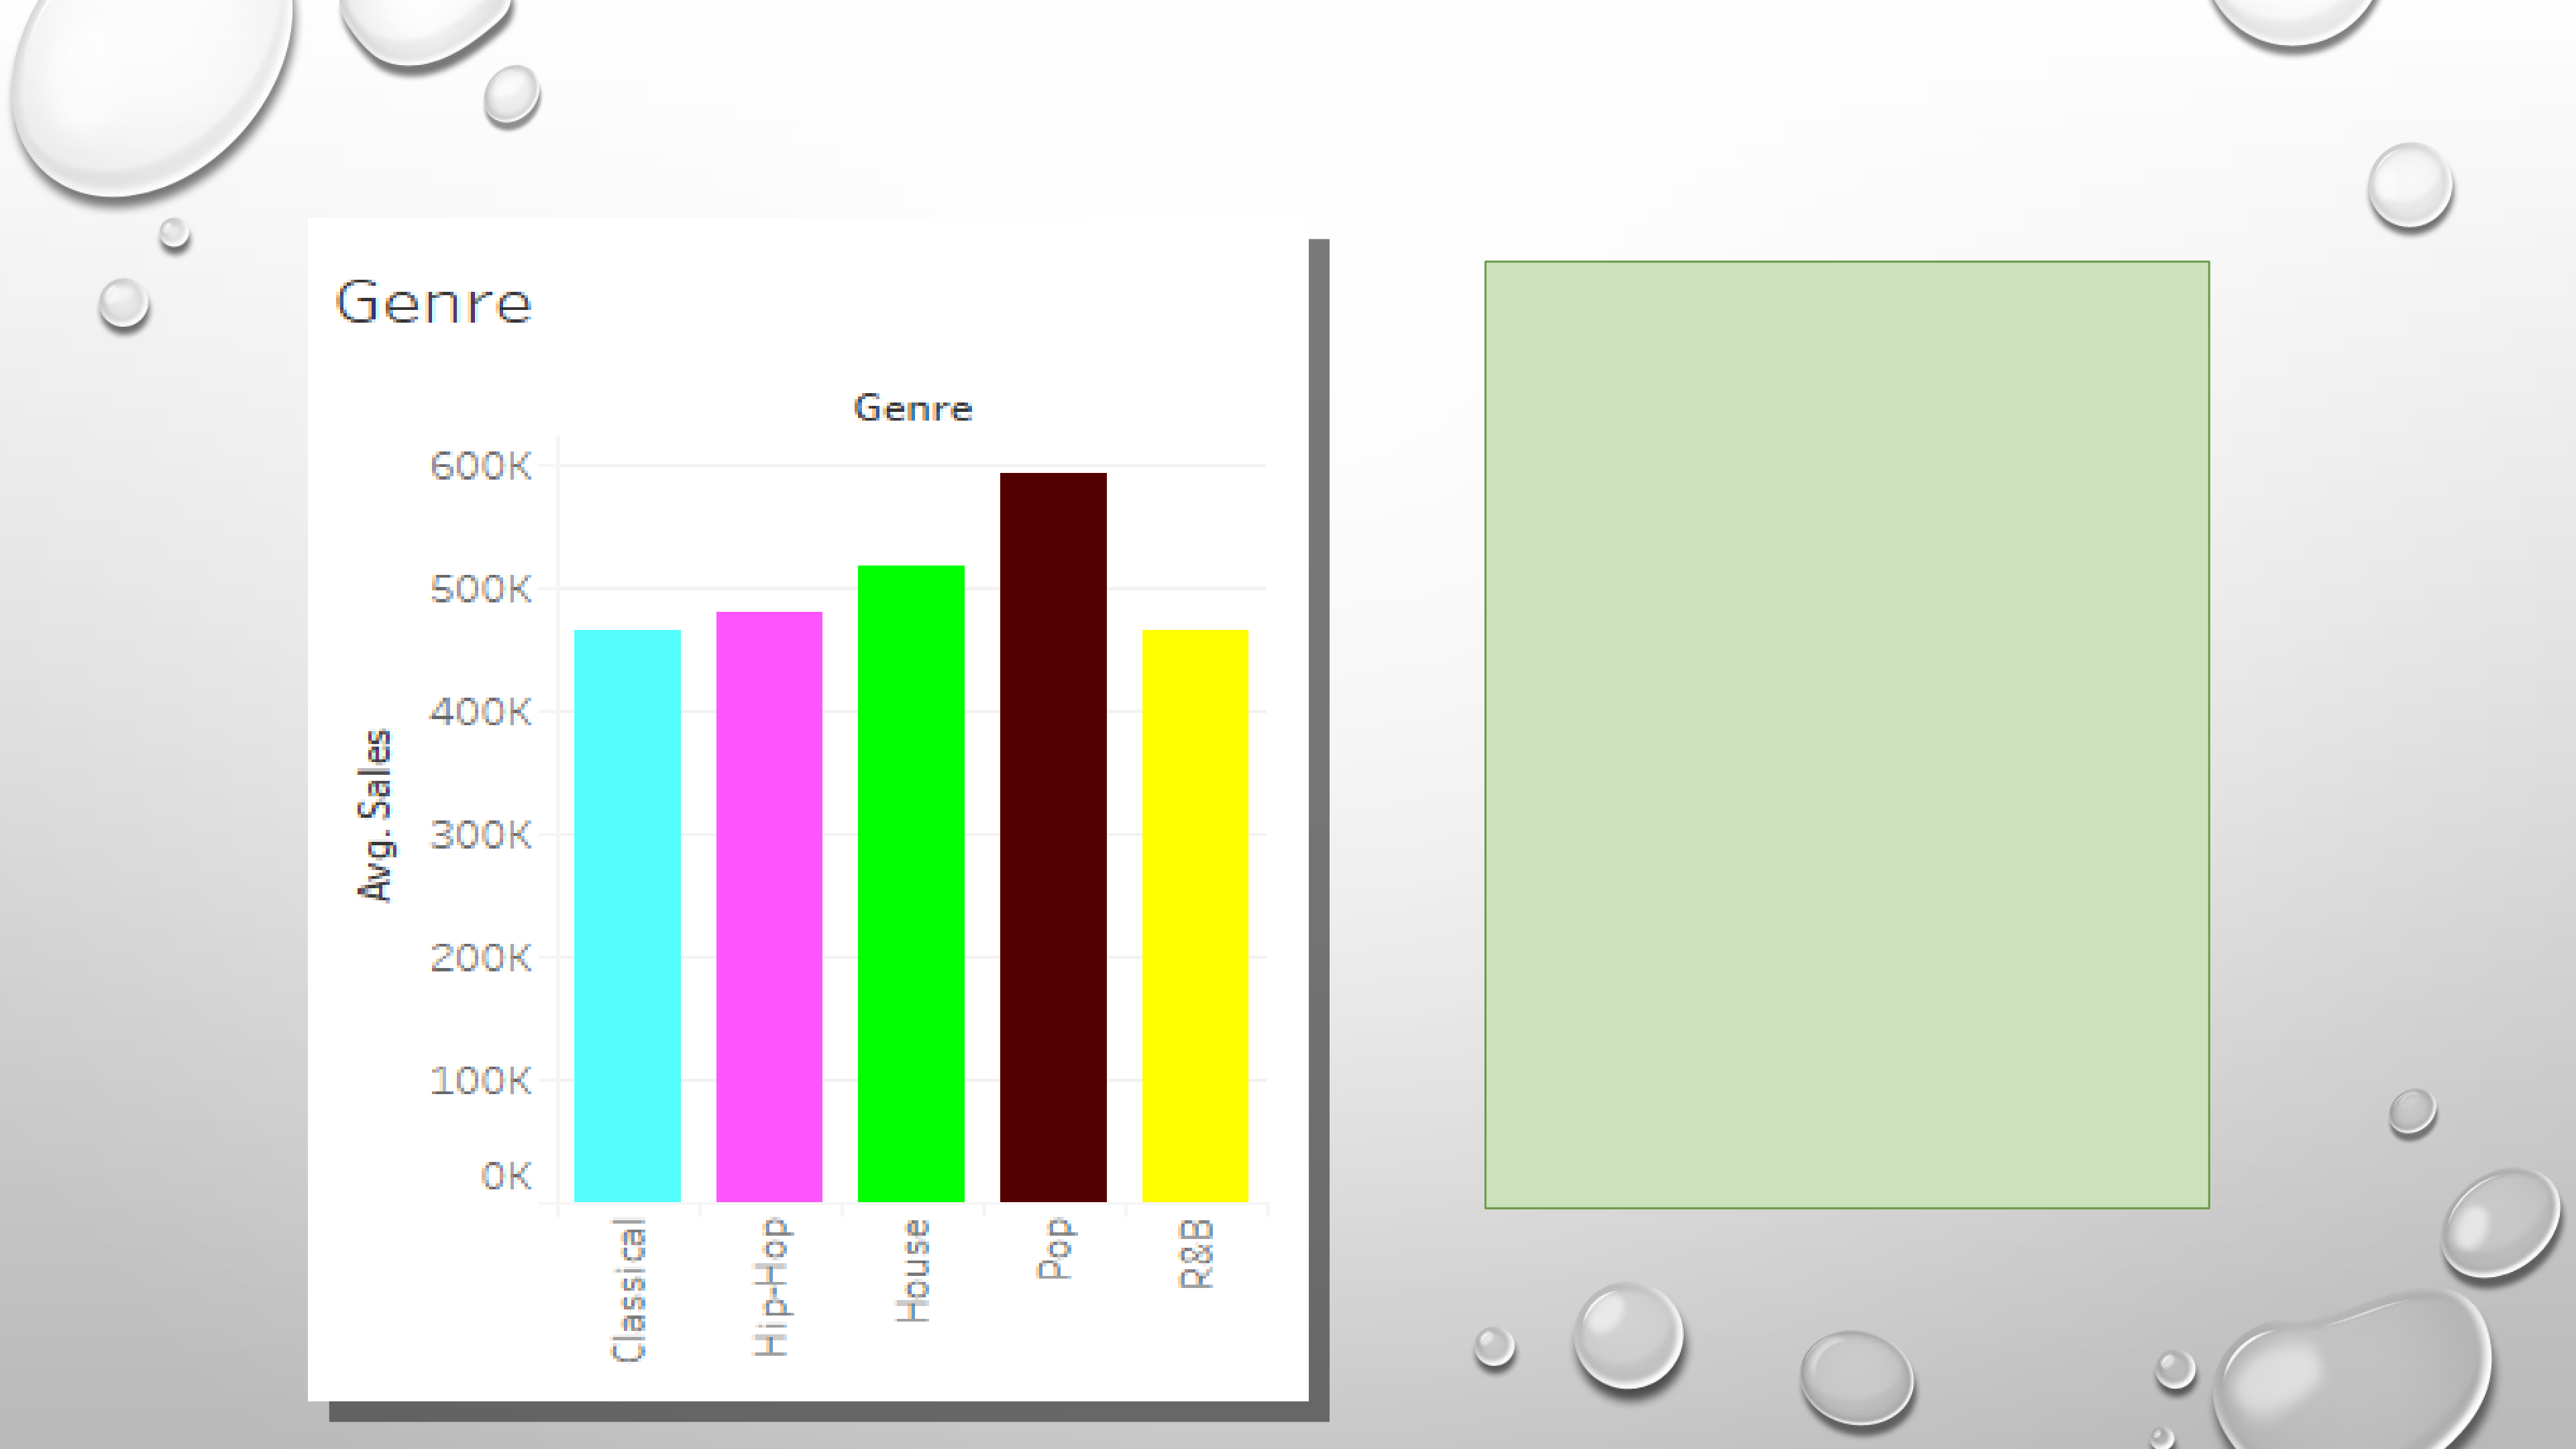
|
|---|
Then, the chart A will only
show the albums which are in
this genre. After that, blogger
can give choose the popular
one and introduce it to his
member.
7
CHART D – STREAMING SERVICES
Chart D shows the
proportion of the
albums come from
different streaming
services. S stands for
Spotify. P stands for
Pandora. N stands for
neither. Each of them
will have different
colour to represent.
Sometimes, to save money, the member may not want to buy the albums. Therefore, they may only be interested in the albums which can be listened in the streaming services. In this case, the blogger can utilize Chart D to find out which albums is available in which streaming services.
When you click on
the specific
streaming services
in Chart D, Chart A
will only shows in
the albums which
is available in that
streaming services.
It will be easier for
the blogger to give
suggestion when
his member only
want to listen
music in streaming
services. 10