
Which means that the firm earning economic profits mohr and associates
| Programme | Bachelor of Commerce In Supply Chain Management Year 1 |
| Module Name | Economics 1 |
| Assignment Number | Assignment 1 |
| Surname | Dlamini |
| First Name/S | Khetsiwe |
| Student Number | 12010671 |
| Date Submitted | |
| Postal Address | P.O Box 5638 |
| Mbabane | |
| 12010671@myregent.ac.za | |
(alternate email address) |
Khetsiwedlamini27@gmail.com |
| Contact Numbers | Cell :76570255 |
| Home : | |
| Work :2404 9847 | |
| Gcebile Dlamini | |
| Sister | |
| 7822 7446 | |
I Khetsiwe Z Dlamini__________________________ ID/Passport No.8912271100172_________________________hereby confirm that the assignment submitted herein is my own original work. Date: ________________________ |
|
A production possibility frontier (PPF) also called production possibility curve (PPC) shows the maximum possible output combinations of two goods or services an economy can achieve when all resources are fully and efficiently employed. A production possibility frontier is used to illustrate the concepts of opportunity cost, trade-offs and also show the effects of economic growth. Points within the curve show when a country’s resources are not being fully utilized. Combinations that lie beyond the PPF are unattainable at the moment until the economy experienced some growth and then the PPF will shift outward, making it possible to produce what was unattainable before. When there is economic growth, it means that the economy can now produce more goods and services than before.
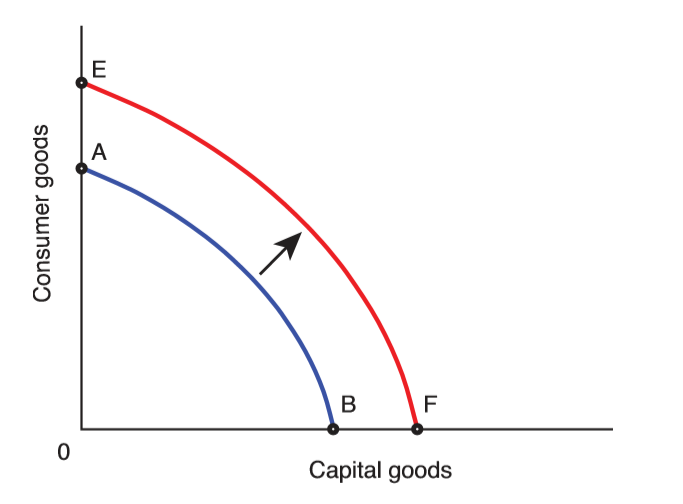
2 Employs a division of labor, allowing specialization
A division of labor refers to how production can be broken down into separate tasks, enabling machines to be developed to help production, and allowing labor to specialize on a small range of activities. A division of labor, and specialization, can considerably improve productive capacity, and shift the PPF outwards.
For most goods, as income rises, the demand for the product will also rise. Such goods are known as normal goods. As income rises, the demand curve for a normal good will increase and shift to the right.
If a product is considered to be inferior, then demand for the product will fall as income rises and the consumer starts to buy higher priced substitutes in place of the inferior good. Examples of inferior goods may be cheap wine or second hand goods.
Q 1.2.2
The prices of the inputs used in the production process determines the costs of production incurred by firms. Assuming it a farmer growing tomatoes, if the prices of one or more of his inputs (e.g. labor, fertilizer, machinery) increase, a smaller quantities of tomatoes will now be produced because it is now too costly to produce. When the production cost is high and the price of output does not increase, it means less profit will be earned, therefore, lower profits decreases the incentive to produce more as well. This will lead to a decrease in supply or shift of the supply curve to the left as shown on the graph below
Q 2.1
Price elasticity of demand is a measure of how much the quantity demanded of a product changes when there is a change in the price of the product, and it is calculated as follows:
2 Time period under consideration
Demand tends to be more price elastic in the long run than in the short run. When the price of a product changes, ceteris paribus, consumers usually need time to adjust to the change in relative prices. When the price changes, consumers take some time to adjust and find new alternatives, therefore even if the price of a product changes, consumers will still buy in the short run, meaning demand will be more inelastic.
$$cross\ elasticity = \frac{percenatage\ change\ in\ quantity\ demannded\ of\ product\ A}{percentage\ change\ in\ price\ of\ product\ B}$$
When the coefficient of cross elasticity is positive it means that the two goods in question are substitutes. A change in the price of product B will lead to a change in the same direction in the quantity demanded of the substitute product A. For example, when the price of chicken increases, more Beef will be demanded, ceteris paribus, as consumers switch to the relatively cheaper beef.
Total product (TP) is the maximum quantities of output that can be produced with the various combinations of the two inputs, given the fact that some of the inputs are still fixed and some are variable
Q 3.1.2
The long run average cost (LRAC) curve is the boundary between unit cost levels that are attainable by the firm and unit cost levels that are unattainable. The long run average cost curve is U shaped and its shape helps indicate what type of returns to scale the firm is experiencing.
The term “returns to scale” refers to the long-run relationship between inputs and output. Returns to scale are measured by varying all the inputs by a certain percentage and comparing the resulting percentage change in production with the percentage change in the inputs. Three possible situations can be distinguished. Philip Mohr and Associates (2015:157)
4.1
Since firms under monopolistic competition have considerable control over its prices or output, it means that they are faced with a downward sloping demand curve. However, demand will be relatively elastic since there are many, only slightly different, substitutes.
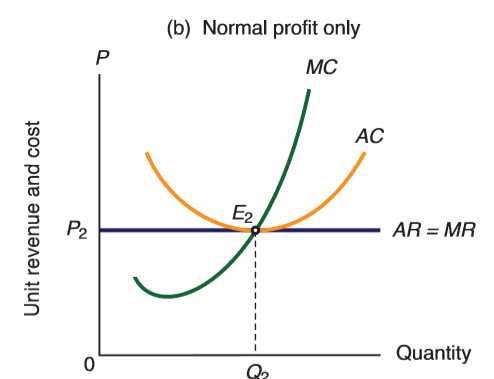
The industry for firms under perfect competition will be in equilibrium in the long run only if all the firms are making normal profits. When firms are making economic profits, this will induce new firms to enter the industry and when this happens, the market (or industry) supply will increase, thus reducing the market price, ceteris paribus. Similarly, firms making economic losses will leave the industry in the long run, thus reducing the market (or industry) supply and raising the market price, ceteris paribus.
https://www.myassignmenthelp.net/monopolistic-competition-assignment-help
Curtis and Irvine, 2000. Principles of micro economics 8th edition