
You are looking see class standing affects the level sales
Homework #1 – Due January 29th, 2015
This worksheet is designed to provide you with opportunities to
 You belong to a student group
who is trying to raise money for a local charity that you feel
passionately about. The top priority of this group is to raise as much
money as possible selling peanuts at the university football games. You
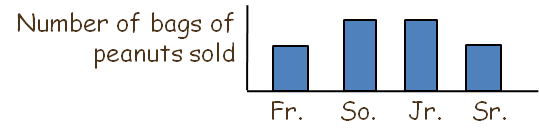
want to know whether class standing (i.e. freshman, sophomore, junior,
or senior) will make a difference in the number of peanuts sold. You are
looking to see if “class standing” affects the “level of sales”. So, for
each student selling peanuts you measure how many peanuts they sold,
then you found an average for each group of students. Your graph looks
like this: Please identify the following variables:
You belong to a student group
who is trying to raise money for a local charity that you feel
passionately about. The top priority of this group is to raise as much
money as possible selling peanuts at the university football games. You
want to know whether class standing (i.e. freshman, sophomore, junior,
or senior) will make a difference in the number of peanuts sold. You are
looking to see if “class standing” affects the “level of sales”. So, for
each student selling peanuts you measure how many peanuts they sold,
then you found an average for each group of students. Your graph looks
like this: Please identify the following variables:Independent variable (IV):______________ Number of levels of IV: ________________
In this study, what is the operational definition of “level of sales”?_____________________
You work for a small company that has recently designed a new program to treat obesity. There is the potential to make large profits, but first you need to test to see if it works. You enroll 100 people who weigh more than 50 pounds more than their ideal weight. You randomly assign half of the people to participate in the program and half to diet however they choose. You are looking to see whether “type of program” (regular diet versus your program) has an effect on “body transformation” (number of pounds lost). When you are finished the data look like this: Please identify the following variables:
What is the operational definition of “type of program”? ___________________________
What is the operational definition of “body transformation”? ________________________
What is the operational definition of “driving efficiency”? ___________________________
What is the operational definition of “driving choice”? ______________________________
nominal, ordinal, interval, or ratio (level of measurement)
Salary: ______________ / __________________ / ______________
(Coke vs Pepsi) qualitative/quantitative discrete or continuous level of measurement
Cities: ______________ / __________________ / ______________
| Temperature: | |
|---|---|
| (Fahrenheit) | qualitative/quantitative discrete or continuous level of measurement |
| SAT scores: |
|
| qualitative/quantitative discrete or continuous level of measurement | |
| Type of car: |
|
| qualitative/quantitative discrete or continuous level of measurement | |
| College major: | |
| qualitative/quantitative discrete or continuous level of measurement | |
| GPA: | |
| qualitative/quantitative discrete or continuous level of measurement | |
| Odometer miles: | |
| qualitative/quantitative discrete or continuous level of measurement | |
| Calories: | |
| qualitative/quantitative discrete or continuous level of measurement | |
| Duration of ad: |
|
| (length of time) | qualitative/quantitative discrete or continuous level of measurement |
Maggie wanted to compare the median salary of male and female lawyers. Using census data she found that the median salary for male lawyers was $66,000 while the median yearly salary for female lawyers was $61,000. Please identify the following information:
Between or within participant design: ____________________
Level of measurement for “Gender”: _____________________ Level of measurement for “Salary”: ______________________ A simple bar graph for these data might look like this:
Step 4: To get the best formatting, click Step 6: Delete the “Series 1” textbox.
on “chart layouts” under the “Design” tab Double click and change the title name and and choose this one. Step 5: It will produce a graph change font to Arial, size 11 or 12. Note please choose carefully they look very similar. that looks like this Your graph should look like this
Quasi or True experiment: __________________________
Dependent variable: __________________________
Propose your own “quasi” experiment, and identify each of the following:
Remember, in order for this study to be a “quasi” experiment it must NOT include random assignment of participants to the different levels of the independent variable. Common quasi-experiments might compare “subject variables” like gender or type of political affiliation or major in school.
Dependent variable (DV): ________________________
What is the operational definition of your DV? __________________________________
d15s_hw1_iv&dv_&excelgraphing.docx