EE306 Electronics Circuit and Systems
ASSESSMENT-7 (15%)
|
Course Title |
: |
Electronics Circuit and Systems | |||
|
Course Code |
: |
EE 306 |
Version No. |
: |
B |
Evaluation
|
Step |
Module |
percentage |
Score |
|
Lab Report |
A detailed written explanation for the particular experiment |
65% | |
|
Individual Evaluation |
Individual evaluation for class participation, theory question and quiz |
35% | |
|
Total |
100% |
REGULATIONS
- Each weekly assessment can be submitted twice within the deadline.
- Weekly assessment submission deadline is 5 days. After the submission deadline, students have a maximum 2-days grace period for late submissions with the following penalty (excluding Fridays):
- First day, within 24h from the deadline, 40% deduction
- Second day, within 48h from the deadline, 60% deduction.
- Failing to submit within two days after notification means that the assessment will be awarded 0.
- In case of plagiarism, you will receive an email to resubmit your work, with the following rule:
- Resubmission within 24h from email notification: 40% deduction
- Resubmission within 48h from email notification: 60% deduction.
- Failing to resubmit within two days after notification means that the assessment will be awarded 0.
- Students have the full responsibility of:
- Submitting the required documents within the deadline
- Verifying that the correct files are submitted
- Verifying that the submitted files are not corrupted.
- Resubmission of student’s work falls under late submission policy.
Note: This Assessment is based on the course Material from Lab 9b. HANDWRITTEN submission will NOT be accepted. You need to submit a Word/PDF file in the provided Turnitin link with the requested format. If you have any queries do not hesitate to contact your instructor via email or Moodle.
1. Theory (15 points)
(For full grade each student is required to answer individually all the questions below)
Explain with your own words the difference between function lsim and freqs. Give examples.
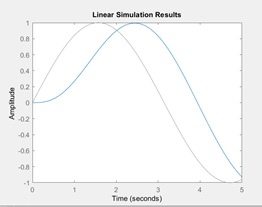
lsim : Simulate time response of dynamic systems to arbitrary inputs, plot the dynamic system according to input (time and system matrix).
t = 0:0.01:5;
u = sin(t);
sys = tf(3,[1 2 3])
lsim(sys,u,t)
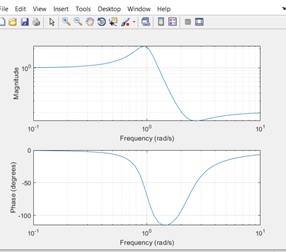
Freqs: Laplace-transform (s-domain) frequency response, this function returns the complex frequency of H filter.
a = [1 0.4 1]; % Numerator coefficients
b = [0.2 0.3 1]; % Denominator coefficients
w = logspace(-1,1); % Frequency vector
freqs(b,a,w)
Write at least 6 lines using your own words a summary of Lab 9b.
Code and Comments (60 points)
A system is described by the following frequency response:

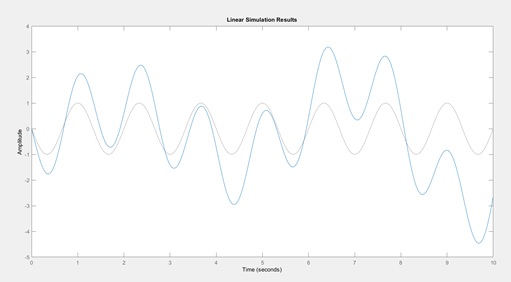
Compute and plot over the time interval the response of the system for the given input signal: (15 points)

t = 0:0.01:10; %time interval
u = sin(3*pi*t/2 - pi); %input signal
sys = tf([3 3 0 -2],[2 0 3 1]) %filter
lsim(sys,u,t) %plot the output
Plot the phase in the frequency interval . (15 points)
plot(t,angle(y))
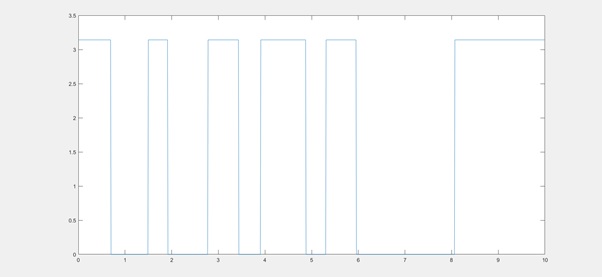
For the block diagram in Figure.1 the below are given: (30 points)
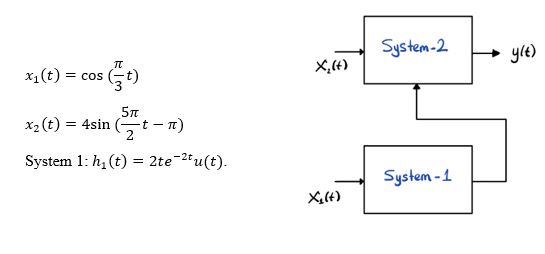
The impulse response of System 2
is the output of System 1.
Figure 1. Block Diagram
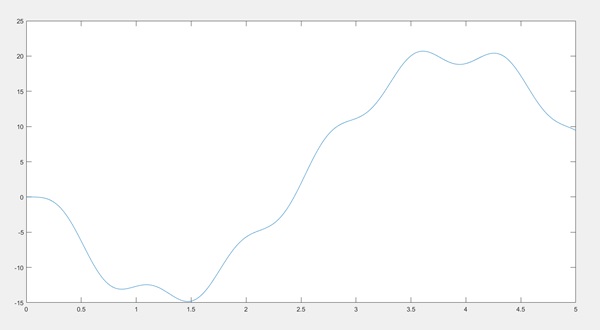
Write the code that computes y(t) for the time interval 0 to 5 seconds and Y(?) for the frequency range 11 to 21 Hz.
t = 0:0.01:5; %time interval
x1 = cos(pi*t/3); %input signal x1
x2 = 4*sin(5*pi*t/2 -pi); %input signal x2
sys1 = tf([2],[1 4 4]) %filter H1
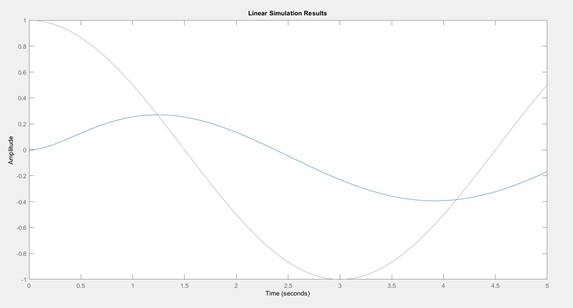
lsim(sys1,x1,t) %plot the output
The H1
%filter the x2 with H2
w = conv(x2,H2);
plot(t,w(1:501))
