G11RE Reservoir Engineering
Institute of GeoEnergy Engineering
G11RE
RESERVOIR ENGINEERING
- Attempt ALL questions. Total 100 marks.
- For descriptive questions provide the answers in your own words and adhere to the word limits shown. Any additional words will not be marked. Equations, numbers or figures are not counted as words.
- For calculation questions clearly state any assumptions and include all intermediate steps.
- Symbols have their usual meaning.
Question 1
A major international energy company has discovered an oil field in offshore Senegal.
Based on a full appraisal of the field the probabilistic representation of the reserves is:
P90: 500 MMstb
P50: 700 MMstb P10: 1000 MMstb.
A commercial analysis has been carried out and relevant government licenses have been obtained. Only small amounts of oil have been produced from formation tests.
Discuss how much of the reserves the company can quote as proved.
(3 marks)
(Word Limit: 90)
Question 2
For a sandstone reservoir the oil and water pressure distributions have been determined as shown in Figure 2.1. Additionally, for a representative core plug the airmercury capillary pressure curve has been measured as shown in Figure 2.2. Estimate the height of the transition zone.
(6 marks)
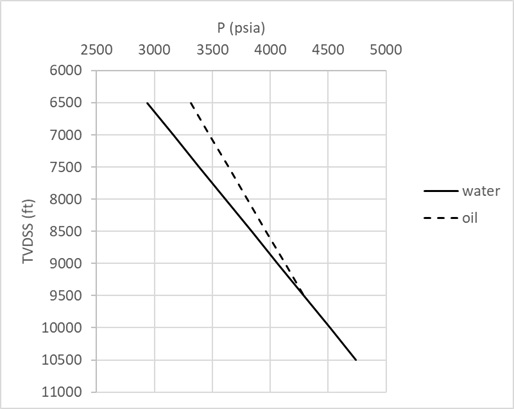
Figure 2.1 – Oil and water pressure distributions.
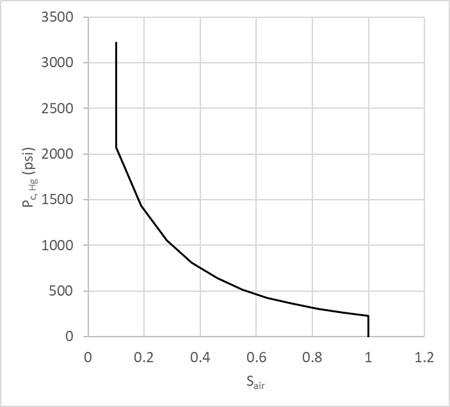
Figure 2.2 – Air mercury capillary pressure curve.
Question 3
Describe the objectives of the flash and differential liberation tests. Discuss how conditions in these tests compare with conditions in the reservoir during production.
(5 marks)
(Word Limit:150)
Question 4
- Using a sketch of the relevant pressure-temperature phase diagram discuss development of a gas condensate reservoir by natural depletion and the potential drawbacks of this recovery mechanism, including the effect of the production rate.
- Using a sketch of the corresponding changes in the pressure-temperature phase diagram discuss how so-called gas cycling may improve recovery from a gas condensate reservoir.
- Discuss whether the black oil model may be used in simulating the development of a gas condensate reservoir.
(10 marks)
(Word Limit: 300)
Question 5
A section of a water-wet oil reservoir consists of three horizontal layers in which a water injector and a producer have been drilled, as sketched in Figure 5.1. The horizontal permeability k2 of the middle layer is about three times larger than the horizontal permeabilities k1 and k3 of the top and bottom layers. The water density is significantly larger than the oil density. The wells have been completed over the full height of the reservoir section.
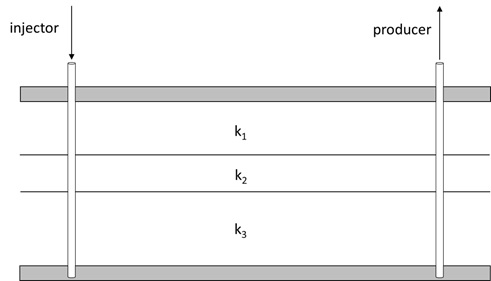
Figure 5.1 – Vertical cross-section of layered reservoir.
Consider a base case water flood scenario for which the vertical permeability is of the same order of magnitude as the horizontal permeabilities, while the oil and water viscosities are approximately the same.
Discuss and sketch the expected water saturation profiles, including three relevant saturation contour lines, in the section between the wells (a) before and (b) after water breakthrough for cases i), ii) and iii) below. Compare the breakthrough times for the various cases.
- For the base case scenario.
- For the base case scenario, but with the oil viscosity much larger than the water viscosity.
- For the base case scenario, but with the vertical permeability several orders of magnitude smaller than the horizontal permeabilities.
(12 marks)
(Word limit 360)
Question 6
- Discuss how rock compression affects oil and gas recovery and how it is incorporated in the material balance equation.
- Name three natural drive mechanisms, or stages of drive mechanisms, for which rock compressibility in an oil reservoir may be neglected and explain why this is the case.
(6 marks)
(Word Limit: 180)
Question 7
An oil field has been discovered in a water depth of 100 meters. Seismic interpretations revealed that the reservoir is divided into two sections by a fault (Figure 7.1). Discovery Well 1 was drilled in the western flank of the structure where no traces of hydrocarbon were found. Discovery Well 2 was drilled on the opposite side of the fault (eastern flank). The mud-log analysis and well log interpretations revealed that the eastern flank contains commercially producible volumes of hydrocarbons. Despite the presence of the fault, it is assumed that an aquifer is present that is continuous across the reservoir.
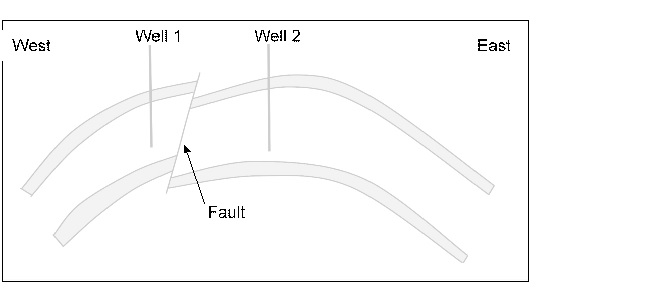
Figure 7.1 – Reservoir cross-section (not to scale)
In Well 1 a single pressure measurement was performed. At a depth of 5,500 ft (TVDSS) the pressure was measured as 2,534.7 psia. From the well logs run in Well 2, an oil-water contact (OWC) was detected at 5,700 ft. A well test program performed early during the appraisal stage on Well 2 produced oil with a constant flowrate of 7,000 stb/d and a corresponding gas flowrate of 10 MMscf/d. Two pressures were also measured in Well 2 as shown in Table 7.1.
Table 7.1 – Pressure measurements in Well 2.
|
TVDSS (ft) |
Pressure (psia) |
|
4,575.00 |
2,319 |
|
4,675.00 |
2,330 |
From the PVT analysis performed on fluid samples taken from both wells the data shown in Table 7.2 was obtained. Assume further that the average reservoir pressure and temperature are 2,500 psia and 120 °F, respectively.
Table 7.2 – Fluid properties.
|
Oil formation volume factor, Bo |
1.45 |
rb/stb |
|
Water formation volume factor, Bw |
1.02 |
rb/stb |
|
Solution gas-oil ratio, Rs |
1,000 |
scf/stb |
|
Gas specific gravity (surface conditions), g |
0.7 | |
|
Oil specific gravity (surface conditions), o |
0.8 | |
|
Water density (surface conditions), w |
64.63 |
lb/ft3 |
i) Identify the gas-oil contact (GOC), if any. ii) In the absence of data regarding the strength of the aquifer, what advice would you give the production engineer to prevent fast decline in reservoir pressure?
(25 marks)
Question 8
A well in an oil reservoir with properties shown in Table 8.1 produces at a constant flow rate of 240.7 stm3/day. Figure 8.1 shows the bottomhole flowing pressures for the first 140 hours of production.
- Using the average reservoir pressure of 263.6 bar at time t = 80 hours, calculate the skin factor.
- Calculate the pressure at the external boundary of the reservoir at time (a) t = 10 hours and (b) t = 100 hours.
(11 marks)
Table 8.1 – Fluid and reservoir properties.
|
Oil formation volume factor, Bo |
1.2 |
rm3/stm3 |
|
Oil viscosity, |
1.2 x 10⁻³ |
Pa s |
|
Permeability, k |
85.8 |
mD |
|
Porosity, |
0.21 | |
|
Compressibility, c |
3.0 x 10⁻⁹ |
Pa-1 |
|
Net formation thickness, h |
20 |
m |
|
Wellbore radius, rw |
0.15 |
m |
|
External radius, re |
325 |
m |
|
Initial reservoir pressure, Pi |
289.2 |
bar |
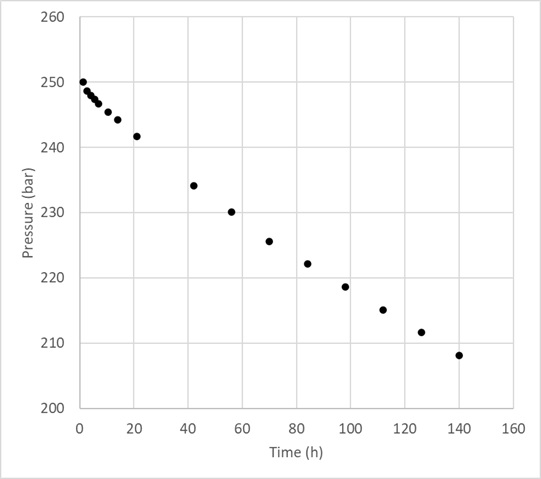
Figure 8.1 – Bottomhole flowing pressure versus time.
Question 9(a)
A water drive oil reservoir is bounded at one edge by an aquifer, as sketched in Figure 9.1. Properties of the aquifer are given in Table 9.1.
Table 9.1 – Aquifer properties.
|
Aquifer length, L |
40,000 |
ft |
|
Permeability, k |
300 |
mD |
|
Effective aquifer compressibility, c |
7.0 x 10⁻⁶ |
psi-1 |
|
Porosity, |
0.23 | |
|
Water viscosity, w |
0.8 |
cP |
Over the first 4 years of production the pressure decline at the oil-water contact is considered to be as shown in Table 9.2. At the end of the first year, 50,000 bbls of water are estimated to have flowed in from the aquifer.
Table 9.2 – Pressure decline.
|
Time (years) |
Pressure (psi) |
|
0 |
6,500 |
|
1 |
6,475 |
|
2 |
6,425 |
|
3 |
6,350 |
|
4 |
6,250 |
- Calculate the cross-sectional area A between the aquifer and the reservoir.
- Briefly discuss an alternative calculation to confirm that the answer to i) is approximately correct. You do not have to carry out the calculation.
- Calculate the cumulative water influx at the end of years 2 and 4.
(14 marks)
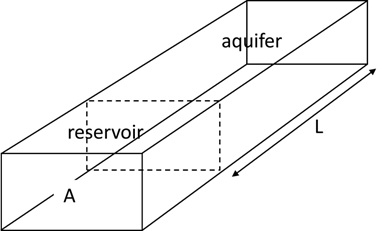
Figure 9.1 – Sketch of reservoir-aquifer geometry.
Question 9(b)
Discuss the step-by-step procedure that Havlena and Odeh proposed to calculate the aquifer influx constant B from the form of the material balance equation shown in Figure 9.2 below. Indicate the data required for this equation and their sources. Discuss also the significance for the aquifer if B varies during the life of the reservoir.
(8 marks)
(Word Limit: 400)
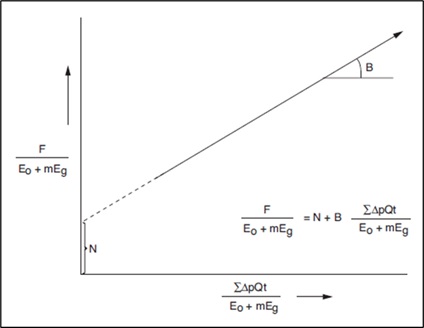
Figure 9.2 – Graph of material balance equation.
Unit Conversion Tables
|
1. ALPHABETICAL LIST OF UNITS | ||
|
To convert from |
To |
Multiply by |
|
acre |
meter2(m2) |
4.046873E+03 |
|
atm |
MPa |
1.013250E-01 |
|
atmosphere |
pascal (Pa) |
1.013250E+05 |
|
bar |
pascal (Pa) |
1.000000E+05 |
|
bar |
MPa |
1.000000E-01 |
|
barrel |
meter3 |
1.589873E-01 |
|
bbl/day |
meter3/day |
1.589873E-01 |
|
centimeter of mercury (0°C) |
pascal (Pa) |
1.333220E+03 |
|
centimeter of water (4°C) |
pascal (Pa) |
9.806380E+01 |
|
centipoise |
pascal second (Pas) |
1.000000E-03 |
|
centistokes |
meter2 per second (m2/s) |
1.000000E-06 |
|
cp |
Pas |
1.000000E-03 |
|
cSt |
mm2/s |
1.000000E+00 |
|
cu in |
meter3(m3) |
1.638706E-05 |
|
cubic yard |
meter3(m3) |
7.645549E-01 |
|
darcy |
m2 |
9.869233E-13 |
|
degree (angle) |
radian (rad) |
1.745329E-02 |
|
degree API |
g/cm3 |
141.5/(131.5+˚API) |
|
degree Celsius |
kelvin (K) |
Tk = Tc + 273.15 |
|
degree Fahrenheit |
degree Celsius |
Tc = (TF -32)/1.8 |
|
degree Fahrenheit |
kelvin (K) |
Tk = (TF + 459.67)/1.8 |
|
degree Rankine |
kelvin (K) |
Tk = TR /1.8 |
|
dyne |
newton (N) |
1.000000E-05 |
|
dyne cm |
newton meter (Nm) |
1.000000E-07 |
|
dyne/cm2 |
pascal (Pa) |
1.000000E-01 |
|
foot |
in (inch) |
1.200000E+01 |
|
foot |
meter |
3.048000E-01 |
|
foot of water (39.2°F) |
pascal (Pa) |
2.988980E+03 |
|
ft lbf |
joule (J) |
1.355818E+00 |
|
ft lbf/hr |
watt(W) |
3.766161E-04 |
|
ft lbf/min |
watt(W) |
2.259697E-02 |
|
ft lbf/s |
watt(W) |
1.355818E+00 |
|
ft/hr |
meter per second (m/s) |
8.466667E-05 |
|
ft/min |
meter per second (m/s) |
5.080000E-03 |
|
ft/s |
meter per second (m/s) |
3.048000E-01 |
|
ft/s2 |
meter per second2 (m/s2) |
3.048000E-01 |
|
ft2 |
meter2(m2) |
9.290304E-02 |
|
ft3 |
meter3(m3) |
2.831685E-02 |
|
g/cm3 |
kilogram per meter3 (kg/m3) |
1.000000E+03 |
|
gallon (U.K.Liquid) |
meter3 (m3) |
4.546092E-03 |
|
gallon (U.S.Liquid) |
meter3 (m3) |
3.785412E-03 |
|
hour |
second |
3.600000E+03 |
|
hydraulic horsepower hhp |
kW |
7.460430E-01 |
|
inch |
meter |
2.540000E-02 |
|
inch |
meter (m) |
2.540000E-02 |
|
inch of mercury (32°F) |
pascal (Pa) |
3.386380E+03 |
|
inch of mercury (60°F) |
pascal (Pa) |
3.376850E+03 |
|
inch of water (39.2°F) |
pascal (Pa) |
2.490820E+02 |
|
inch of water (60°F) |
pascal (Pa) |
2.488400E+02 |
|
kelvin |
degree Celsius |
Tc = Tk - 273.15 |
|
kgf m |
newton meter (Nm) |
9.806650E+00 |
|
kgf s2/m (mass) |
kilogram (kg) |
9.806650E+00 |
|
kgf/cm2 |
pascal (Pa) |
9.806650E+04 |
|
kgf/m2 |
pascal (Pa) |
9.806650E+00 |
|
kgf/mm2 |
pascal (Pa) |
9.806650E+06 |
|
kilogram force (kgf) |
newton (N) |
9.806650E+00 |
|
kilogram mass (kgm) |
lbm |
4.420751E-02 |
|
kilowatthour (kW hr) |
joule(J) |
3.600000E+06 |
|
km/hr |
meter per second (m/s) |
2.777778E-01 |
|
lbf |
N |
4.448222E+00 |
|
lbf/in2 |
GPa |
6.894757E-06 |
|
lbm |
kilogram (kg) |
4.535924E-01 |
|
lbm |
kg |
4.535924E-01 |
|
lbm/ft3 |
kg/m3 |
1.601846E+01 |
|
litre |
meter3(m3) |
1.000000E-03 |
|
micron |
meter (m) |
1.000000E-06 |
|
mile |
meter (m) |
1.609300E+03 |
|
millibar |
pascal (Pa) |
1.000000E+02 |
|
millidarcy |
m2 |
9.869233E-16 |
|
s/ft |
s/m |
3.280840E+00 |
|
ohm centimeter |
ohm meter (m) |
1.000000E-02 |
|
pascal (Pa) |
psi |
1.451000E-04 |
|
poise |
pascal second (Pas) |
1.000000E-01 |
|
pound force (lbf) |
newton (N) |
4.448222E+00 |
|
ppg |
psi/ft |
5.200000E-02 |
|
psi |
MPa |
6.894757E-03 |
|
psi/ft |
kPa/m |
2.262059E+01 |
|
psi-1 |
Pa-1 |
1.450377E-04 |
|
scf/bbl |
standard m3/m3 |
1.801175E-01 |
|
sq in |
meter2(m2) |
6.451600E-04 |
|
stokes |
meter2 per second (m2/s) |
1.000000E-04 |
|
tonne |
kilogram (kg) |
1.000000E+03 |
|
ton (UK) |
kilogram (kg) |
1.016047E+03 |
|
watt |
Js-1 |
1.000000E+00 |
|
yard |
foot |
3.000000E+00 |
SI UNIT PREFIXES
|
multiplication factor |
SI prefix |
Symbol |
|
1018 |
exa |
E |
|
1015 |
peta |
P |
|
1012 |
tera |
T |
|
109 |
giga |
G |
|
106 |
mega |
M |
|
103 |
kilo |
k |
|
102 |
hecto |
h |
|
10 |
deka |
da |
|
10-1 |
deci |
d |
|
10-2 |
centi |
c |
|
10-3 |
milli |
m |
|
10-6 |
micro |
|
|
10-9 |
nano |
n |
|
10-12 |
pico |
p |
|
10-15 |
femto |
f |
|
10-18 |
atto |
a |


