
Petroleum Geoscience Module Exam
Section A
Answer ALL Questions, in the space provided in this book.
A1
What are the main differences between Igneous, Metamorphic and Sedimentary rocks?
(2 marks)
Igneous rocks are formed by crystallization from magma, so are
crystalline (coarse or fine, if intrusive or extrusive…). Metamorphic rocks are also crystalline, this is due to being formed by recrystallization of minerals in solid state while heat and/or pressure is applied by burial/compression/intrusions. Sedimentary rocks are either composed of grains (clastic and organic including some carbonates) or crystals (chemical including some carbonates), if composed of grains they will have void space between grains, creating porosity which allows them to act as reservoirs. Sedimentary rocks can therefore be reservoirs, seals and sources, while igneous and metamorphic rocks will rarely act as reservoirs, and often make good seals being crystalline and therefore impermeable.
A2
Arrange the following chronostratigraphic terms in order of time (from oldest to youngest) and also state which hierarchical rank each term belongs to (Era, Period or Epoch).
Cenozoic, Pliocene, Silurian, Permian, Jurassic, Quaternary, Paleozoic, Cambrian
(2 marks)
Quaternary (period) Pliocene (epoch)
Cenozoic (Era, includes above two) Jurassic (period, in Mesozoic era) Permian (period)
Silurian (period) Cambrian (period)
Paleozoic (Era, includes three above)
A3
Draw a diagram of a normal fault, indicating the location of the hanging wall and the footwall. How are these defined?.
(2 marks) Diagram must show dipping fault plane, with either offset beds or arrows indicating normal movement.
Hanging wall sits above the dipping fault plane, footwall lies beneath the fault plane.
A4
Draw diagrams to illustrate the differences between divergent plate margins in continental and oceanic crust. List the features that might be expected to occur in the vicinity of this type of plate boundary.
(2 marks) Diagrams should show differences in crust thickness and perhaps composition (labels), lithosphere (combination of crust and part of the mantle), normal faulting, volcanoes etc.
Features include, normal fault, volcanic activity, mid-ocean ridge, rift valley, earthquakes, intrusions…
A5
Draw a diagram illustrating a plunging anticline and briefly describe what features make it an anticline and what features make it plunging.
(2 marks) Must show an upfold, with a fold axis inclined from horizontal… An anticline is an upfold (convex up), with oldest strata in the centre, dipping away from the axis. Plunge is when the axis is not horizontal, but at some angle away from horizontal.
A6
Name four secondary sedimentary structures (those sedimentary
structures produced after initial deposition of the sediments)?
(2 marks) Either deformation structures (convolute laminae, slumping, pillow and flame, water escape, dish structures etc), or bioturbation (burrows, tracks, trails etc, but only one or two allowed), or other structures (rain drop imprints, syneresis or desiccation cracks etc).
A7
List four of the golden rules of contour mapping.
A contour line cannot cross itself or any other contour
(2 marks)
A contour cannot merge with contours of the same or different values A contour must pass between points whose values are lower and higher than its own value
A contour line of a given value is repeated to indicate reversal of slope direction
A contour line must close within the mapped area or end at the edge of the map
Or other reasonable rules from the guidelines in Chapter 8…
A8
What lithologies, shapes, arrangements or structures are required to create a stratigraphic trap? Draw some diagrams to illustrate your answer.
(2 marks)
Need to mention:
Traps require suitable reservoir lithology, plus a geometric arrangement to allow oil to migrate in but prevent oil from migrating out, and a sealing layer or lithology to prevent leakage.
Stratigraphic traps are usuallydepositionally isolated reservoir units, or pinch out relationships, or unconformity truncations. They usually require a certain amount of tilting to provide the migration pathway…
A9
Define the frequency and wavelength of seismic waves, and state the formula by which they are related to each other. Draw a diagram to help illustrate your answer.
(2 marks) Frequency is number of cycles per second (Hertz). Wavelength is the length in distance units (m, ft etc), from one point to the identical point on the next wave (max, min, inflection etc). They are related by the inverse relationship, frequency equals velocity divided by wavelength (or reversed…)
A10
List four rules or laws of stratigraphy.
Laws: Superposition Horizontality Continuity Walther’s
Principles:
Present is key to the past Cross-cutting relationships
(2 marks)
A11
What kinds of architecture or depositional environments are likely to result in the highest recovery factors?
(2 marks) Studies show that layer cake architecture, so shallow marine, aeolian, some turbidite deposits have the highest recovery factors.
A12
Draw a diagram illustrating current ripples and their resulting sedimentary structures. State what criteria distinguish current ripples from other bedforms.
(2 marks) Diagram must show ripples, with stoss and lee sides (asymmetric), and cross-lamination. Scale must be shown or mentioned.
Criteria – size (less than 5cm), shape (asymmetric), length/height ratios…
A13
What potential reservoir facies would be deposited in a shallow marine depositional environment, and what would be their geometry? Draw diagrams to illustrate your answer.
(2 marks) Shallow marine deposits have a sheet-like geometry due to the migration of the shoreline (progradation or retrogradation).
Lithologies will include sandstone, siltstone, mudstone, all likely to be bioturbated, all interfingering/layered.
Typical diagrams include the clastic shoreline definitions, a shoreface depositional setting diagram, or the bar migration diagram.
A14
What is the ‘thin bed’ or ‘wedge’ effect in seismic reflection surveys?
(2 marks) Thin bed effect refers to the difficulty in imaging thin beds that have a thickness below the seismic resolution of approximately ¼ wavelength.
Wedge effect refers to the difficulty in resolving the exact location of pinch out due to the bed thinning to below seismic resolution.
The effects arise because below ¼ wavelength, the reflection from the top and the bottom of the bed, presumably opposite in polarity, will cancel each other out during processing, as they will overlap significantly.
A15
What is the difference between permeability heterogeneity and
anisotropy?
(2 marks) Heterogeneity refers to the variability of a property (permeability) in space. A homogeneous rock has the same permeability everywhere. A heterogeneous rock has a variety of permeabilities in different locations. Heterogeneity is measured by the coefficient of variation Cv. For permeability measurements, Cv less than 0.5 is homogeneous, between
- and 1 is heterogeneous and greater than 1 is very heterogeneous. Anisotropy refers to the variation of a property with the direction of the property (measurement). Permeability is a vector, because it is the flow across a pressure gradient, which is directional. Isotropic rocks have the same permeability in every direction. Anisotropic rocks have different permeabilities in different directions. Anisotropy is commonly quantified using the kv/kh
A16
What is biostratigraphy and how is it used in correlation?
(2 marks)
Biostratigraphy is the study or use of fossil data to correlate rock units or determine rock ages.
Fossils represent the preserved (hard) parts of animals or plants that lived while the sediment was being deposited. Studies worldwide have accumulated knowledge about the evolution and extinction of particular
organisms through time, and also about the absolute ages of these events (using radiometric dating techniques).
In a well being investigated, biostratigraphy can give age ranges for the rock units, and particular biostratigraphic events can be used to subdivide the rock stratigraphy and/or correlate rock units that were being deposited at the same time between wells.
Generally, well studies use appearance and disappearance events, assuming that these correlate to evolution and extinction of organisms – an assumption that is only valid if the organism in question rapidly spread after evolution, lived in a variety of depositional environments, and died out concurrently everywhere as well. Therefore only certain organisms are suited for use as biostratigraphic markers.
A17
What processes can occur to create secondary porosity in both clastic and carbonate sedimentary rocks?
(2 marks) Secondary porosity is the development of porosity after initial deposition, either during burial (diagenesis) or during and after uplift (weathering).
Secondary porosity can be created by: Dissolution of grains Dissolution of cement Fracturing
Inter-crystalline porosity developed as a result of recrystallization.
A18
A composite log is being created for a well. A formation top has been encountered at 2449 m TVDSS. Sonic logs suggest that the velocity of the unit between this formation top and the seabed is 1980 m/s. Given that the velocity of sea water is 1400 m/s, and the seabed was encountered at 890 m or 1.271 secs TWT in this well, at what TWT would the reflector corresponding to the formation top appear in a seismic line through this well location (construct a small table to complete this answer)?
(2 marks)
|
Depth (m) |
Thickness (m) |
Velocity (m/s) |
OWT (s) |
TWT (s) |
Cum TWT (s) | |
|
Seabed |
890 |
890 |
1400 |
0.636 |
1.271 |
1.271 |
|
F-Top |
2449 |
1559 |
1980 |
0.787 |
1.575 |
2.846 |
A19
Name four reasons why rocks may be anisotropic?
Grain alignment (highest perm in direction of paleoflow)
(2 marks)
Bedding (differences in grainsize/sorting cause low perm in across-bed direction) including cross-bedding
Continuous or discontinuous shales Cement bands or nodules
Reservoir compartmentalization (layers or channels or other features not in communication with each other, or in limited communication)
A20
The following two successions have been studied at outcrop. What depositional environment do you think each has been deposited in?
- Laterally extensive sheet-like thick layers of red sandstone, large scale cross-bedding subdivided by a complex hierarchy of erosion surfaces and changes in foreset orientation. Individual foresets well sorted, well rounded fine to medium sand. Cross-bedded layers are separated by thinner more poorly sorted sheets of sandstone containing adhesion ripples, lag deposits and
- Repeated sheet-like coarsening upwards successions, each on a scale of ~120 m thick. Each succession comprises (1) basal mudstone containing marine fossils, overlain by (2) sandy mudstone interrupted by thin layers of fine sandstone with hummocky cross-stratification, (3) by swaley cross-stratified fine to medium sandstone, (4) by laminated to cross-bedded medium to coarse
(2 marks)
- Is aeolian
- Is a delta (1/2 mark), specifically a wave dominated delta
A21
Draw diagrams to illustrate the concepts of spill point and lowest known oil in a simple anticlinal reservoir.
(2 marks)
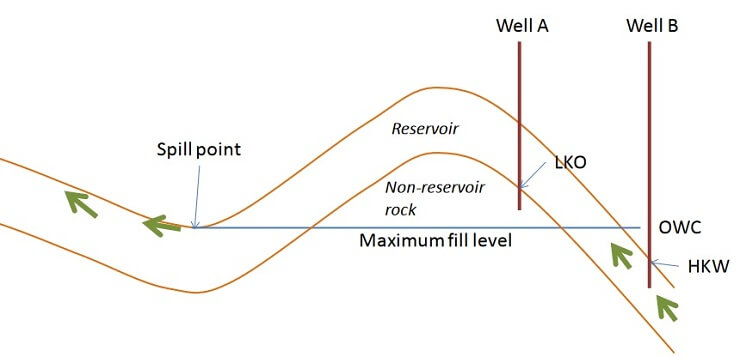
A spill point is the lowest closing contour on a map, or the lowest point on the top surface of the reservoir. At this point, hydrocarbons can escape the trap and migrate elsewhere.
If we imagine that this reservoir is filled to spill, i.e. the maximum fill level is equal to the OWC, then if we had two wells (A and B) drilled where A exits the reservoir without encountering the OWC and B enters the reservoir in the water leg, then we do not actually know where the OWC is. We have two levels, lowest known oil (LKO) and highest known water (HKW), which we can use to calculate maximum and minimum volumetrics.
A22
What architecture or arrangement of strata is likely to have an effective permeability close to the harmonic average of core plug measurement data?
(2 marks) The harmonic average of permeability core plug measurements is usually close to the effective permeability when flow is across the beds (bed series), which occurs in a vertical direction when the beds are near horizontal, or in a horizontal direction when the beds are steeply dipping.
A23
Describe how hydrocarbons are created during burial of sediments.
(2 marks) Hydrocarbons are generated by the alteration/maturation/changing of organic molecules contained within the sediments to mobile and immobile hydrocarbons with increased pressure and temperature.
Good source rocks tend to contain between 5 to 20% organic matter (generally marine or lacustrine mudrocks) although coal may contain above 90%. The different types of organic compounds result in different types of hydrocarbon being generated – algal matter produces oils, plant matter produces gas.
Muddy source rocks require a sufficient amount of hydrocarbon generation to occur, this increases the pore pressure resulting in micro- fracturing which allows migration of the hydrocarbon from source rock to surrounding rocks (primary migration or expulsion).
A24
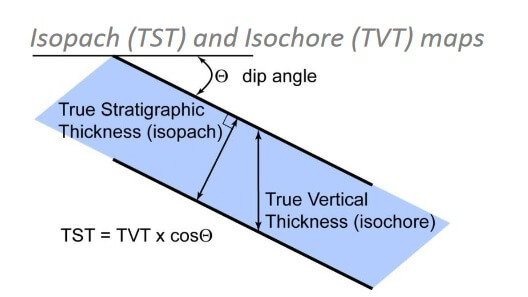
Draw a diagram to illustrate the relationship between true stratigraphic thickness and true vertical thickness. What are the contour maps of these values called?.
A25
What are carbonate sedimentary rocks?
(2 marks)
(2 marks)
Carbonate sedimentary rocks are all those rocks composed of carbonate minerals – i.e. calcite, aragonite and dolomite.
Carbonate sedimentary rocks can be formed by direct precipitation from solution (limestones, dolostones, tufa, travertine) or by accumulation of grains of carbonate derived either from precipitation (ooids) or organic secretion of carbonate minerals as part of shells or skeletons (bioclasts). Organic carbonate rocks include material created ‘in situ’, with no
transportation involved (corals, reefs), or material that has been transported and/or broken down from its original form (shell fragments). Carbonate sedimentary rocks differ from clastic sedimentary rocks in that the carbonate minerals are very reactive and early cementation usually fills all available primary porosity. Therefore later dissolution and fracturing processes are often very important in creating secondary porosity in carbonate reservoirs.
Section B
B1
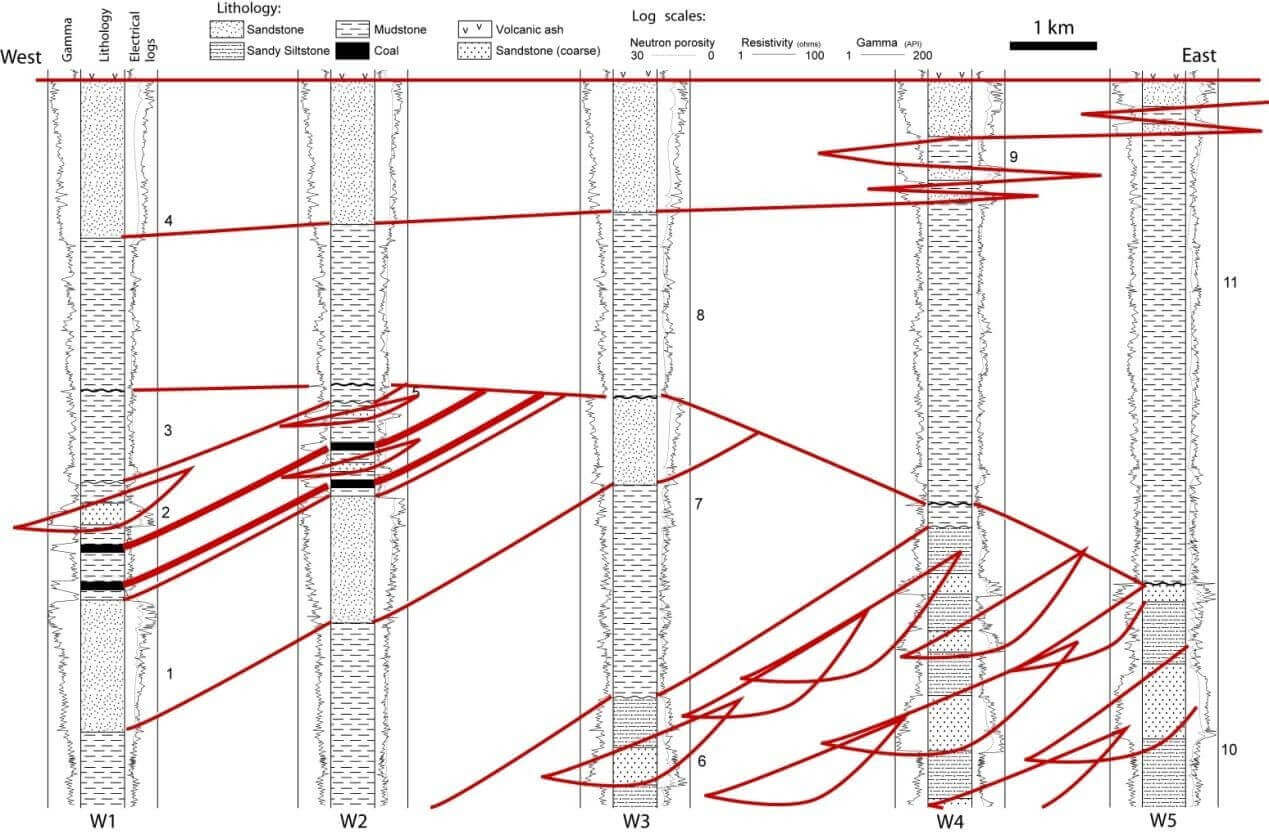
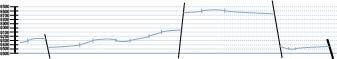
Fossil samples from the locations marked 1, 3, 4, 5, 7, 8, 9, and 11 were found to contain marine fossils. The sample 2 contained palynomorphs consistent with a temperate non-marine environment, while the samples 6 and 10 contained pollen characteristic of an arid non-marine environment. Dipmeter logs combined with initial analysis of the biostratigraphy of the succession has identified a major angular unconformity (change in dip) in the middle of the succession (marked by a bold wiggly line in the logs), and two further unconformities not associated with changes in dip (marked by wiggly lines in the logs) in the succession underlying the angular unconformity. Assume that there is no faulting disrupting the sedimentary packages.
- On the attachment, correlate the various lithologies present. Is this correlation a cross-section or a correlation panel, and why?
(11 Marks)
Cross-section because wells are spaced unevenly (presumably relative to their real spacing) (2 marks)
Neatness (1), connect top and base of units (1), show channels as boat shapes (1), correlate unconformities (3), dipping strata (1), interfingering
(1), cut-off by erosional unconformity (1).
a) Explain your choice of correlation, specifically mentioning your interpretation of the depositional environments.
(6 Marks)
- Marine environments tend to correlate between wells (below and above angular unconformity) (2 marks)
- Non-marine environment with coal = fluvial (1 mark), tends to have channels, no correlation (1 mark)
- Arid environment with sands at odd heights = fluvial (1 mark), channels, may be connected (some at the same relative height to the unconformity) (1 mark).
b) Explain the geological history of the area, starting with the oldest depositional event. Specifically explain the changes in depositional environment and then post-depositional deformation that has affected the succession.
(6 Marks)
Arid fluvial environment, may have connected channel deposits. After unconformity (missing time) marine environment (indicates major subsidence/sea-level rise = transgression).
Marine environment shallows, then becomes non-marine (progradation/delta?)
Another unconformity overlain by marine environment (major subsidence/sea-level rise = transgression).
Burial, tilting/folding, uplift then erosion.
Flooding (subsidence or sea-level rise) results in marine environment.
Progradation of shallow marine sandstones Volcanic eruption event.
(Start right = 1, order = 2, unconformities = 1, tilting/erosion in correct place/order = 1, end right = 1)
c) Identify a potential trap on your correlation. Is this a stratigraphic or a structural trap?
(2 Marks) The sandstone underlying the unconformity are all tilted and truncated by the unconformity overlain by sealing lithologies. These form ideal
stratigraphic traps.
B2
You have been provided with a map of a field and an example log of a well from the same field (Attachments B2-1 and B2-2). .
- Estimate the area covered by the OWC on the map, and then calculate the GRV, assuming that the OWC is within the reservoir thickness. Draw a graph of area versus height to illustrate your working, and state clearly the derivation of your values. Show your working on the
(6 Marks)
Area = 2.675 km2 or 2.675 ×10⁶ m2
GRV (using triangle simplification) = 97.6×10⁶ m3
Marks: 1 for process shown on map, 1 for graph drawn, 2 for correctish area (within 20% +-), 2 for correct calculation of GRV from area.
b) Given the information in the table below, calculate the STOOIP in the reservoir formation. Show all your working and justify your method.
(8 Marks)
|
Unit |
Thickness (ft) |
Porosity % |
Water Saturation % |
Net-to- Gross |
|
Sc |
25 |
1 |
1.0 |
0 |
|
Sh |
25 |
2 |
0.95 |
0.10 |
|
N a-d |
100 |
12 |
0.3 |
0.50 |
|
E |
65 |
18 |
0.15 |
0.88 |
|
R a-b |
184 |
15 |
0.45 |
0.78 |
|
D |
250 |
5 |
0.95 |
0.12 |
Conversion ft to m = 0.3048 Conversion m3 to barrels = 6.285 B0 = 1.22 STB/RB
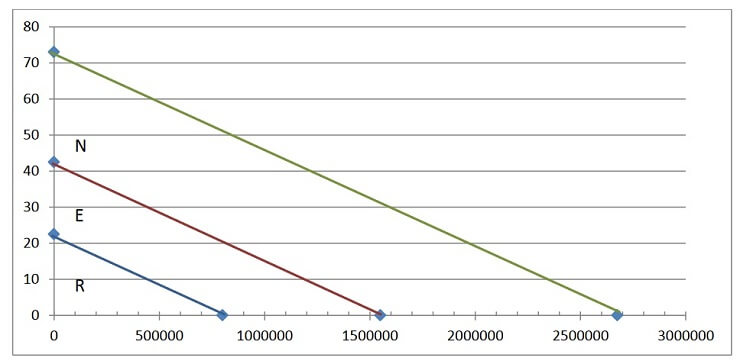
Height points (in m) are 22.5 and 42.5 m – area points are 800000 and 1550000 m2
|
GRV |
STOOIP |
BBLS | ||
|
Total |
97637500 |
Average |
6050323.8 |
38026285 |
|
N |
64700000 |
N |
2227377 |
13999065 |
|
E |
23937500 |
E |
2641758.2 |
16603450 |
|
R |
9000000 |
R |
474713.11 |
2983572 |
|
Total N- E-R |
5343848.4 |
33586087 |
a) Draw a sketch showing your interpretation of the reservoir structure and internal layers from NW to SE across the map (accuracy is not required for this question).
(6 Marks) Sketch must show normal fault dipping to W, top surface dipping to east, and may or may not show the eastern boundary normal fault. Sketch should show OWC and NER layers within the reservoir.
b) Given that the units R, E and N form a prograding delta system, explain why the different units have different reservoir properties, and what differences in production efficiency may we expect from them?
(5 Marks)
The R and E units form a prograding delta front with shoreface
successions – relatively high N/G and porosity, coarsening upwards. The sharp drop in N/G and other factors in the N formation suggests this might be delta top facies (fluvial).
B3
An old set of paper 2D seismic lines has been made available over a potential field, along with a depth conversion algorithm based on well data. Based on the initial interpretation of these lines, the top reservoir surface has been identified and some normal faults have also been located. Depth data in feet for discrete points along the lines and the fault locations have been plotted on the attached base map (Attachment B3). The OWC in the field has been identified as occurring at 9200 feet.
- On the attachment, contour the depth data provided using a contour interval of 100 feet. What type of map is this? Label the OWC, and shade in the area within which oil
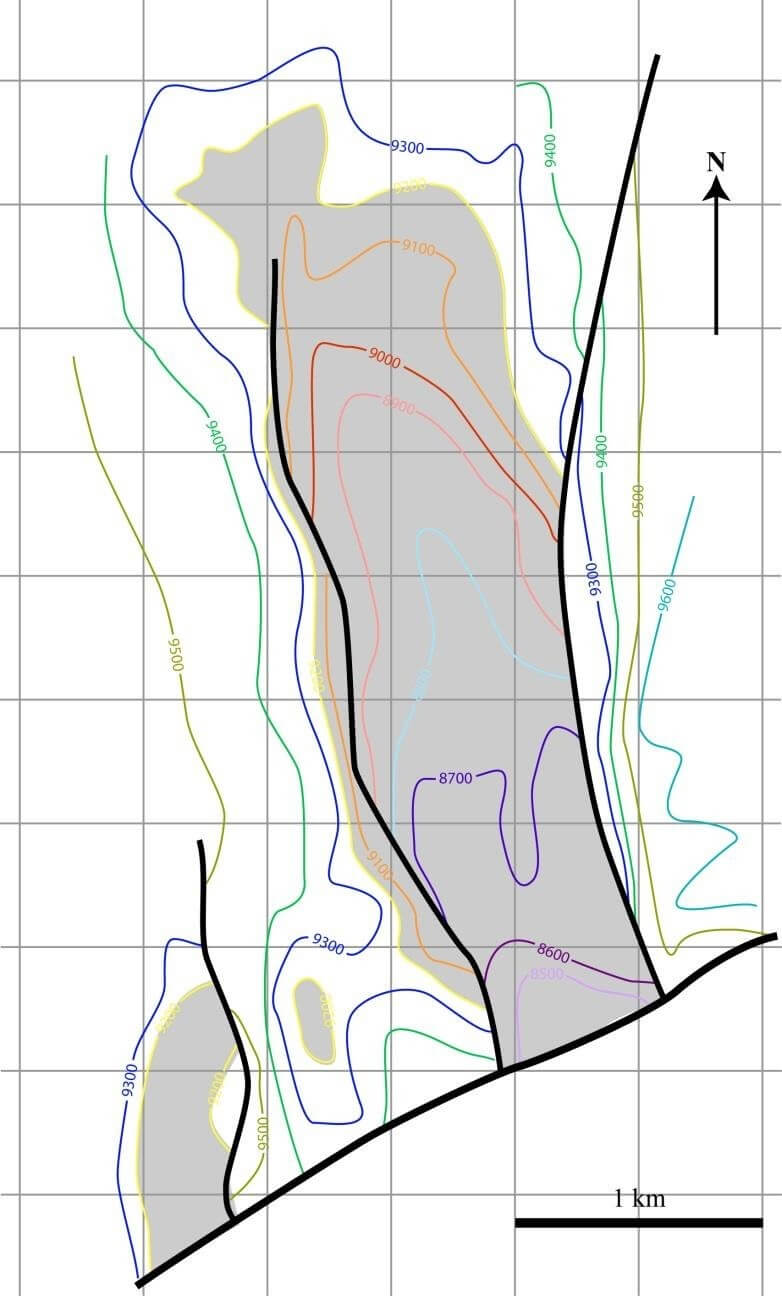
Marks: Reasonable contours – 6 marks.
Structure contour map – 2 marks.
OWC labelled – 1 mark Shaded area – 1 mark, including smaller pockets
– 1 mark.
Neatened contours – 1 mark.
a) Draw a cross-section of the reservoir top surface on a west-east alignment – carefully plotting the location of your cross-section on the map. Do NOT use any vertical exaggeration.
Marks: Faulted surface with reasonable curves etc – 3 marks, no vertical exaggeration – 2 marks, E-W – 1 mark, plotted on map – 1 mark, Faults angled to be normal – 1 mark.
a) Describe the structure represented in your map and cross- section.
(5 Marks)
Horst and Graben Faulted surface
Dipping strata/folded strata faulted two ways (reasonable combination of these descriptive terms).
B4
The following core plug permeability measurements have been made available for a well in a sandstone reservoir:
|
Depth (m) |
Permeability (mD) |
|
3210.00 |
56.00 |
|
3210.30 |
302.00 |
|
3210.60 |
294.00 |
|
3210.90 |
167.00 |
|
3211.20 |
61.00 |
|
3211.50 |
301.00 |
|
3211.80 |
286.00 |
|
3212.10 |
252.00 |
|
3212.40 |
167.00 |
|
3212.70 |
66.00 |
|
3213.00 |
315.00 |
|
3213.30 |
252.00 |
|
3213.60 |
167.00 |
|
3213.90 |
132.00 |
|
3214.20 |
72.00 |
- Calculate the arithmetic, geometric and harmonic averages, the median and the mode for this
(10 Marks)
|
Arithmeti |
Geometri |
Harmonic |
Median |
Mode |
|
192.67 |
163.02 |
132.1897 |
167 |
167 |
(2 marks each)
b) The variance for the data is 9782, and the Cv is 0.51. Is the data homogeneous, heterogeneous or very heterogeneous?
(2 Marks)
Heterogeneous
c) The following table contains a partial variogram calculation. Given the formula for the variogram function given below, calculate the normalised gamma for the lags 4 and 5 and complete the graph.
(6 Marks)
|
Lag Distance | ||||||||
|
Perm (mD) |
1 |
2 |
3 |
4 |
5 |
6 |
7 |
8 |
|
56.00 | ||||||||
|
302.00 |
60516 | |||||||
|
294.00 |
64 |
56644 | ||||||
|
167.00 |
16129 |
18225 |
12321 | |||||
|
61.00 |
11236 |
54289 |
58081 |
25 | ||||
|
301.00 |
57600 |
17956 |
49 |
1 |
60025 | |||
|
286.00 |
225 |
50625 |
14161 |
64 |
256 |
52900 | ||
|
252.00 |
1156 |
2401 |
36481 |
7225 |
1764 |
2500 |
38416 | |
|
167.00 |
7225 |
14161 |
17956 |
11236 |
0 |
16129 |
18225 |
12321 |
|
66.00 |
10201 |
34596 |
48400 |
55225 |
25 |
10201 |
51984 |
55696 |
|
315.00 |
62001 |
21904 |
3969 |
841 |
196 |
64516 |
21904 |
441 |
|
252.00 |
3969 |
34596 |
7225 |
0 |
1156 |
2401 |
36481 |
7225 |
|
167.00 |
7225 |
21904 |
10201 |
0 |
7225 |
14161 |
17956 |
11236 |
|
132.00 |
1225 |
14400 |
33489 |
4356 |
1225 |
14400 |
23716 |
28561 |
|
72.00 |
3600 |
9025 |
32400 |
59049 |
36 |
9025 |
32400 |
45796 |
|
Count |
14 |
13 |
12 |
11 |
10 |
9 |
8 |
7 |
|
SUM |
242372 |
350726 |
274733 |
138022 |
71908 |
186233 |
241082 |
161276 |
|
Gamma |
8656.143 |
13489.46 |
11447.21 |
6273.727 |
3595.4 |
10346.28 |
15067.63 |
11519.71 |
|
NormGamma |
0.884884 |
1.378975 |
1.170203 |
0.641339 |
0.367544 |
1.05766 |
1.540304 |
1.177615 |
|
VAR |
9782.24 | |||||||
(calculation of gamma 2 marks, calculation of normalised gamma 2 marks, graph 2 marks)
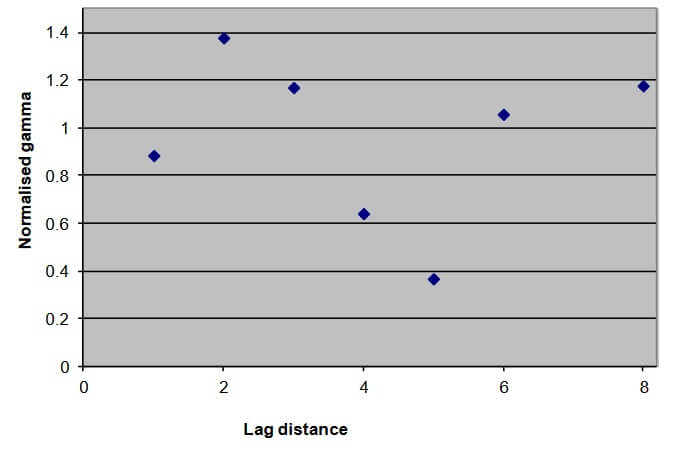
d) On the variogram plot, identify SILL, RANGE, NUGGET, and HOLE.
(4 marks) Sill – students may indicate correlation of highest four values, or normalised gamma = 1 ish, or they may state that this data has no sill. Either is correct – 1 mark
Range – if a sill is drawn, then the range is to the start of the sill (in lag distance). If no sill, no range – 1 mark
Nugget – connect the first two points, extrapolate to y axis, this is the nugget – 1 mark
Hole is the lowest point in the data after the start, i.e. lag 5 – 1 mark
e) What does the presence of a hole imply about the data being
plotted? At what scale in meters is this feature (state ‘lag distance’ and then translate into meters distance)?
(3 Marks)
A hole in a variogram indicates that data at that lag distance is
correlated, or is of similar values. Therefore a hole at lag 5 indicates that every 5th data point is similar to the original point, indicating cyclicity or bedding. Since the data is plotted at every 30 cm, a hole at 5 lags is 5 times 30 cm, equals 1.5 m.
