ECEN 214-516 Sinusoidal Steady State Response of a 2nd Order Circuit
ECEN 214-516
Post-Lab 8
Sinusoidal Steady State Response of a 2nd Order Circuit
Procedure
Task 1: Sinusoidal Steady-State Response of a 2nd Order Low-Pass Circuit
- First we built the Sallen-Key circuit as shown in Figure 1.1. We used the values found in prelab for the values of R1, R2, C1,and C2.
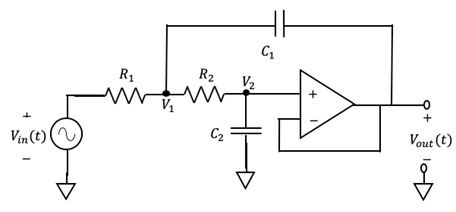
Figure 1.1: Sallen-Key 2nd Order Circuit
- We set up test probes so we would be able to test the input voltage, output voltage, and the phase difference between the input and output.
- Next, we made those three measurements for thirteen different input frequencies.
- Then, we changed the frequency to result of an input:output ratio of about 0.707.
- Once the cut-off frequency was determined, the phase difference was also recorded.
Task 2: Sinusoidal Steady-State Response of a 2nd Order High-Pass Circuit
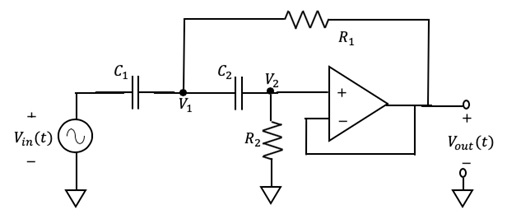
- First we built the Sallen-Key circuit as shown in Figure 2.1. We used the values found in prelab for the values of R1, R2, C1,and C2.
Figure 2.1: Modified Sallen-Key 2nd Order Circuit
- We set up test probes so we would be able to test the input voltage, output voltage, and the phase difference between the input and output.
- Next, we made those three measurements for thirteen different input frequencies.
- Then, we changed the frequency to result of an input:output ratio of about 0.707.
- Once the cut-off frequency was determined, the phase difference was also recorded.
Data and Results:
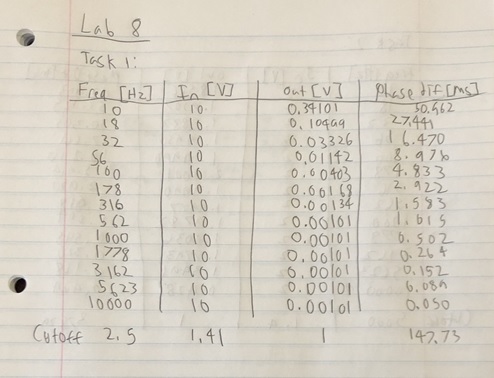
Task 1: Sinusoidal Steady-State Response of a 2nd Order Low-Pass Circuit
|
Task 1 | |||
|
Frequency [Hz] |
Input Amplitude [V] |
Output Amplitude [V] |
Phase Diff [ms] |
|
10 |
10 |
0.34101 |
50.962 |
|
18 |
10 |
0.10499 |
27.441 |
|
32 |
10 |
0.03326 |
16.470 |
|
56 |
10 |
0.01142 |
8.976 |
|
100 |
10 |
0.00403 |
4.833 |
|
178 |
10 |
0.00168 |
2.922 |
|
316 |
10 |
0.00134 |
1.583 |
|
562 |
10 |
0.00101 |
1.015 |
|
1000 |
10 |
0.00101 |
0.502 |
|
1778 |
10 |
0.00101 |
0.264 |
|
3162 |
10 |
0.00101 |
0.152 |
|
5623 |
10 |
0.00101 |
0.089 |
|
10000 |
10 |
0.00101 |
0.050 |
|
Cut-Off | |||
|
2.5 |
1.41 |
1 |
147.73 |
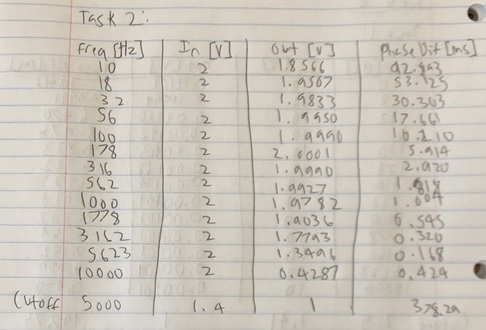
Task 2: Sinusoidal Steady-State Response of a 2nd Order High-Pass Circuit
|
Task 2 | |||
|
Frequency [Hz] |
Input Amplitude [V] |
Output Amplitude [V] |
Phase Diff [ms] |
|
10 |
2 |
1.8566 |
92.898 |
|
18 |
2 |
1.9507 |
53.125 |
|
32 |
2 |
1.9833 |
30.303 |
|
56 |
2 |
1.9950 |
17.661 |
|
100 |
2 |
1.9990 |
10.210 |
|
178 |
2 |
2.0001 |
5.914 |
|
316 |
2 |
1.9990 |
2.920 |
|
562 |
2 |
1.9927 |
1.818 |
|
1000 |
2 |
1.9782 |
1.004 |
|
1778 |
2 |
1.9036 |
0.545 |
|
3162 |
2 |
1.7793 |
0.320 |
|
5623 |
2 |
1.3496 |
0.168 |
|
10000 |
2 |
0.4287 |
0.424 |
|
Cut-Off | |||
|
5000 |
1.41 |
1 |
378.29 |
Discussion
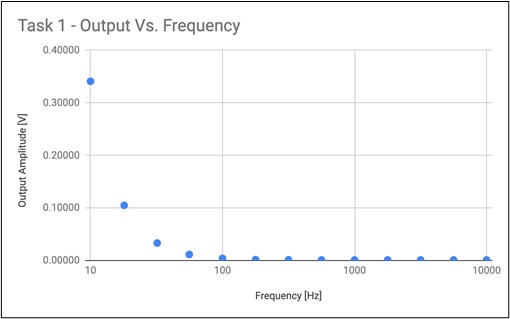
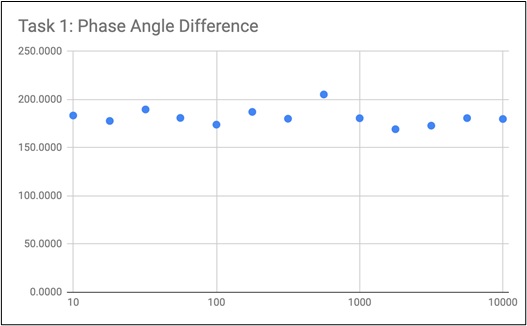
The lab went pretty much as expected over all. For task 1, the pass and stop band started at around 100 Hz and goes to the highest frequency we had. For task 2, the pass and stop band starts at 10 Hz, the lowest frequency, and ho to about 1000 Hz. This shows that the two circuits pretty much behave exact opposite of eachother. I would say that I would change the values of the resistors and/or capacitors to shift the pass and stop bands. In our lab, we didn’t find any values where the output is higher than the input. Even though we did not get these values, I can see how it could occur given the data that we observed. The reason it can happen considering the conservation of energy is because the op-amp has an additional power source. Over all the lab was pretty good, maybe some changes would be to try frequencies higher/lower to get a more leveled off curve. In addition, we couldn’t find a feature to measure the phase difference of the output and input, if we had a better way to test that we would have had much better results.
Conclusion
Over all, this lab was very insightful into the way that the Sallen-Key Circuit works. I find it very interesting that there are so many ways to use op amps to achieve different effects. I noticed that simply flipping the placement of the resistors and capacitors had such a dramatic impact on the way the circuit worked. It is also useful to know how to find the cut-off frequency because that would be important to know when possibly making some type of wired communication circuit.
Resources
- 24 x 7 Availability.
- Trained and Certified Experts.
- Deadline Guaranteed.
- Plagiarism Free.
- Privacy Guaranteed.
- Free download.
- Online help for all project.
- Homework Help Services

