
Experiment 4 find the value of G using a pendulum using Phet
OBJECTIVES
To determine the value of acceleration due to gravity by using a simple pendulum.
EQUIPMENT
PhET Pendulum Lab: https://phet.colorado.edu/en/simulation/pendulum-lab
You can also get to the simulations by entering in your browser: Phet, then select Physics. Then select Pendulum-lab simulation.
THEORY
Whenever a restoring force is created due to displacement of a body from its mean (equilibrium) position, the restoring force tries to bring the body back to the original (mean) position. If the restoring force is proportional to the displacement from the mean position, the resulting vibratory motion is called simple harmonic motion. A linear restoring force may be expressed mathematically by the equation
F = -k Δx (1)
where F is the force (N), Δx (m) is the displacement from the equilibrium point, and k (N/m) is a proportionality constant. The minus sign expresses the restoring nature of the force by indicating that the direction of F is always opposite to the displacement Δx from equilibrium.
For vibratory motion we have the following definitions:
Amplitude, A: The maximum displacement from the equilibrium point on either side. (unit: m)
Cycle: One complete vibration. (no units)
Time Period, T: The time required for one complete cycle. (unit: s)
Frequency, f: The number of cycles completed per second (= 1/T). (unit: s-1)
Further analysis of the vibrations resulting from a linear restoring force shows that the Time Period is given by:
(2 )
where T is the Time Period, m is the mass of the vibrating body, and k is the proportionality constant from Equation 1.
Two physical examples of this type of force are considered in the present experiment, the simple pendulum and the spring-mass system.
SIMPLE PENDULUM
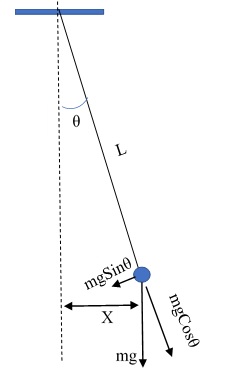
This consists of a concentrated mass suspended at the end of a cord of negligible weight, such as a small metal sphere on a long, thin thread, as shown in Fig. 1. The sphere has been pulled aside to a horizontal distance x, and the thread consequently makes an angle θ with the vertical. The vertical line through the suspension point is at X = 0, which is the equilibrium position. From Fig 1:
For small θ, we have Sin θ ≈ θ, and m g Sinθ ≈ m g θ.
Now θ = S / L, where S is the distance that the mass has moved along the arc, between the equilibrium position and the new position. For small θ, X ≈ S, and we get: θ = X / L. The net force then becomes:
m g Sinθ ≈ m g θ = m g X / L = (m g / L ) X.
In eqn. (1), the k becomes the same as mg/ L, and the equation for the time period becomes:
(3)
By measuring the value of the Time Period of a pendulum of length L, we can calculate the value of acceleration due to gravity, g.
Figure 1: Simple Pendulum
PROCEDURE
SIMPLE PENDULUM
Open the simulation: Pendulum Lab in PhET. Select “INTRO”.
- Select the length of the string. Select a mass, Select Gravity = Earth, Friction = 0.0, and normal (not slow).
- Displace the mass to one side, so that the string makes an angle of around 5° with the vertical (i.e. keep a small amplitude). Release the mass and let it oscillate. Start the stopwatch (on lower left of the screen) when the mass is at one extreme end and note the time for 25 cycles (or vibrations). Calculate the time for one cycle (= T ). Enter the data in Table-1.
- Decrease the length of the pendulum in increments of 5.00 cm till it is around 60 cm and find the time for 25 vibrations (and hence for T) for each of the lengths. Use this data to draw a graph between T2 on the y-axis vs L on the x-axis. Obtain the value of ‘g’ by finding the slope of the line. Enter the data in Table-1.
- Repeat steps 1 to 3 by starting with a different length, and using a mass of about twice or half) of that used earlier. Use Table 2 for this data.
CALCULATIONS
1- Use the data from procedures 2 and 3, to obtain the time period T for each length L. Then plot T2 on the y-axis versus L on the x-axis. Using the Least Square Line method (see the lab manual on Error Analysis), fit a straight line to this data. The slope of this line is 4π2/g. Use the slope to find the value of acceleration due to gravity, g. Compare this with the accepted value and find the percent error.
DATA: SIMPLE PENDULUM
Table 1
|
Length of pendulum, L |
Number of vibrations, N |
Time for N vibrations, t |
Time period, T =N/t |
Period squared T2 |
Value of ‘g’ found from the graph: _________ Percent error in ‘g’: _________ (attach graph)
Table 2
|
Length of pendulum, L |
Number of vibrations, N |
Time for N vibrations, t |
Time period, T =N/t |
Period squared T2 |
Value of ‘g’ found from the graph: _________ Percent error in ‘g’: _________ (attach graph)
Average value of ‘g’: ____________
Percent difference in the two values of g: _____________
Resources
- 24 x 7 Availability.
- Trained and Certified Experts.
- Deadline Guaranteed.
- Plagiarism Free.
- Privacy Guaranteed.
- Free download.
- Online help for all project.
- Homework Help Services
