
Integration of symbolic calculator in mathematics lessons
the long-term Project “Integration of Symbolic Calculator in Mathematics Lessons” – The case of Calculus
University of Wuerzburg
A long term project (2003 – 2011) was started to test the use of symbolic calculators (SC) in grammar schools in Bavaria (Germany). The project was firstly done in grade 10. During the 2006/07 school year the pilot project was implemented in Year 11. 732 students at 10 Bavarian grammar schools took part in an empirical investigation. The content taught was calculus: basic properties of functions, limits, continuity, derivatives, and applications of calculus. The evaluation of the project was intended give answers to the following questions: how basic mathematical skills (algebraic transformations, solving equations) changed; how the students used the SC, how they evaluated the use of the new tool. This article presents the results of this project for school year 2006/07.
1. Background
In the past, many empirical investigations concerning the use of CAS or symbolic calculators (with CAS) in mathematics teaching have been published (see Guin, Ruthven and Trouche, 2005). The central results of these projects have meanwhile been confirmed by other investigations world wide. The use of a CAS brings a greater meaning to work with diagrams, reinforces experimental work, in which the assumptions were obtained through systematic testing and CAS appears to bring an increase in computer cooperative forms of work. The effects are primarily long term. It is therefore necessary to develop a namely educational concept to evaluate the changes in knowledge and abilities over a longer time period. However, many investigations in this area restrict themselves to the applications of the computer over “just” a few weeks (Schneider, 2000, Drijvers, 2003, Pierce and Stacey, 2004 and Guin et al, 2005) and do not show the long-term effects on the knowledge and ability of the students.
In the school year 2003/04 we started a long term project to test the use of symbolic calculators (SC) – the TI-Voyage 200 and the TI-Nspire – in grammar schools (Gymnasien) in Bavaria (Germany). The project was done in grade 10 and has been repeated in the following two school years with a greater number of model classes and with – concerning the use of new technologies – inexperienced teachers. The main content of grade 10 in Germany is working with polynomial, exponential and trigonometric functions. An overview of the empirical investigation of this project gives Weigand (2008). On account of the positive results of this project, the Bavarian Ministry decided to continue the project. The follow-up project was started in September 2006.
2. THE TEACHING PROJECT – Grade 11
2.1 The participants
During the 2006/07 school year the pilot project was implemented in Year 11. A total of 732 students at 10 Bavarian grammar schools took part in this project. 412 students in 16 classes acted as the “pilot project classes”, working with Voyage 200 and / or TI-Nspire. In addition, 320 participants from 11 classes formed a control group for the purposes of quantitative statistical investigation. The students had different previous experiences; some students had been exposed to the SC in the previous Year 10, but other students came into contact with these systems for the first time during this project.
2.2 The teachers
The pilot project M3 was mainly taught by teachers with little experience of tuition using computer algebra systems (CAS). The project teachers held two three-day meetings during which examples of possibilities and opportunities for SC use were discussed. The teachers jointly prepared a number of suggestions for a range of teaching units intended to highlight the possibilities of using SCs; during the year, the teachers were offered additional learning units[1] by the coordinator (E. Bichler). However, there was no uniform overall concept according to which tuition was to be organised in all classes. The personal experience, attitudes and circumstances at the individual schools were too different for this to be possible.
2.3 The learning contents
In Year 11, calculus is taught (in Germany). The content taught was subdivided into the following:
- basic properties of functions (symmetry, monotonicity, variations in function terms and their impact on graphs, …)
- limits, continuity
- differentiability, derivation rules, derivation function(s)
- applications of differential calculus (“classical” functions discussion, extreme value problems)
2.4 Research questions:
The pilot project is based on the following questions:
- Can any differences be ascertained in terms of core mathematical abilities (substitutions, interpretation of graphs, solving equations, working with tables, and working with formulae) between the pilot and the control groups after one year?
- Can different effects of SC use be ascertained with “good”, “average” and “weak” students?[2]
- To what extent have students mastered the SC at the end of the year?
- In what time frame do the students in the pilot project classes use the SC for problem solving?
- With which representation levels (graphic, symbolic, numerical) do the students in the pilot project classes work?
- What attitudes do the students in the pilot project classes develop in relation to the new tool?
- What attitudes do the teachers involved in the project develop in relation to the new tool and teaching with the new tool?
- Are there differences between boys and girls?
2.5 Test instruments
For the purpose of answering the 1st and 2nd questions we took a (classical) pre- and post-test-design – the tests using paper and pencil but no calculator –in pilot and control classes.[3]
For the purpose of answering the 3rd, 4th and 5th questions the project classes took a test using a SC in February 2007 and June 2007 in which they were asked to record their working methods with the SC in a questionnaire which they completed immediately after the test. For the purpose of answering the 6th and 7th questions the teachers of the project classes completed an online questionnaire each month and an evaluation questionnaire at the end of the year. The students completed an online evaluation questionnaire which was intended to provide information regarding their experiences and their attitude to the SC. For the purpose of answering the 8th question pre- and post-tests were evaluated according to sex.
3. Evaluation of pre- and post-tests
3.1 The questions
The questions (see appendix) can be divided into the following groups:
- Questions 1 to 3: doing “classical” simplification of terms
- Question 4: solving equations
- Question 5: understanding the concept of root functions
- Questions 6 – 8: seeing the correlation between graph and term
- Question 9: interpreting graphs
3.2 Comparison of results of pre- and post-tests
The post-test was the same as the pre-test. In the following diagram, the differences between the average scores achieved for each question in the pre- and post- tests for the M3- and the control group are shown. The “average performance increase” is therefore measured for each question.
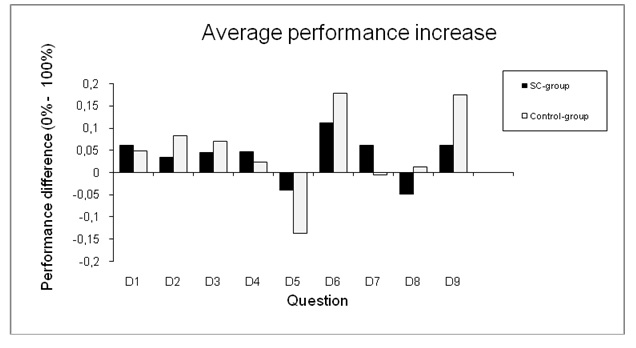
Table:1 Average performance of the project- and the control-group
In questions 5 and 7 the project classes' results are significantly better than than those of the control groups (t-Test: 5: 0.01, 7: 0.02). However, in questions 6 and 9 they are significantly worse (t-Test: 6: 0.01, 9: 0.01).
Overall there is not a significant difference in the average performance increase between the project and control classes. For the comparatively worse result of the M3 classes compared with the control classes (especially for questions 6 and 9), there are two possible hypotheses. On the one hand it could be due to the fact that the students in the project classes were no longer adequately motivated to tackle this type of “traditional” question with enthusiasm, as they had tackled much more interesting questions during lessons – due to the SC. On the other hand the poor results of the pilot project classes when determining functional equations from specified graphs (question 6) could be due to the fact that the students in the project classes had seen a large number of graphs – compared with the control group – during the course of the year and were therefore overtaxed by the diversity. However, the students in the control class have probably worked more often with the sine function graph which had been introduced in Year 10.
If, however, the range of performance increases is considered, an interesting picture emerges.
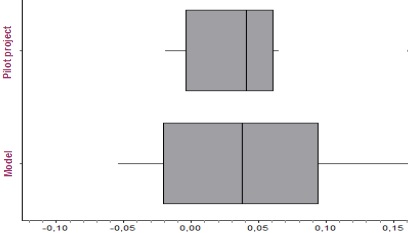
Table 2: Average value and range of performance increases in project and control groups
With an almost identical average value, it becomes apparent that the differences in performance are more varied with the students in the pilot classes than with the students in the control groups. Therefore, there are students in the pilot project classes who benefit more from SC use than students in the control classes. However, there are also students whose results deteriorate compared with the initial test.
The test results can also be interpreted in a positive way for the project classes, as there are no differences in terms of classical technical and manual abilities and skills. However, this investigation has deflated hopes that the ability to interpret graphs and transfer between different forms of representation are automatically improved by the use of the SC. It remains questionable whether the students in the project classes were being adequately challenged or motivated due to the largely classical nature of the test questions.
3.3 Scores for “good”, “average” and “weak” test participants
In accordance with the results of the initial test, we divided the test participants into “weak”, “average” and “good”.[4] The following result is produced when the performances of these groups are compared in terms of pre- and post tests.
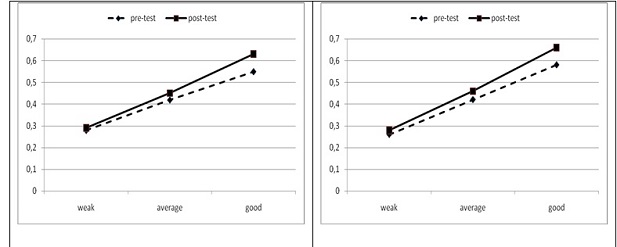
Table 3: Performances of the project group (left) and the control group (right)
Compared with tests carried out in recent years in Year 10 (see Weigand 2008), different behaviour was demonstrated here. Whilst the “weak” students achieved a greater performance increase than the “average” and “good” students in Year 10, the “good” students – both in the control and pilot project groups – improved more markedly (by 8 percentage points) than the “average” and “weak” students (by 3 percentage points and 1-2 percentage points respectively) in the Year 11 test.
The differences between the “weak” and “good” groups can be found in the understanding of concepts (question 5) and the transfer between different forms of representation (between graph and equation - questions 8 and 9)). The lack of performance increase in the case of weak students is attributable to the greater cognitive challenges posed by calculus, which may have taken some students to the limits of their capacities so that they were no longer able to follow lessons (“dropout effect”).
3.4 Comparison between girls and boys
Throughout the entire test, there are no (significant) differences between boys and girls. Only in the case of question 2 and question 5 (both questions concern substitutions), the boys in the pilot project classes improve significantly more than the girls.
4. The Symbolic-Calculator-tests (SC-Tests)
4.1 Research questions
In February and in June the pilot classes took a test where they were allowed to use the SC. Use of the SC was optional for the students, i.e. they decided themselves whether or not they would use the calculator. The two tests consisted of four questions each.[5] In order to establish how calculators were used, we applied a new investigation method: the students completed a questionnaire on SC-use immediately after the test, giving details of whether and how they used the calculator. This test was intended to answer the following questions:
- How do students use the calculator?
- When – in terms of the phases in the problem solving process – do the students use the calculator?
- Which functionalities (symbolic – graphic – numerical) do the students use?
In addition, the teachers were presented with a questionnaire regarding the questions immediately before the test, in which they were intended to provide details of the difficulties expected in terms of the questions.
In the following, only a few spotlights of the results will be given.
4.2 Actual use of the SC
The following diagrams show how many students used the SC during the tests in February and in June – according to their own statements:
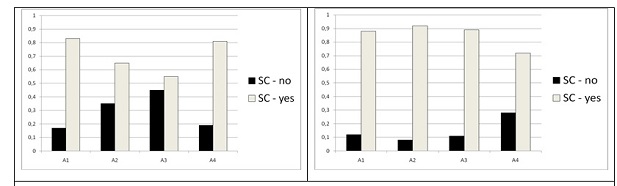
Table 4: Results of the SC-test in February (left) and June (right) 2007
The difference between SC use in February and in June shows an increase in use of the calculator. More over, those students who used the SC in June when solving the questions scored significantly better than those who did not use it. We attribute this to the fact that it takes a full school year for students to acquire adequate confidence in the SC, as well as knowledge of the benefits of its use as a tool when solving problems, to be able to use these for the purpose of solving problems.
4.3 The SC-use during the problem solving process
The students also provided information in the questionnaire as to whether they used the SC in the beginnung, during or at the end of the problem solving process.
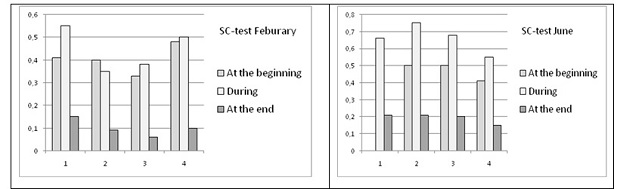
Table 7: Use of the SC during the course of the solving process (according to statements made by the students themselves)
When students integrate the SC into their solving process, it is predominantly used at the beginning and during the solving process. If we compare the middle of the school year with the end, we can observe a clear increase in the frequency of positive responses to “during”. This allows us to conclude that the SC is more strongly integrated into the solving process by the students at the end of the school year. A slight increase can also be observed “at the end”, which makes us aware that checking the solution is gaining in importance.
4.4 Teachers' predictions
Before each test was carried out, the teachers provided an assessment of the extent to which students would solve the problems. The results are as follows:
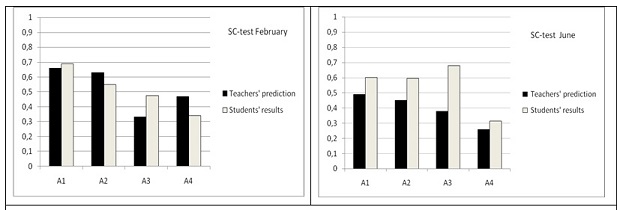
Table 9: Comparison of teachers' predicted and student results in the SC tests
It is noticeable that the teachers underestimated the students in the June test.
4.5 Evaluation questions regarding the SC-tests
The responses of the students confirm that familiarity with the new tool requires a very long process of getting used to it. After one year of SC use, confidence in and familiarity with the SC grow. However there is still a large group of students who experience technical difficulties when operating the SC. Difficulties with the type and manner in which to document the solution decreased, but still remain at a high level. This latter point will continue to be a permanent challenge when working with the SC, as there is no algorithmic solution for the procedure.
5. Evaluation Questionnaire for students and teachers
The teachers completed an evaluation sheet at the end of the school year and also completed a monthly online questionnaire. The students completed an online questionnaire.
5.1 The teacher questionnaire
The SC is regarded by teachers as being a beneficial new tool. It changes teaching methodology, provides an opportunity to integrate new content or at least for new treatment of old content and serves students as a visualisation and checking instrument. The calculator is generally used in a carefully considered and very restrained way. As well as using the SC for function plotting, it is also used for equation solving and substitution. The computer algebra component of the SC is regarded as an important element. Numerical and graphic methods appear to play a more subordinate role.
5.2 The student questionnaire[6]
A large majority see the SC as being helpful and as providing security when solving problems. A polarisation into two approximately equal proportions of attitudes reflecting approval and rejection is indicated. At the end of the school year approximately a quarter of students says that they still have operating or technical problems with the SC, that they don’t know how to use the SC in written exams and two fifth of the students do not know what documentation is expected when using the SC.
- Questions for the future
If we summarise the core results of this one-year school project there are some questions for up-coming investigations.
Methodology of pre- and post-tests. Hopes have not been fulfilled that students in the project classes would improve to a greater degree in terms of dealing with and interpreting graphs than students in the control classes. The hypothesis is that students in the project classes are not have been adequately challenged or motivated as the result of the largely traditional nature of the test problems. This raises the question whether the used pre- and post-test methodology is an adequate method to answer this question.
Polarisation. When working with new technologies, polarisation occurs in that some students benefit greatly from SC use, whereas for other students, SC use inhibits performance or even decreases performance. Two thirds of students are of the opinion that the SC was helpful and made them more secure and they classify lessons as “interesting”. Approximately one third of students do not share this view. Are there ways to get all students convinced of the benefits of the SC?
Calculator use. The reasons for non-use of the calculator are on the one hand the uncertainty of students regarding technical handling of the unit and on the other hand a lack of knowledge regarding use of the unit in a way which is appropriate for the particular problem. Is there a correlation between these two aspects?
Period of adjustment. It is surprising that it took almost a year to establish familiarity with this tool for students to use it in an adequate way. Will there be ways to shorten this period of adjustment?
Solution documentation. Students have problems how to record solutions when using the SC. Are there documentation rules for all or a special type of problems?
References:
Drijvers, P. (2003) Learning Algebra in a Computer Algebra Environment, Design Research on the Understanding of the Concept of Parameter, Dissertation, Utrecht.
Guin, D., Ruthven, K. and Trouche L. (Eds) (2005) The Didactical Challenge of Symbolic Calculators, New York: Springer.
Pierce, R. and Stacey, K. (2004) A Framework for Monitoring Progress and Planning Teaching towards the effective Use of Computer Algebra Systems, International Journal of Computers for Mathematical Learning9, 59-93.
Schneider, E. (2000) Teacher Experiences with the Use of a CAS in a Mathematics Classroom, International Journal of Computer Algebra in Mathematics Education, 7, 119-141.
Weigand, H.-G. (2006), Der Einsatz eines Taschencomputers in der 10. Jahrgangsstufe - Evaluation eines einjährigen Schulversuchs, Journal für Mathematik-Didaktik (2006), 89-112
Weigand, H.-G. (2008), Teaching with a Symbolic Calculator in 10th Grade - Evaluation of a One Year Project, International Journal for Technology in Mathematics Education, Volume 15, No 1, 19-32
[1] One sort of learning units developed during the M³ project are called “Minute Made Math”, more information on www.minute-made-math.com
[2] The performance criteria used relate to the results of the initial tests.
[3] See: www.dmuw.de/weigand/2009/CERME6/
[4] The “good” students form the upper performance quartile, the “weak” students the lower performance quartile, and the “average” students are represented by the two central performance quartiles.
[5] See: www.dmuw.de/weigand/2009/CERME6/
[6] See www.dmuw.de/weigand/2009/CERME6/
Resources
- 24 x 7 Availability.
- Trained and Certified Experts.
- Deadline Guaranteed.
- Plagiarism Free.
- Privacy Guaranteed.
- Free download.
- Online help for all project.
- Homework Help Services
Testimonials
Urgenthomework helped me with finance homework problems and taught math portion of my course as well. Initially, I used a tutor that taught me math course I felt that as if I was not getting the help I needed. With the help of Urgenthomework, I got precisely where I was weak: Sheryl. Read More
