Scatter plot and correlation coefficient homework help
A Scatter plot and correlation coefficient are the two methods used in Bivariable data analysis. They both are calculated through different processes and in different manners. They both produce different kinds of results. Both of them are used to figure out the relationship between the two variables. Scatterplot uses graphs to find out the type of relationship they both have. While the correlation coefficient can point out to the measure to which they are related. To learn more and get the on-time submission, take scatter plot and correlation coefficient homework help, to complete your homework. Through scatter, plot and correlation coefficient assignment help you get your assignment submissions on time, every time. Here is the explanation for the scatter plot and correlation coefficient given:
Scatter Plot
The simplest way to measure the nature of bivariable data is a scatter plot. In the scatter plot, a point-based graph is made using the data given. The graph resulting in all the points is then seen and analysed to find the relation between the two variables. This graph later uses linear regression and other techniques to analyse further.
Example: Data of 5 students from class 10th was collected to find how many pens and pencils they have with them. Here is the data table:
|
Students |
Pens |
Pencils |
|
1 |
2 |
3 |
|
2 |
5 |
1 |
|
3 |
3 |
3 |
|
4 |
4 |
2 |
|
5 |
1 |
5 |
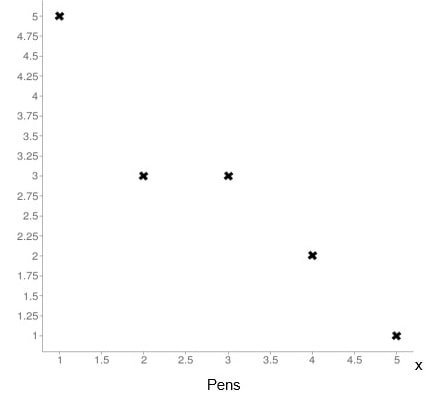
Here is the scatter plot for the given data,

In the above graph, the x-axis represents pens and the y-axis represents pencils. The graph shows that both the variables share a negative relation, as when one increases the other decreases. To know more about the different types of graphs and their application, scatter plot and correlation coefficient homework help to learn more and to get your homework completed. We also offer to scatter plot and correlation coefficient assignment help to get your assignment deadlines fulfilled.
For learning linear regression plot lining and more analytical tools based on scatter plot, get scatter plot and correlation coefficient homework help to learn more.

Correlation Coefficient
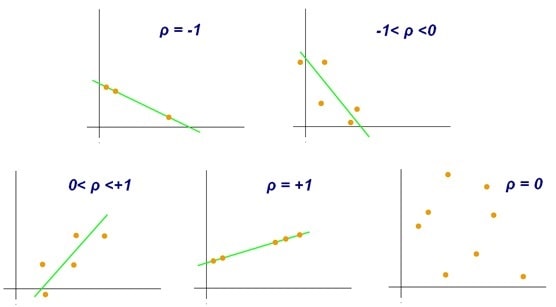
Correlation Coefficient is a method that is used to measure to what extent the two variables relate to each other. Its score ranges between -1 to 1. There are many formulas and many applications of those formulas to find out the correlation coefficient, if you are stuck with any of those problems get scatter plot and correlation coefficient homework help from our experts.
Here we will calculate the correlation coefficient through Pearson’s method. The formula for this is:
r = 
Example: Here we will calculate the correlation coefficient for the data given in the table for the above-mentioned data.
|
Students |
Pens |
Pencils |
|
1 |
2 |
3 |
|
2 |
5 |
1 |
|
3 |
3 |
3 |
|
4 |
4 |
2 |
|
5 |
1 |
5 |
Firstly we will make a table containing and calculating all the details we will need.
|
Subject |
Pens (x) |
Pencils (y) |
(xy) |
(x |
(y |
|
1 |
2 |
3 |
6 |
4 |
9 |
|
2 |
5 |
1 |
5 |
25 |
1 |
|
3 |
3 |
3 |
9 |
9 |
9 |
|
4 |
4 |
2 |
8 |
16 |
4 |
|
5 |
1 |
5 |
5 |
1 |
25 |
|
15 |
14 |
33 |
55 |
48 |
From the table, we get all the data we need,
∑x= 15
∑y= 14
∑xy= 33
∑x2= 55
∑y2;= 48
And, n= 5.
Now, if we put this data in the formula,

This means that the two variables are highly inversely related to each other
This is one of the many samples of the solved questions on finding the Correlation coefficient of bivariable data. To get more of these samples try to scatter plot and correlation coefficient homework help and get your suggested questions solved. If you still did not understand this and want in-depth calculation, getting scatter plot and correlation coefficient assignment help to get solutions for even toughest topics.
Scatter plot and correlation coefficient homework help:
To get help with your homework, or to find samples, or to get solutions for questions related to scatter plot and correlation coefficient, get help from our tutors who are knowledgeable, experienced and well-known in their field of work.
Our scatter plot and correlation coefficient assignment help offer on-time, quality assured assignment so that you do not have any complaints regarding it.
But if you have any complaints, whatsoever, scatter plot and correlation coefficient homework help come with 24*7 support services, for dealing with every minute and/or important problems.

