
Practical Data Management and Analysis for Public Health Assignment 1
Graded Assignment 1
In recent years, overweight and obesity have emerged as major public health issues in the United States. This is due in part to their contribution to life-threatening conditions such as diabetes and hypertension. Nor are young people immune. According to the Centers for Disease Control and Prevention, 13% of high school students in the United States in 2011 were obese. Although some cases of obesity occur due to underlying metabolic disorders, the majority of cases are attributable to sustained excesses of calories consumed (diet) relative to calories expended (physical activity). For this reason, interventions to reduce overweight and obesity among high school students and other populations have sought to decrease the number of calories that people consume or to increase the amount of physical activity people engage in.
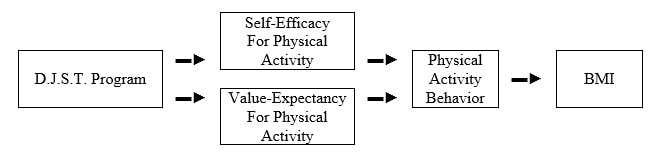
In response to growing concerns about overweight and obesity in high school students, a large municipal school district is considering implementing a physical activity promotion program called “Don’t Just Sit There” in its ten high schools. The intervention is not cheap, however, and in a time of budget cuts the municipal education administration decides to conduct a randomized trial of the intervention in three high schools. The goal is to determine whether the intervention is effective in altering key psychosocial precursors to physical activity, increasing physical activity itself, and reducing the prevalence of overweight and obesity. The psychosocial factors of interest are (a) students’ self-efficacy to engage in moderate to vigorous physical activity during their free time on most days, and (b) students’ perceived value of engaging in moderate to vigorous physical activity. Thus, a simple conceptual model for the information is as follows.
The trial works as follows. Three schools are participating: Clara Barton High School, Frederick Douglas High School, and Harvey Milk High School. In each of these schools, administrators recruit 100 students and collect baseline data from them at the beginning of the school year. The baseline data include measures of self-efficacy, perceived value, and demographic factors assessed via a self-report questionnaire; physical activity assessed by having each student wear a ActiGraph accelerometer for one week; and height and weight measured in each school’s nurse’s office. After baseline measurement is complete, students are assigned to either the treatment group or the control group via randomization. Treatment group members are then offered the Don’t Just Sit There intervention for six months, while control group members receive no intervention. At the end of the six months, the same procedures are used to assess the psychosocial, behavioral, and health variables again.
Assignment
In this assignment, you are tasked with working on the baseline data. You will be provided with three SPSS datasets (School1PRE.sav, School2PRE.sav, and School3PRE.sav) and a codebook (DJSTcodebook.doc). You are also given a copy of the questionnaire that students were asked to complete (DJSTquestionnaire.doc). The datasets contain the baseline data from the three study high schools, and the codebook and questionnaire contain all of the information you should need to make sense of these data. You are to use SPSS to carry out the following specific tasks:
1. Merge the three datasets into a single file, DJSTpre1.sav.
2. Obtain frequencies and/or descriptive statistics on all raw variables.
3. Following the value-expectancy framework, derive value-expectancies for each of the eight possible outcomes of physical activity (coping with stress, having fun, etc.). Do this by multiplying each expectancy variable (e.g., It would help me cope with stress) by the corresponding value variable (e.g., How positive or negative would you feel about coping well with stress). For example, VE1pre would be defined as A1pre·C1pre. Note that the value variables (C1pre through C8pre) are coded from -1 (Very Negative) to 1 (Very Positive) so that the new variables you compute here can, in theory, range from -5 (Strongly Agree and Very Negative) to 5 (Strongly Agree and Very Positive)
4. Compute Cronbach’s alpha for the eight derived value-expectancy measures (VE1pre through VE8pre), and for eight items measuring self-efficacy (B1pre through B8pre).
5. Derive a baseline value-expectancy scale score (VEpre) as the mean of the eight valueexpectancy measures (VE1pre through VE8pre), and a baseline self-efficacy scale score (SEpre) as the mean of the eight self-efficacy indicators (B1pre through B8pre).
6. Compute a baseline BMI variable, BMIpre, as weight (in kilograms) divided by height (in meters) squared.
7. From BMIpre, derive the ordinal variable WGTGRPpre so that students whose BMI is less than 18.5 are categorized as underweight (coded 1), those whose BMI is between 18.5 and 25 are categorized as normal weight (coded 2), those whose BMI is between 25 and 30 are categorized as overweight (coded 3), and those whose BMI is greater than 30 are categorized as obese (coded 4).
8. From either BMIpre or WGTGRPpre, compute a 0-or-1 indicator of being obese, OBESEpre.
9. Save the modified dataset under the new name DJSTpre2.sav.
10. Obtain frequencies and/or descriptive statistics on the following derived variables: SEpre, VEpre, PHYSACTpre, BMIpre, WGTGRPpre, and OBESEpre.
11. Obtain subgroup-specific frequencies and/or descriptive statistics for each of the derived variables mentioned in Part 10 for the treatment and control groups. Also obtain subgroup specific frequencies on MALE, RACE, and GRADE according to experimental group.
12. Run pairwise correlations between SEpre, VEpre, PHYSACTpre, and BMIpre.
Submission In the Assignments section, please upload the following to the Graded Assignment 1 page 24 hours before live session 5:
(1) An SPSS syntax file that accomplishes Tasks 1 through 12. The file should contain all of the commands necessary for accomplishing these tasks, in the specified order, and should not contain any extraneous commands.
(2) Your dataset DJSTpre2.sav.
(3) A report on the baseline data. That report should include four tables in which you collect the results from Task 2 of the assignment. One table should cover questionnaire items A1 through A8 and B1 through B8; the second should cover items C1 through C8; the third should cover SCHOOL, MALE, RACE, GRADE, and TREAT; and the fourth should cover PHYSACTpre, HEIGHTpre, and WEIGHTpre. The report should also present information on the internal consistency (Task 4) of the baseline self-efficacy and value-expectancy scales, as well as the correlation between these two scales and baseline physical activity and BMI (Task 12). Finally, the report should include a single table collecting the results from Tasks 10 and 11, along with your commentary on whether the randomization appears to have worked; that is, whether the treatment and control grups appear to differ with respect to MALE, RACE, GRADE, SEpre, VEpre, PHYSACTpre, BMIpre, WGTGRPpre, and OBESEpre.
Note that the data for this assignment are simulated, and that the simulation drew upon several elements described in the following references:
Dishman, R. K., Motl, R. W., Saunders, R., Felton, G., Ward, D. S., Dowda, M., & Pate, R. R. (2004). Self-efficacy partially mediates the effect of a school-based physical-activity intervention among adolescent girls. Preventive Medicine, 38, 628-636.
Grydeland, M., Bergh, I. H., Bjelland, M., Lien, N., Andersen, L. F., Ommundsen, Y., Klepp, K., & Anderssen, S. A. (2013). Intervention effects on physical activity: the HEIA study – a cluster randomized controlled trial. International Journal of Nutrition and Physical Activity, 10, 17.
Motl, R. W., Dishman, R. K., Trost, S. G., Saunders, R. P., Dowda, M., Felton, G., Ward, D. S. & Pate, R. R. (2000). Factorial validity and invariance of questionnaires measuring socialcognitive determinants of physical activity among adolescent girls. Preventive Medicine, 31, 584-594.
Buy Practical Data Management and Analysis for Public Health Assignment 1 Answers Online
Talk to our expert to get the help with Practical Data Management and Analysis for Public Health Assignment 1 to complete your assessment on time and boost your grades now
The main aim/motive of the management assignment help services is to get connect with a greater number of students, and effectively help, and support them in getting completing their assignments the students also get find this a wonderful opportunity where they could effectively learn more about their topics, as the experts also have the best team members with them in which all the members effectively support each other to get complete their diploma assignments. They complete the assessments of the students in an appropriate manner and deliver them back to the students before the due date of the assignment so that the students could timely submit this, and can score higher marks. The experts of the assignment help services at urgenthomework.com are so much skilled, capable, talented, and experienced in their field of programming homework help writing assignments, so, for this, they can effectively write the best economics assignment help services.
