
SAS Homework Help

Hire SAS Homework Help Professionals to Boost Grades
The SAS language is a computer programming language used for statistical analysis, created by Anthony James Barr at North Carolina State University. It can read in data from common spreadsheets and databases and output the results of statistical analyses in tables, graphs, and as RTF, HTML, and PDF documents. SAS Programming Help
Need For SAS
The analytics market has grown immensely in the last few years. This has resulted in an increase in the number of tools used. All of these are beneficial in one way or the other. It is the most used tool in the commercial analytics market. With a plethora of statistical functions and good GUI (Enterprise Guide & Miner), it certainly leads the market.
SAS As A Programming Language
Most programming environments are either menu-driven (point-and-click) or command-driven (enter and execute commands). However, SAS is neither menu-driven nor command driven. This is because it uses a series of instructions or statements known as the SAS program. This program is a depiction of what you want to do and is written in the SAS language. Data is central to every data set. In SAS, data is available in tabular form where variables occupy the column space, and observations occupy the row space.
SAS Software Components for SAS Assignment Help and SAS Programming Help Online
- Base SAS: It is the most widely used component. It has a data management facility. You can do data analysis using Base SAS.
- SAS/GRAPH: With the use of SAS/Graph you can represent data as graphs. This makes data visualization easy.
- SAS/STAT: It lets you perform Statistical analysis, such as Variance, Regression, Multivariate, Survival, and Psychometric analysis.
- SAS/ETS: It is suited for Time Series Analysis.
SAS allows programmers to perform functions in SAS Homework Help Services
- Build-up and management of data, retrieval of information
- Econometrics, statistical analysis, and data mining
- Plays a great part in business planning, forecasting, and support in decisions
- Quality improvement, operations research and management of analytical projects
- Allow the development of statistical and analytical applications
- Enhance data warehousing that includes extraction, transformation, and loading of data
- Allows remote computation being a platform-independent software
- social, economic, and environmental aspects.
Use our SAS Assignment Help Services and sit relax to get High Marks
If you want to get SAS Assignment Help or SAS Homework Help from statistics homework helper is among the best statistics assignment helper. Students say this as they have first hand benefited from the awesome services provided about SAS assignments. Students have ordered SAS college help about seven-time and at all times the site homework help made them happy clients. Below are some of the key advantages that make the website the best SAS assignment help provider.
- The website has multiple SAS programming homework assistance. This is important as students can upload multiple assignments and get them completed.
- The site gives special emphasis on providing the student's wit accurate SAS Programming Assignment Solutions. Well! this is true, my SAS assignments scored grade A + which made me order for more assignments when need be.
- Most importantly, the customer support and the expert at the websites give more emphasis on time, this includes both time for the assignment to be completed and responding times for customer support.
- Free revisions and changes for all projects completed by the website.
- Having seen what makes All Homework Assignments the best SAS help provider, you can engage them using the link to clarify any query one might have before uploading their assignments.
All Homework Assignments can be used to quickly upload the SAS assignment and get a quick.
Running A program as SAS Assignments for practice For SAS Homework Help at Urgenthomework
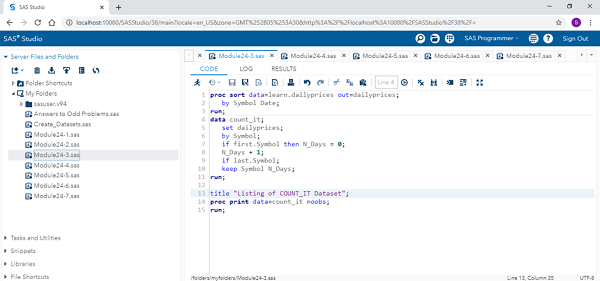
Now that we have understood how to install SAS University Edition, next in our SAS Tutorial let us take at a sample SAS program.
Create a temporary SAS data set with two variables, N_Days, and Symbol, by writing a DATA step and using the SAS data set DailyPrices as input. N_Days represents the number of observations for each stock.
Topics Covered for SAS Homework Help Online and The Benefits Of Using SAS Software for Analysis
|
Data Management |
Multivariate Analysis |
|
Regression |
Graphics |
|
Logistic Regression |
Operations Research |
|
Survival Analysis |
Quality Control |
|
Analysis Of Variance (ANOVA) |
Data Mining |
|
Factor Analysis |
Clinical Trial Analysis |
Statistics Homework Help using SAS and other tools
- Linear Programming Homework Help
- SAS Assignment Help
- JMP Homework Help
- STATA Homework Help
- Data Analysis Homework Help
- SPSS Homework Help
- R Programming Homework Help
- Tableau Homework Help
- Eviews Homework Help
Why We are the best for SAS Homework Help from
- Professional Guidance
- Deadline Guarantee
- Money-Back Guarantee
- 24 Hours Availability
- Plagiarism free Assignments
- Unlimited Revision
- A Better Understanding of the Subject
- Improvement in Grades
